
Last updated:
Build Queries
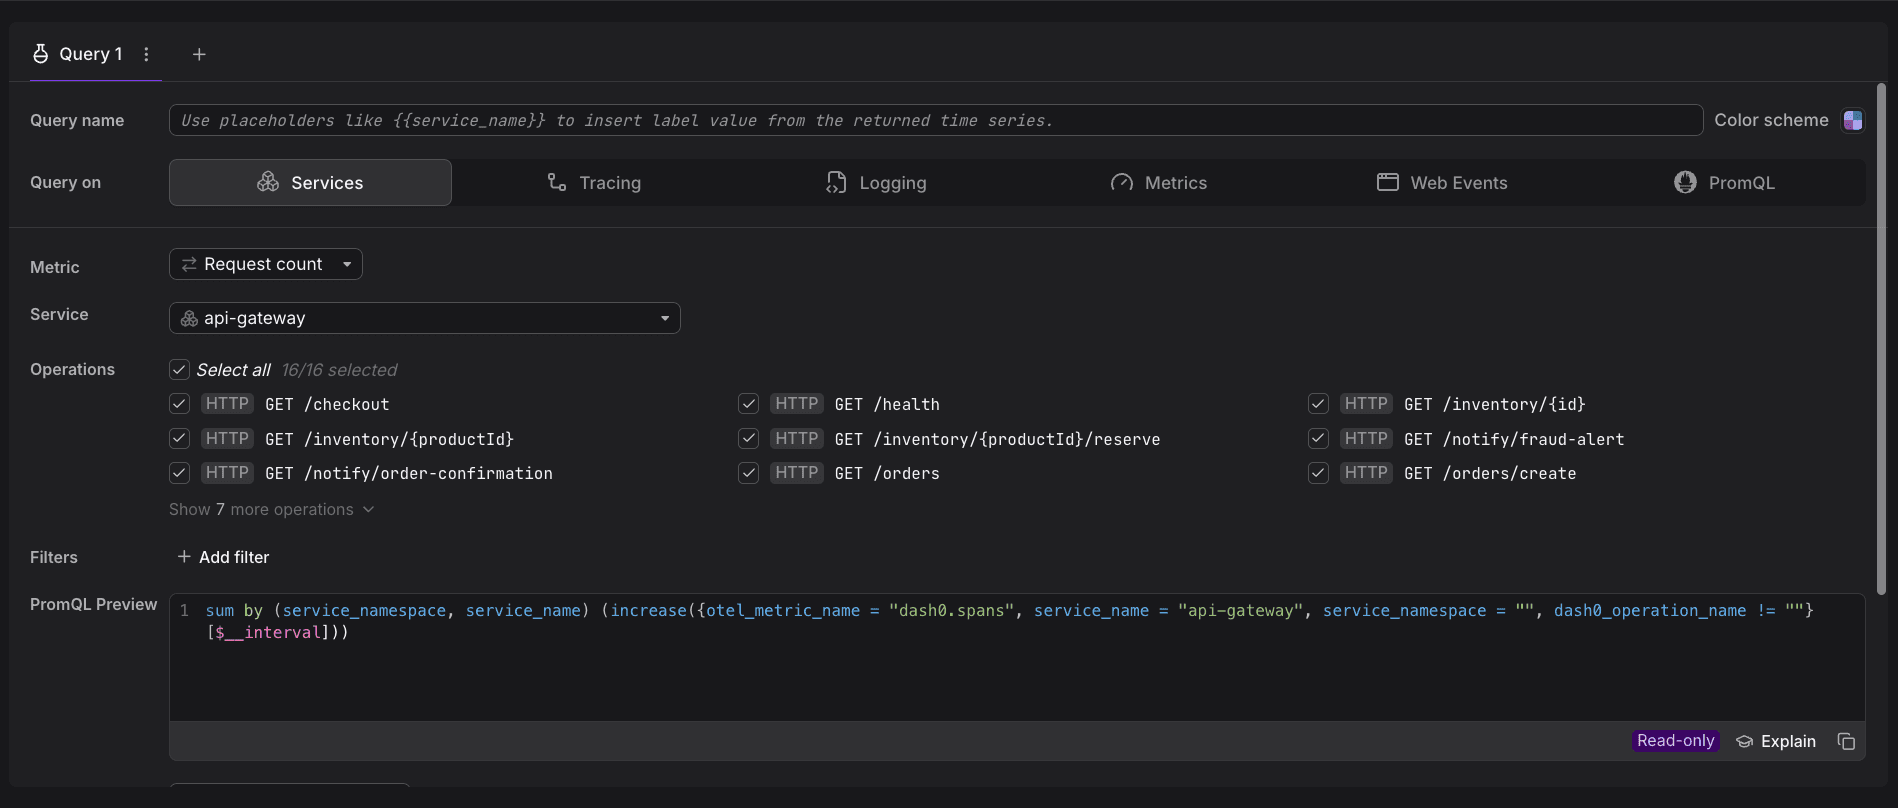
The Query Builder provides a visual interface for constructing data queries without writing PromQL directly.
It is designed to make complex query construction accessible to users who may not be familiar with PromQL syntax.
Use the Query Builder
When editing a panel, open the Query Builder from the panel's data configuration area.
The builder guides you through selecting metrics, applying filters, and choosing aggregation functions.
The resulting PromQL expression is generated automatically and can be viewed or edited directly.
To reference a dashboard variable in either the Query Builder or an inline PromQL query, see Bind a Variable to a Query. Each variable type interpolates differently, and the panel's query mode changes which operators are available at the bind site.
Add Multiple Queries
A single panel supports multiple independent queries. Each query operates as a separate data source and can target different signal types. Queries can be reordered and individually assigned display colors.
The query panel provides tabs for isolating queries by signal type:
- Services
- Tracing
- Logging
- Metrics
- Web Events
Interpret Query Warnings
When a query returns more time series than the panel's display limit allows, a query warning is shown.
This alerts you that the visualization is incomplete and that you should either refine the query or adjust the panel's limit setting.
Further Reading
- Add Panels — Place and arrange panels on the dashboard canvas
- Add Variables — Define parametric selections that panels can reference
- Bind a Variable to a Query — Wire a variable's selection into a panel query
- Configure Panels — Set chart type, formatting, and visual style for a panel
- Reference: Chart Types — Choose the right visualization for your data