Last updated: July 14, 2026
Add Panels
In a dashboard, each panel is an independent visualization unit with its own queries, chart type, and styling options.
The available options vary based on the selected chart type.
For faster dashboard creation, Agent0 can generate entire dashboards with multiple panels from natural language descriptions. See Generate Dashboards with Agent0 for details.
Add a Panel
Once you have a dashboard, the next step is to add one or more panels to it.
-
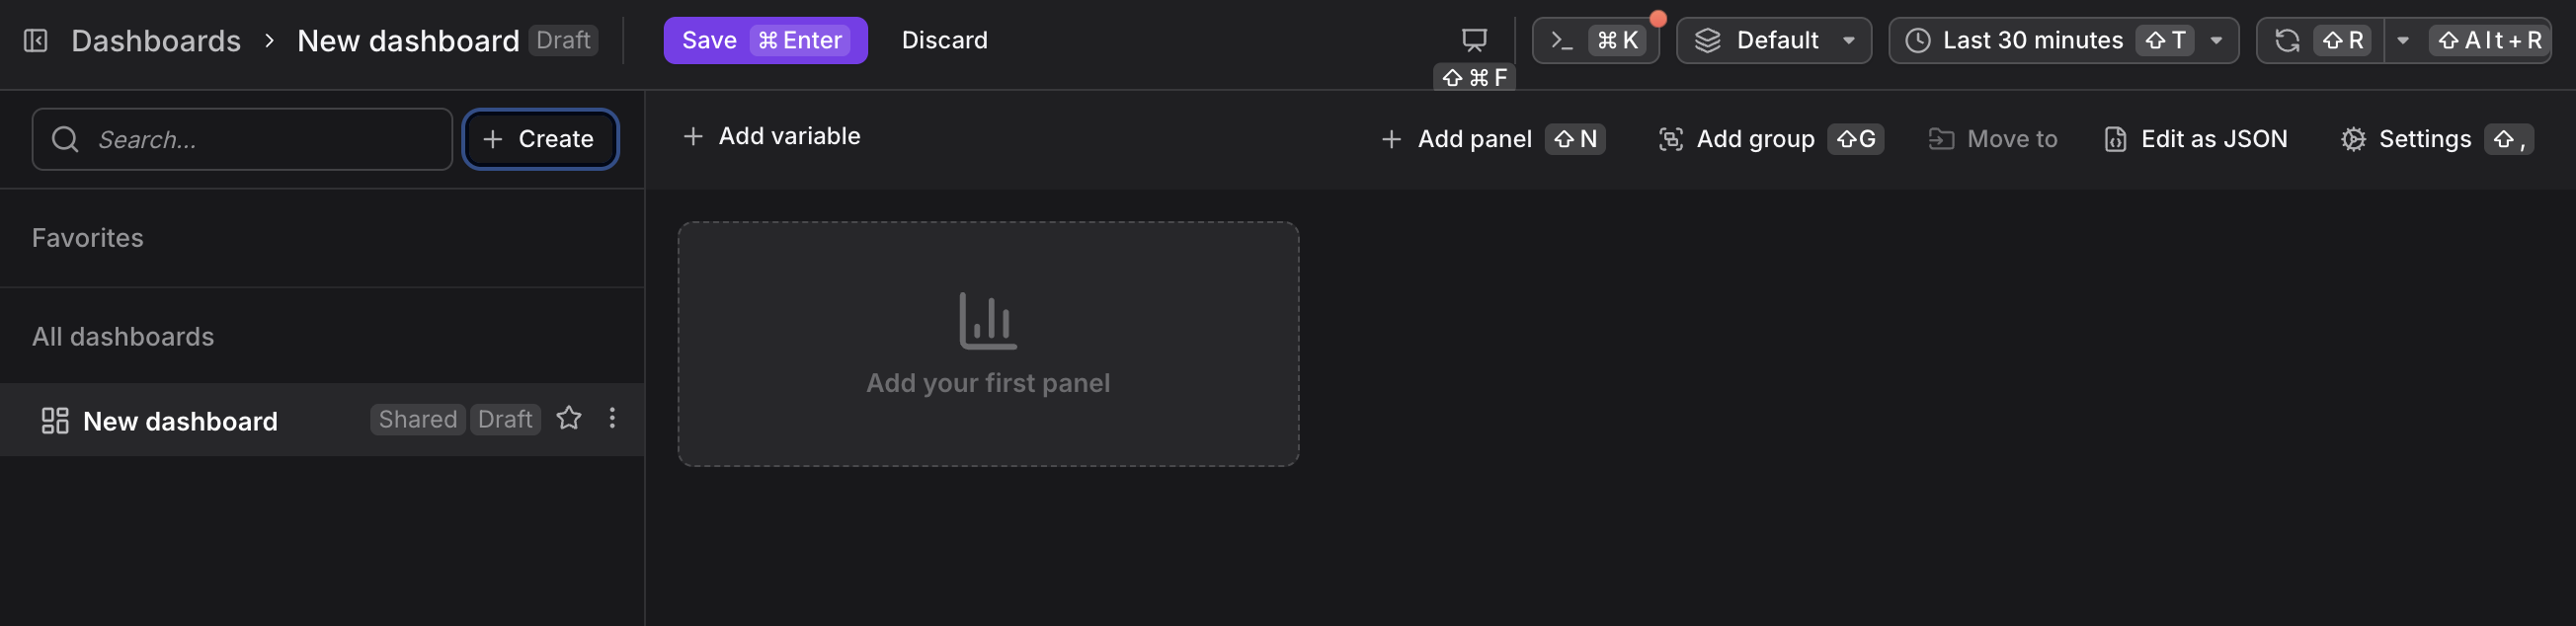
Click the Add your first panel tile or click Add panel in the dashboard toolbar.

-
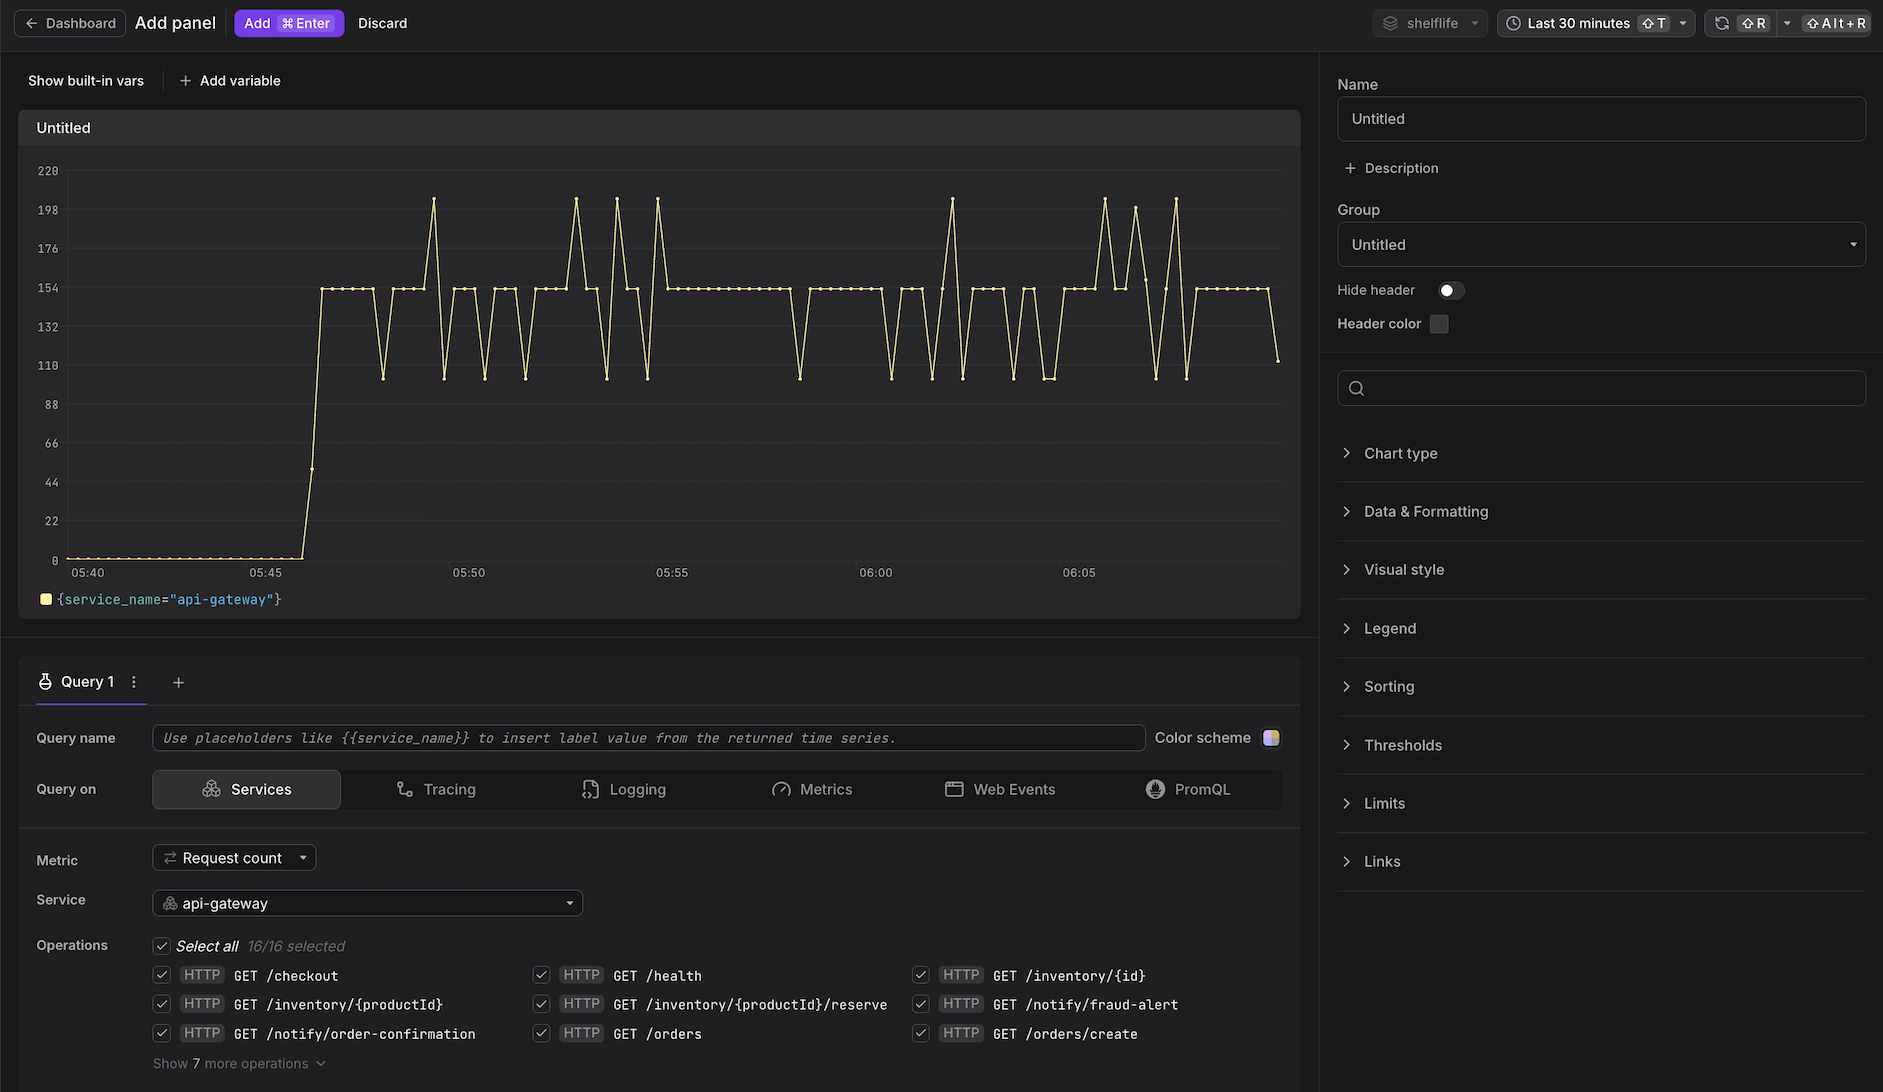
A panel preview appears on the canvas, where you can configure the query and panel options.

For details on the above, see Configure Panels.
NoteWhen you see the above, you are looking at a preview of the panel before it is instantiated. You must explicitly click the purple Add button in the top horizontal navigation bar to place the panel on the canvas.
-
Click the purple Add button to place the panel.
-
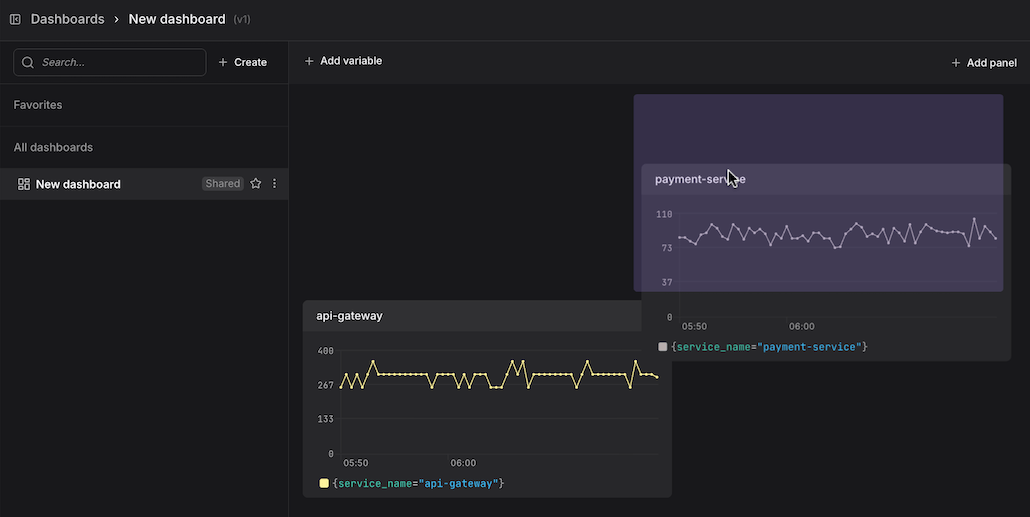
Resize and reposition the panel by dragging its edges or moving it on the canvas.
 Note
NotePanels behave like sticky notes on a canvas. You can freely drag them to any position and resize them by pulling their edges.
-
Click Add group in the toolbar to add a group, then configure your panels to be added to it. Groups let you collapse and expand panels together to manage visual clutter. They let you link directly to a specific group by its anchor URL.