Added the ability to hide charts in explorers, web monitoring sessions and resources, for increased usability of the tables, triage and grouping capabilities.
We've introduced the ability to hide the main (top-most) chart in various explorers. Hiding these charts gives you more screen real estate to display more entries (e.g., more logs in the logs explorer).
Dashboard charts now support saving sorting configuration across multiple chart types.
Sorting controls have also been unified into one location in the sidebar, along with the ability to simply click and sort on the charts themselves.
What’s New
We’ve added the ability to sort list and table legends for various chart types in dashboards.Additionally, we’ve also added the ability to sort the grids of both gauge and stats charts, along with the ability to also sort the slices of the pie chart.
Sorting is available for the following chart types:
Time series chart
Stat charts
Gauge charts
Time series table
Pie chart
Logs table
Geographical map
In addition to the above, we’ve also taken the chance of streamlining where the sorting controls live: they now appear consistently in the right sidebar of the Panel Edit screen.
It is also possible to directly sort a table by directly clicking on the column header whilst editing the panel
That latest releases of the Dash0 operator for Kubernetes adds zero-touch auto-instrumentation for .NET workloads.
Having to set up OpenTelemetry SDKs in your applications is a hassle. Wouldn't it be so much nicer if telemetry collection just worked automatically for your production workloads? Enter the Dash0 operator: Not only does it take care of setting up and configuring the OpenTelemetry collector for you, it also makes sure your applications send telemetry to the collector (and thus to Dash0), so you have end-to-end visibility into what is going on in your Kubernetes clusters.
The operator already supports automatic instrumentation for a few other runtimes, and now .NET joins the party. Starting with release 0.83.0 of the Dash0 operator, it will instrument .NET workloads for sending traces, metrics and logs automatically to Dash0.
Dash0 now supports OpenTelemetry Exponential Histograms for a more accurate, high-resolution metric visualization.
We are excited to announce that Dash0 now supports Exponential Histograms — the next-generation histogram format introduced by OpenTelemetry.
Dash0 has already been ingesting and storing exponential histograms from OpenTelemetry sources, but until now these metrics could only be listed in the UI. With this update, exponential histograms can be queried and visualized, allowing you to explore, graph, and analyze these metrics alongside regular histograms.
Unlike regular histograms with fixed bucket boundaries, exponential histograms use dynamically scaled buckets that automatically adjust to the magnitude of recorded values. This allows Dash0 to:
Efficiently represent metrics with** high dynamic ranges** (for example, latency from microseconds to seconds).
Maintain higher precision without excessive memory usage.
Provide smoother and more accurate visualization for metrics such as latency, request duration, or payload sizes.
Dash0 ingests and stores OpenTelemetry exponential histograms in their native form, translating them into native histogram representation for querying and visualization in the UI. This ensures full compatibility with OpenTelemetry data while preserving the precision and scale of the original metrics.
This update allows you to **use any of the standard **Prometheus histogram functions — such as histogram_quantile() — with full precision and scale preserved from the original OpenTelemetry data.
With this release, Access Control in Dash0 is now complete: all observability assets - including dashboards, views, check rules, and synthetic checks can be shared with Teams and individual users.
This release closes the loop on Access Control in Dash0. You can now manage sharing across all key observability assets with the same, simple model - giving teams the flexibility to collaborate while keeping management clear and oversight consistent.
TV Mode now supports opening and viewing dashboard panels, enabling teams to inspect detailed metrics and queries while maintaining the distraction-free full-screen experience.
Panels can now be opened and viewed directly in TV mode (sometimes referred to "kiosk" mode) similarly to what is possible already with entire dashboards.
Also, we took the chance to make it clearer when you're in TV Mode, and how you can get out of it.
The Dash0 Web SDK for Website monitoring now supports AWS X-Ray trace propagation, enabling seamless end-to-end tracing for applications using AWS managed infrastructure.
Dash0’s Website monitoring gives you complete visibility into your application's performance from frontend to backend. By correlating web vitals with backend API calls, you can easily identify customer issues and understand the full user journey.
End to end trace from Frontend until Database call
OpenTelemetry provides well-defined interfaces for end-to-end tracing from client to the backend up until the database using context propagation headers. However, some key AWS services do not make use of this out of the box because of implementation details, specifically the format they use for trace context propagation (see our guide on distributed tracing for more details). Amazon API Gateway, Application Load Balancer and others don't use the W3C TraceContext specification, which OpenTelemetry uses by default: instead, the trace data they generate, which you can get into Dash0 using the Amazon CloudWatch Transaction Search integration, relies on you perform tracing via the AWS X-Ray headers. The outcome is that you may not get the full picture of your application's performance.
Trace without AWS X-Ray propagation
To prevent these issues, we've added X-Ray propagation support to our Web SDK, automatically bridging the gap between your frontend and AWS backend services. Now you can trace user interactions seamlessly through your entire AWS-powered application stack, giving you the complete observability you need to deliver exceptional user experiences.
Trace with AWS X-Ray propagation and Amazon CloudWatch transaction search
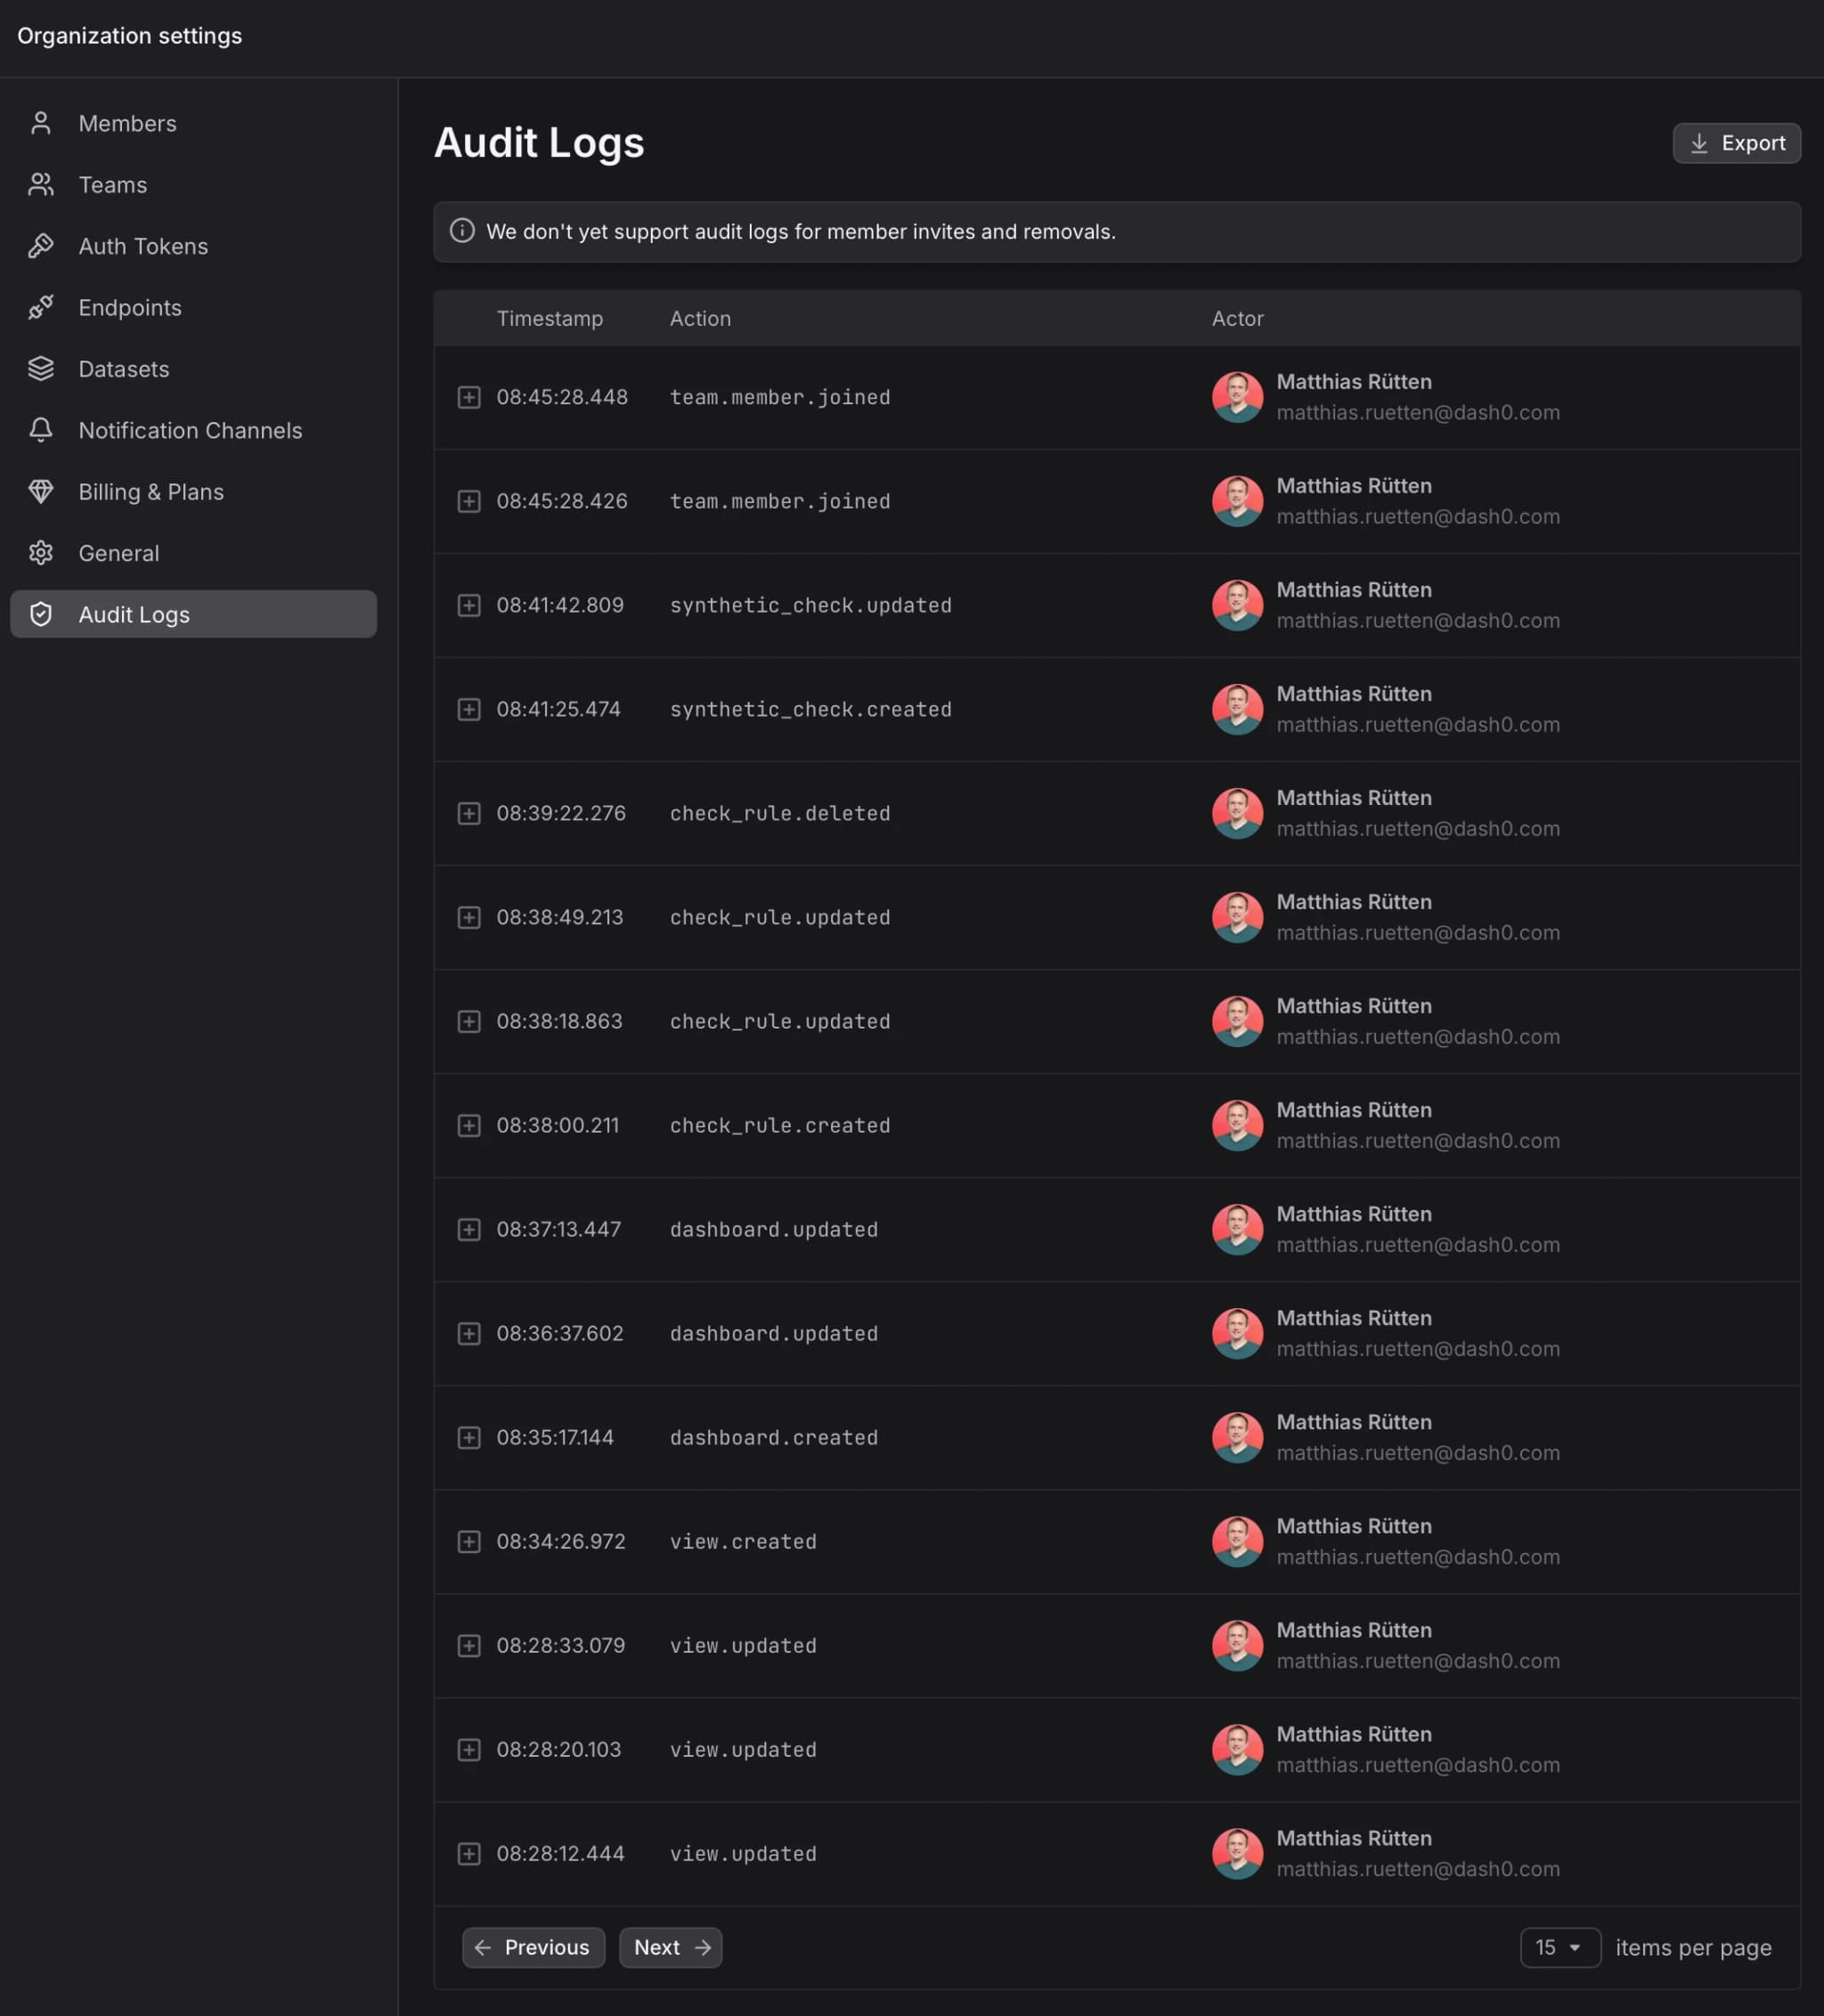
We are thrilled to announce the launch of our new Audit Logs feature. This powerful tool provides a chronological record of activities.
Audit logs are essential for security, compliance, accountability, and cyber forensics. They help in detecting unauthorized activities and providing accountability for personnel. They track user actions, system changes, and events, which is crucial for identifying anomalous behavior, ensuring regulatory compliance, and providing actionable insights for investigations.
Key Benefits
Enhanced Visibility: It provides a chronological record of activities. This helps in understanding the intent behind activities.
Security and Compliance: Audit logs are essential for security, compliance, accountability, and cyber forensics. They help in detecting unauthorized activities and providing accountability for personnel. They track user actions, system changes, and events, which is crucial for identifying anomalous behavior, ensuring regulatory compliance and providing actionable insights for investigations.
You can find the new Audit Logs feature in your organization settings.
We’ve expanded our global synthetic monitoring network with three new locations, giving you more flexibility and accuracy when testing your applications worldwide.
Synthetic monitoring from more regions helps you better understand your application’s performance where your users are. With these additions, you can pinpoint regional bottlenecks, improve reliability, and deliver faster digital experiences.