Expand your observability infrastructure as code capabilities with declarative management of check rules and custom views.
The latest version of the Dash0 Terraform Provider introduces the ability to manage check rules and views directly through Terraform, enabling you to deploy monitoring resources as code. You can now define alerting rules and custom views declaratively within your Terraform configurations. The provider automatically synchronizes these resources with your Dash0 organization, simplifying setup and maintenance of observability resources through infrastructure as code. This enhancement streamlines monitoring workflows and improves automation for users managing multiple environments.
The latest version of the operator introduces the ability to manage Dash0 synthetic monitoring checks directly through Kubernetes, enabling you to deploy checks as code. You can now define synthetic monitoring checks declaratively within a Kubernetes cluster. The operator automatically synchronizes these resources with your Dash0 organization, simplifying setup and maintenance of synthetic checks through infrastructure as code. This enhancement streamlines monitoring workflows and improves automation for users managing multiple environments.
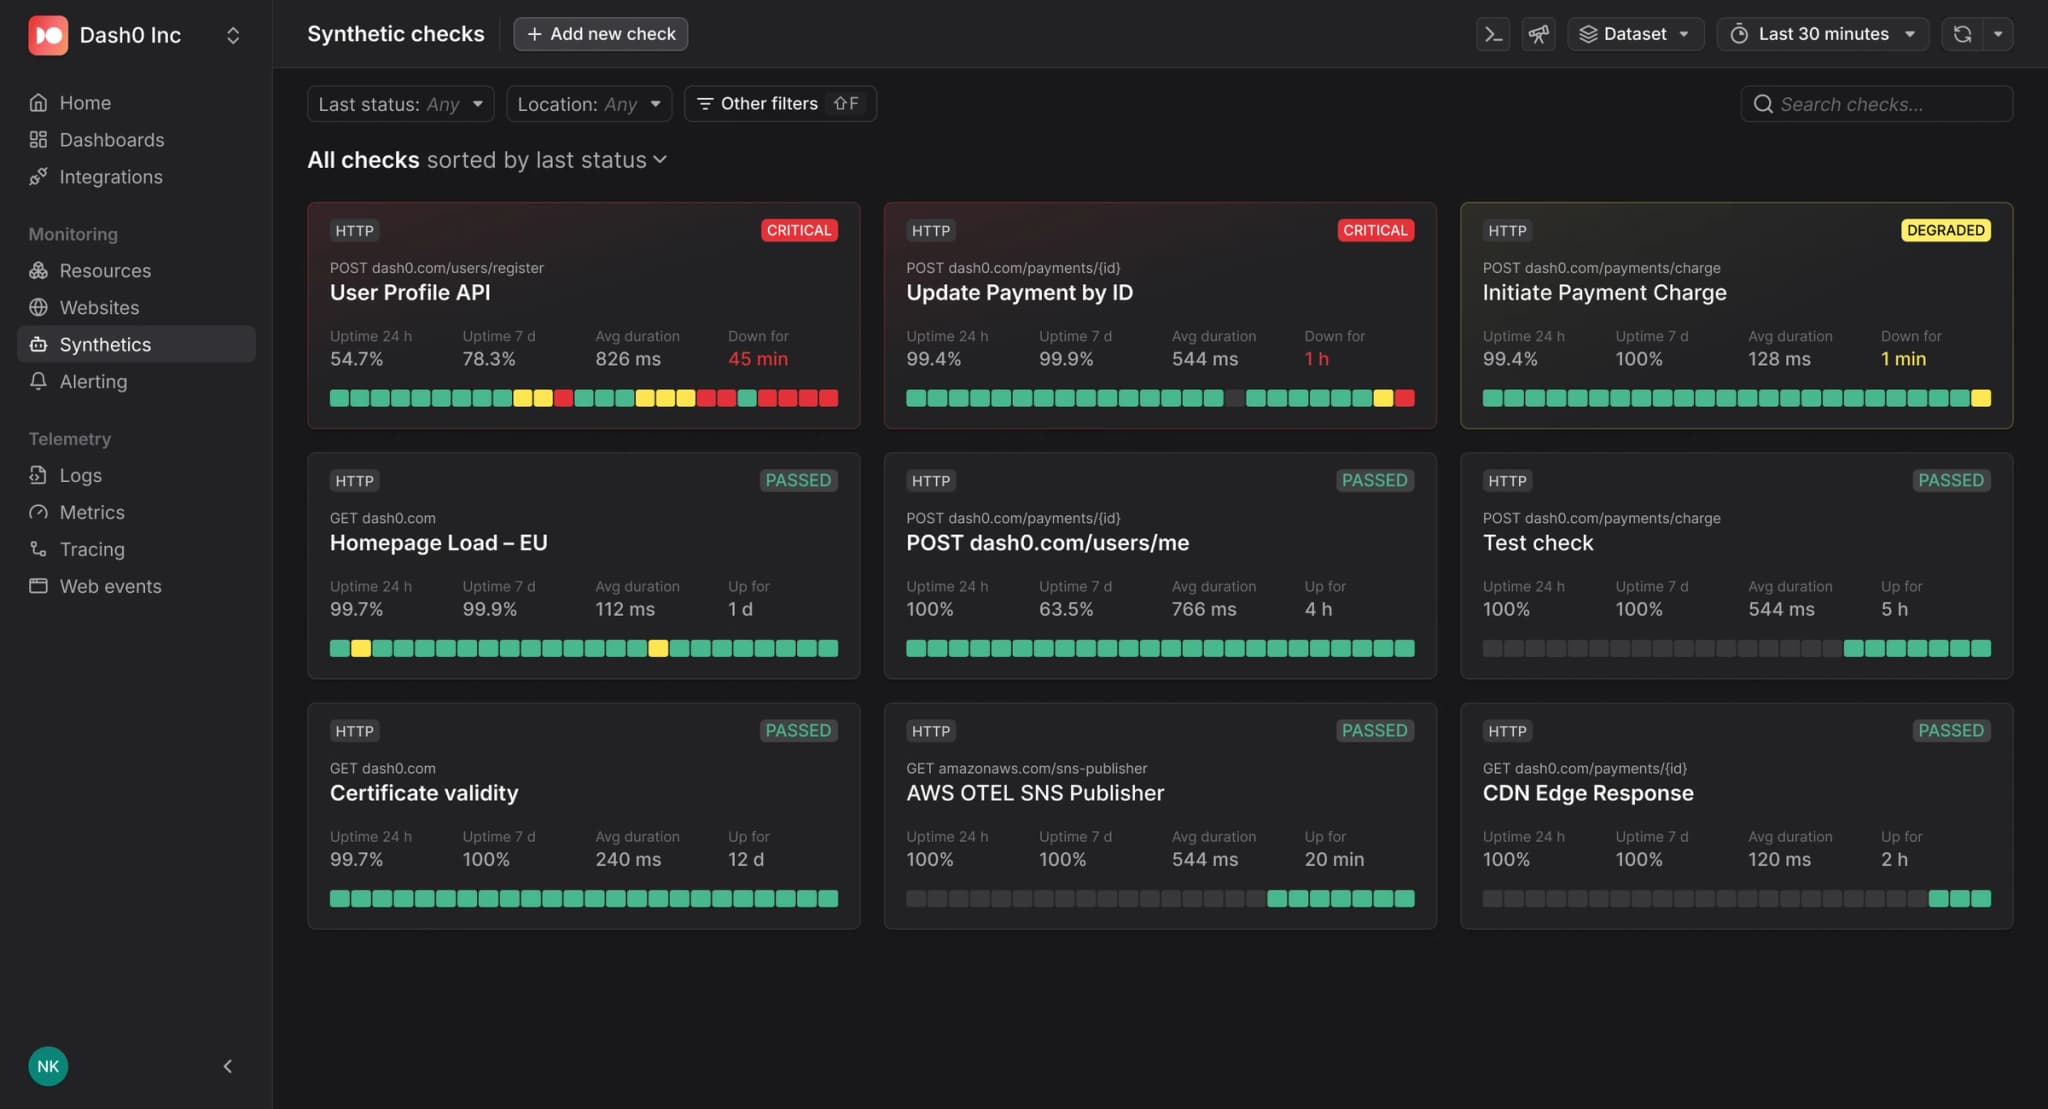
One-Click Setup: Create synthetic checks by adding your URL. Fully operational in under 60 seconds—no scripts or configuration files required.
Multi-Location Testing: Run checks from multiple global locations with one-click expansion. Monitor how your services perform for users from Frankfurt, Oregon, Melbourne, and soon more.
Deep Tracing Integration: Every span in every trace shows if it was triggered by a synthetic check and which one. Filter synthetic traffic during outages to focus on real user impact, or verify which operations are covered by synthetic monitoring. And, of course, it works with Triage as well.
Built-in Essentials: Uptime monitoring and SSL certificate expiration alerts included out of the box.
Infrastructure as Code: Already supported in the Dash0 Terraform Provider, and soon in the Dash0 Operator for Kubernetes as well!
We've completely redesigned Organization Settings to make managing your workspace simpler, faster, and more intuitive.
We've completely redesigned Organization Settings to make managing your organization simpler, faster, and more intuitive. The new experience is streamlined, easier to navigate, and organized to help you find what you need without unnecessary clutter.
What's New
Deep-Linkable Pages: Every settings section now has its own unique URL. Easily share direct links with teammates or bookmark frequently visited pages. This also makes support far more efficient, allowing you to send or receive an exact link to the relevant page.
Revamped Members Section:
Search & Sort: Quickly find members and sort the list by role, name, or status.
Simplified Layout: We've decluttered the interface and improved the visual hierarchy for faster scanning.
Improved General Section:
Streamlined Design: Enjoy faster navigation and easier comprehension.
Industrial-Standard Danger Zone: A clear, well-marked area for critical actions like deletions, ensuring both safety and clarity when performing irreversible actions.
Revamped organization members settings page
Why This Matters
Managing your organization's settings should be effortless. These changes bring tangible benefits:
Faster Collaboration: Deep links let you guide teammates straight to the right settings without manual navigation.
Increased Clarity: Better organization and reduced clutter mean less mental effort to make changes.
Enhanced Safety: The new Danger Zone follows industry best practices to help prevent mistakes.
Get complete visibility into your AWS workloads with automatic span collection from fully managed services like API Gateway, Lambda, SNS, SQS and many more. No code changes required—just enable the integration and see the full journey your requests take through AWS infrastructure.
Traditional OpenTelemetry instrumentation captures only what happens inside your code, while AWS X-Ray also records what happens after the call reaches AWS services.
Our CloudWatch Transaction Search integration bridges that gap by stitching the spans together so you get one seamless, end-to-end trace of every request, from the very first hop to the final response. It works by streaming every X-Ray span into an aws/spans log group as JSON, which we then make OpenTelemetry compliant in our ingestion pipeline.
That is, you keep the full X-Ray data while paying CloudWatch-Logs prices and nothing extra for X-Ray storage.
Automatic AWS Service Span Collection: Seamlessly captures tracing data from API Gateway, Lambda service, SNS/SQS messaging, as well all other AWS services emitting X-Ray data, and correlates it with your existing OpenTelemetry or X-Ray traces.
True End-to-End Latency: See the complete user experience from first AWS service interaction to final response, not just application execution time.
Zero-Code Integration: Works with your existing setup—no application changes required.
CloudWatch Transaction Search integration is now available in public beta. Experience complete AWS observability while we continue refining the feature based on your feedback.
We now allow users to share custom views across the organization.
Building on our recently launched custom views feature, we're excited to introduce view sharing capabilities that enable seamless collaboration across your team.
New granular permissions let you share views with view-only or edit permissions across different user roles. Simple sharing UI, clear permission overviews, and collaborative workflows for debugging, monitoring, and standardizing observability across teams.
We're introducing the hosted Dash0 MCP (Model Context Protocol) Server, designed to facilitate advanced interactions with your observability data.
While MCP servers are becoming increasingly common for allowing LLMs to interface with different environments, our latest release focuses on enabling any AI agent to seamlessly interact with OpenTelemetry data, mirroring the intuitive experience that human users have within our UI.
Resource-Centric SRE Automation: Agents can navigate between services, see RED metrics for every operation, and identify the resources affected by failed checks.
Advanced PromQL Support: Build and execute PromQL queries directly through the MCP Server, unlocking the full power of Prometheus Query Language for real-time analysis of metrics, logs and tracing data.
Unified Data Interaction: Experience a consistent way for AI agents to engage with all types of observability data, using the same tools that human users do -- Triage, Query Builder, Service Catalog and much more.
Check our Integrations Hub for instructions on how to connect different AI assistants to Dash0!
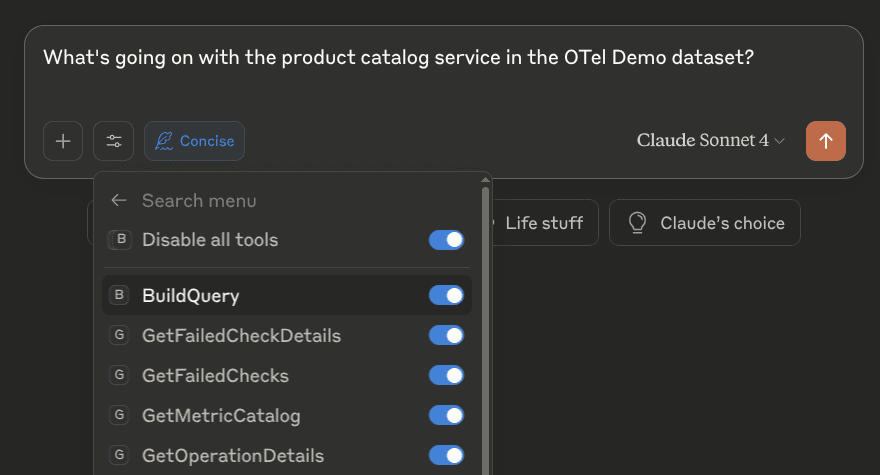
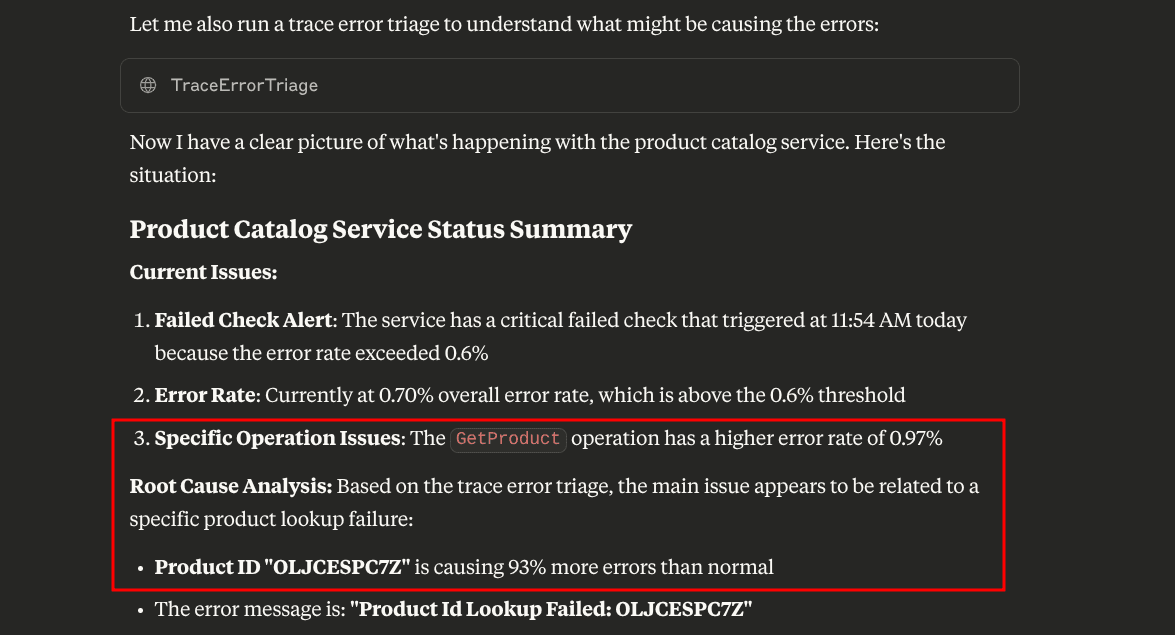
The images show an example where Claude is able to identify the root cause of an incident in the OpenTelemetry Demo dataset by employing tools from the Dash0 MCP server.
Dashboard filter variables now support dependency relationships, enabling powerful hierarchical filtering workflows.
New Feature: Filter Variable Dependencies
Dashboard filter variables now support dependency relationships, enabling powerful hierarchical filtering workflows. Create intuitive drill-down experiences where variables automatically filter based on selections from parent variables.
Key Improvements:
Dependency Chains: Configure filter variables to depend on other variables (e.g., Region → Service → Environment)
Automatic Filtering: Child variables dynamically show only relevant options based on parent selections
Smart Defaults: New filter variables automatically inherit dependencies from existing variables
Enhanced User Experience: Progressive filtering provides more intuitive dashboard interactions
What's New:
Configuration settings for filter variables
Automatic dependency selection when creating new filter variables
Improved handling of empty filter states with intelligent operator adjustments
Support for complex multi-level filtering scenarios
This enhancement makes dashboard filtering more powerful and user-friendly, allowing you to build sophisticated observability views that guide users through their data exploration journey.
We’re excited to announce that Dash0 is now available in the AWS Marketplace!
This launch makes it easier than ever for AWS customers to get started with Dash0. With just a few clicks, you can create a Dash0 organization and begin leveraging its powerful capabilities, reusing your existing billing setup on AWS!
Key Benefits:
Seamless Integration: Instantly create your Dash0 organization directly from the AWS Marketplace and hit the ground running.
Simplified Billing: Enjoy the convenience of consolidated billing through AWS—no additional invoices or account management headaches. No credit card required!
Visit Dash0's listing on the AWS Marketplace to get started today and enjoy the best OpenTelemetry-native observability!
By the way: did you know that sending your logs and metrics through the AWS Firehose to Dash0 is just a matter of few clicks?
We've enhanced our tooltips to make data exploration more powerful and intuitive. You can now hold down the Option/Alt key (⌥) when viewing certain tooltips with a lot of data (charting e.g.) to make it "sticky" - allowing you to move your mouse freely inside the tooltip to interact with its content.
Sticky Tooltips with Alt Key: Press and hold the Option/Alt key while hovering over tooltips to freeze them in place.
Interactive Content: Once a tooltip is sticky, you can interact with its contents - perfect for exploring large datasets, reviewing span events, or analyzing correlated logs.
Scrollable Long Content: Sticky tooltips support scrolling, making it easy to navigate through extensive information.
Visual Guidance: A helpful indicator shows when sticky mode is available and active.
We've also improved the Trace Explorer by automatically expanding attributes for selected span events and log records. Now when you click on a span event, the relevant attributes are immediately displayed, eliminating the need for additional clicks and making your debugging workflow faster and more efficient.Why This Matters for Real Users
Working with complex observability data brings unique challenges that our sticky tooltips directly address:
Eliminate the "hover dance": No more trying to keep your cursor perfectly still while reading lengthy error messages or studying detailed metrics.
Reduce cognitive load: Focus on understanding the data rather than fighting the UI to keep information visible.
Save valuable time: What used to require screenshots or note-taking can now be accomplished with a simple key press.
Improve debugging accuracy: Inspect and compare detailed trace data without losing context when your cursor moves.
Prevent frustration: When investigating critical issues, the last thing you need is disappearing information as you try to interact with it.
Dash0 now supports automatic parsing and enrichment of NGINX access logs—no regex, no pipeline tweaks, built-in for everyone.
We’re excited to introduce our new NGINX log processor. Whether you're running NGINX in a standard deployment or using it as a Kubernetes Ingress Controller, Dash0 now handles it all. We automatically detect the format, extract structured data, and enrich it with semantic attributes that follow OpenTelemetry conventions—making it easier than ever to monitor and understand what’s happening in your services.
This feature is now live for all Dash0 users. Just forward your NGINX access logs to us—no changes needed on your end. We’ll handle the parsing, structuring, and enrichment automatically.