Last updated: July 14, 2026
Analyze Web Events
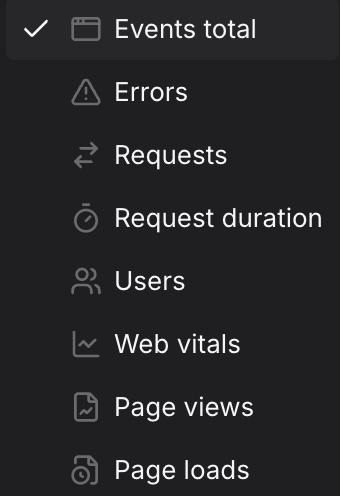
The Web Events tab in the Query Builder provides a curated interface for browser telemetry derived from Dash0's real user monitoring instrumentation.
Use it to track request volumes, error rates, user counts, page performance, and Core Web Vitals — all from a single focused view without writing PromQL.
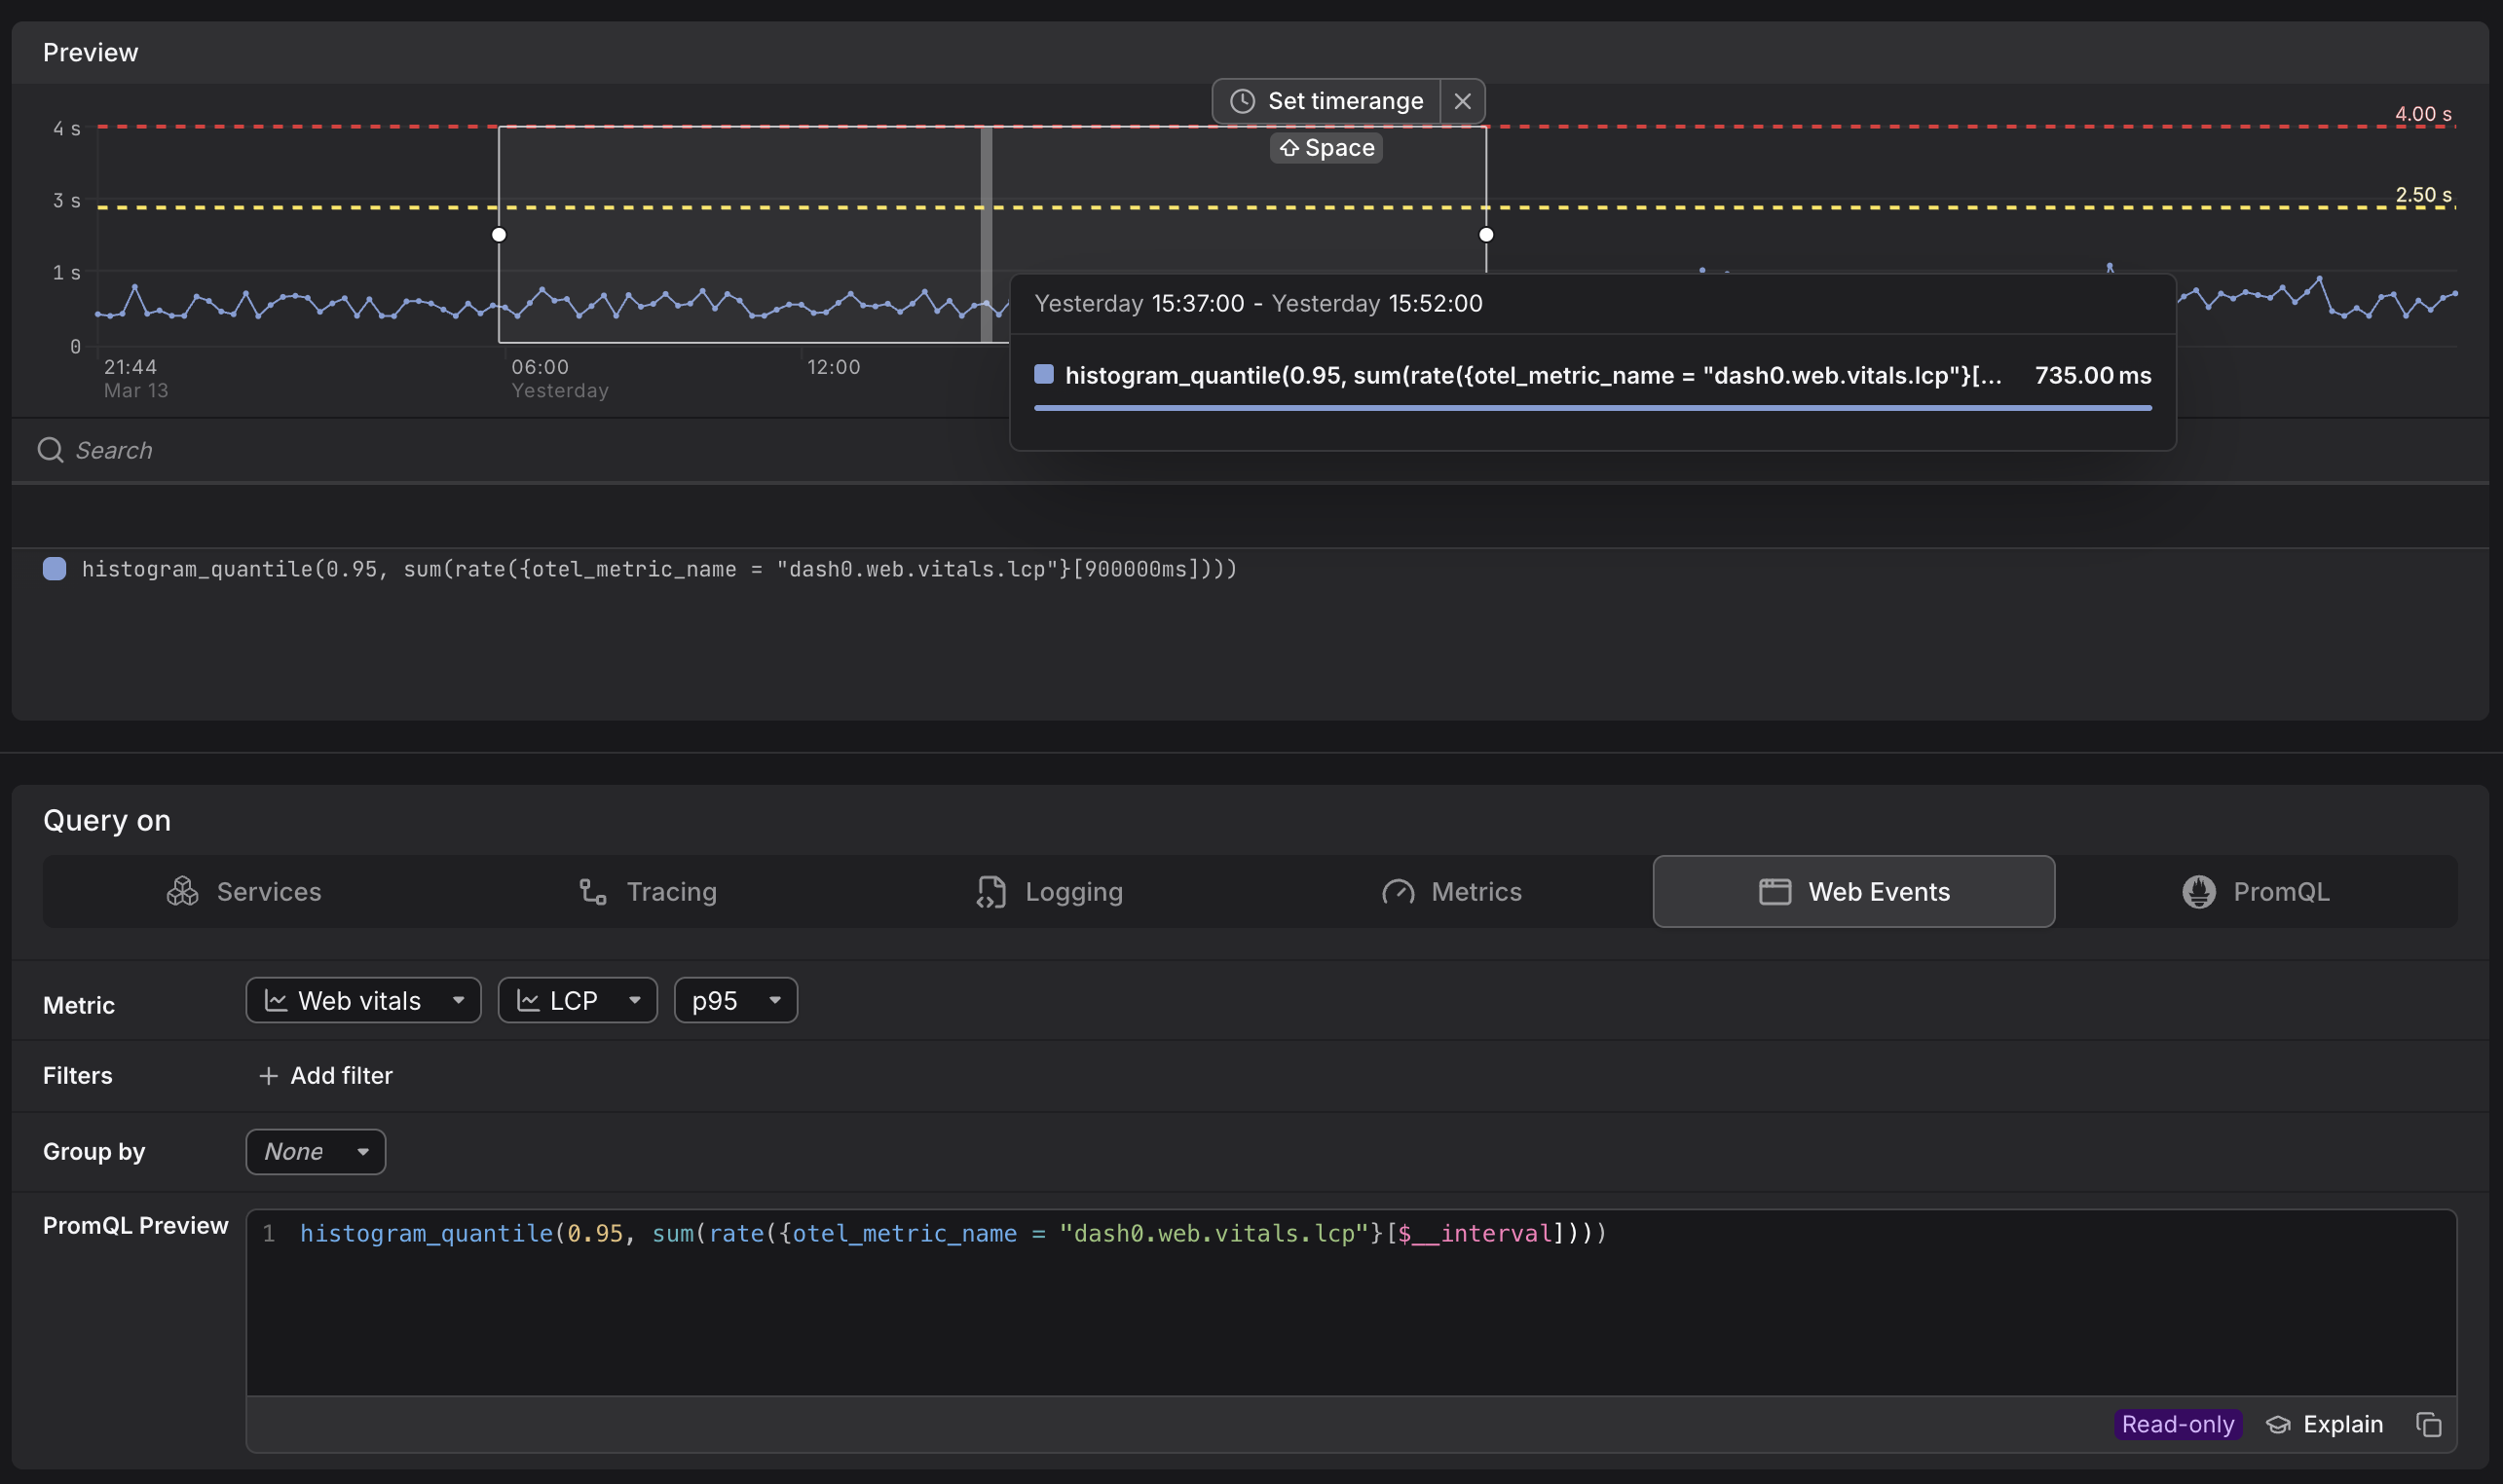
Dash0 automatically generates a set of built-in synthetic metrics from your telemetry. These appear alongside your own custom metrics in the Query Builder, as can be seen above. For example:
dash0.web.events— total count of all browser-side events captured (web vitals, errors, navigations, custom interactions).dash0.web.errors— count of client-side JavaScript errors and failed operations captured in the browser.dash0.web.requests— total number of outbound HTTP requests initiated from the browser (XHR, Fetch, etc.).dash0.web.requests.duration— latency of outbound browser requests in milliseconds, from initiation to response.dash0.web.users— count of unique users observed within the telemetry window, derived from browser identifiers.dash0.web.vitals.lcp— Largest Contentful Paint: time in milliseconds until the largest visible element is fully rendered; measures perceived load speed.dash0.web.vitals.inp— Interaction to Next Paint: latency from a user interaction (click, keypress) to the next visible paint; measures responsiveness.dash0.web.vitals.cls— Cumulative Layout Shift: score representing total unexpected layout movement during page load; measures visual stability.dash0.web.page_views— number of distinct page views recorded across all sessions.dash0.web.sessions— total number of user sessions.dash0.web.sessions.duration— duration of user sessions in milliseconds, from first event to last.dash0.web.bounces— count of sessions where the user left without any further interaction after the initial page load.
These metrics are also accessible directly in the Metrics and PromQL tabs, giving you the flexibility to combine them with your own metrics or apply custom aggregations.
Select the Metric
Use the Metric dropdown to choose what you want to measure.
Core Web Vitals are a set of metrics defined by Google that quantify real-user page experience. Dash0 uses the same thresholds as Google when color-coding scores.
| Vital | What it measures |
|---|---|
| LCP — Largest Contentful Paint | How long it takes for the largest visible content element — typically a hero image or large text block — to fully render in the viewport after the page starts loading. |
| INP — Interaction to Next Paint | The latency of the worst user interaction (click, tap, or keyboard input) across the entire page lifecycle. Replaced First Input Delay (FID) as a Core Web Vital in March 2024. |
| CLS — Cumulative Layout Shift | The total amount of unexpected layout movement that occurs during the page lifecycle — for example, content jumping when images load without reserved dimensions or ads inject above existing content. |
For threshold values and guidance on improving scores, see Web Vitals on web.dev.
Add Filters
Use + Add filter to scope the query to web events that match specific attribute values. Multiple filters are combined with AND logic.
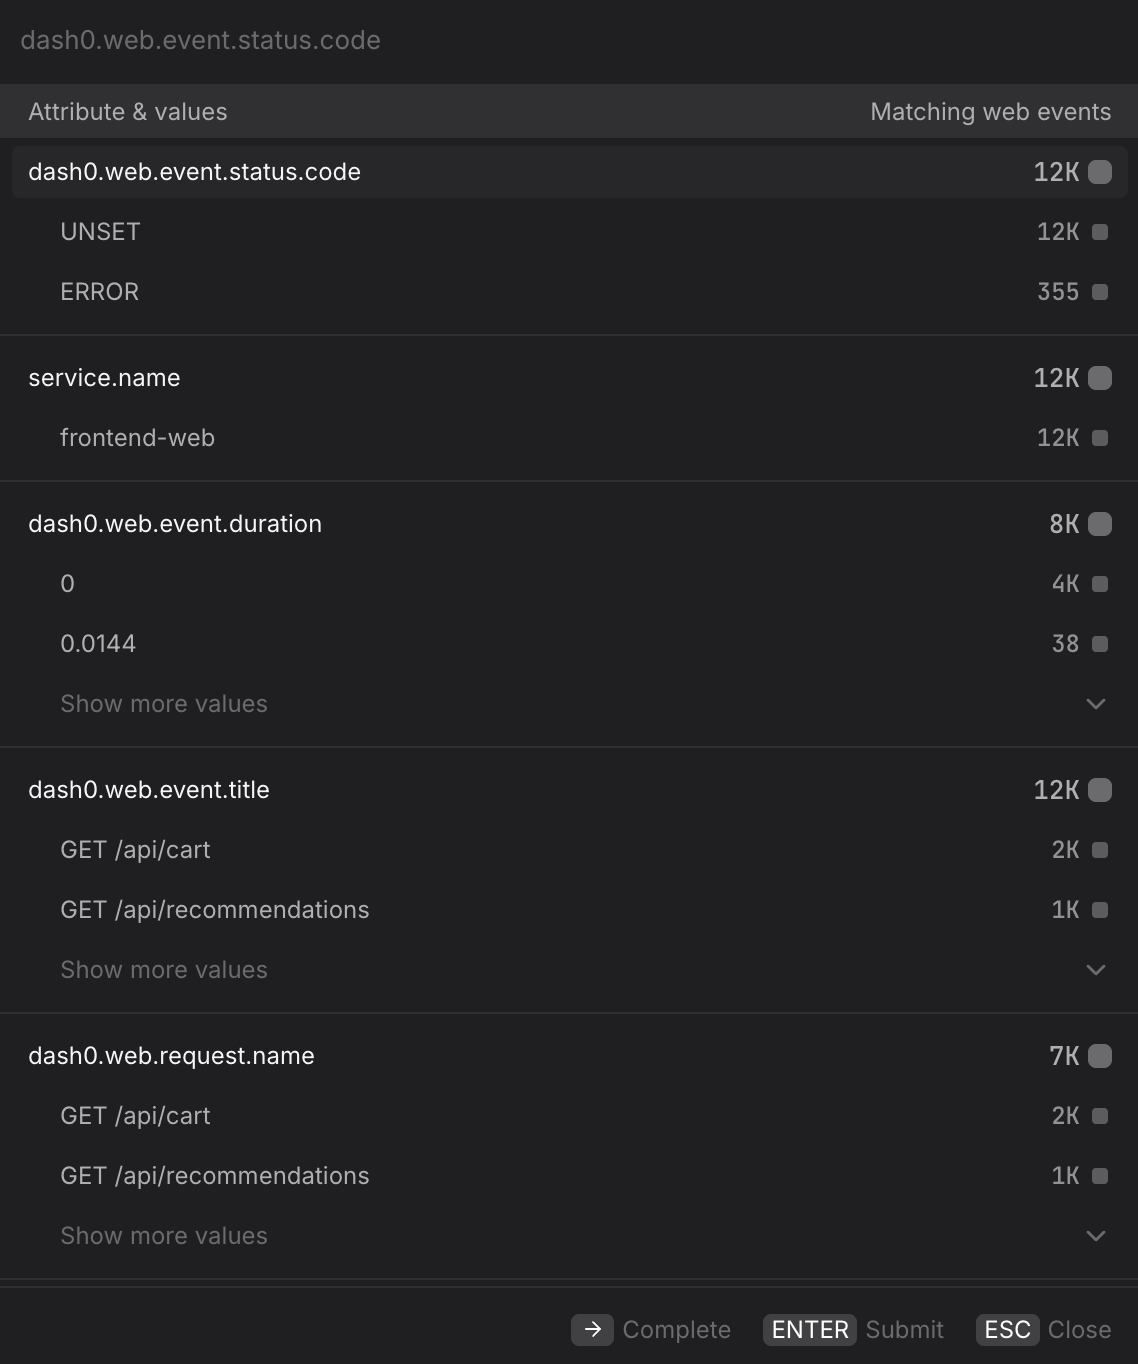
- Focus on error events only. Filter by
dash0.web.event.status.code=ERRORalongside the Events total metric to isolate events that completed with an error status. UseUNSETto see events where no explicit status was recorded. - Scope to a single service. Filter by
service.name=frontend-webto restrict the query to browser telemetry from a specific frontend application — useful when multiple web properties report into the same environment. - Narrow to a specific request. Filter by
dash0.web.request.name=GET /api/cartto measure the volume or duration of a single browser-initiated request — useful when investigating a specific API call that is slow or error-prone for real users. - Focus on a specific page or route. Filter by
dash0.web.event.title=GET /api/recommendationsto scope the query to events associated with a particular page or endpoint, without switching to a Group by view. - Isolate a single environment. Filter by
deployment.environment.name=productionto exclude staging or canary traffic from your baseline — especially important before creating a check rule where test traffic could cause false-positive alerts. - Filter by HTTP response code. Filter by
http.response.status_code=500to isolate requests that received a server-side error response, separating backend failures from client-side errors.
Group By an Attribute
Use the Group by dropdown to split the time series by a web event attribute, producing one line per unique value of that attribute.
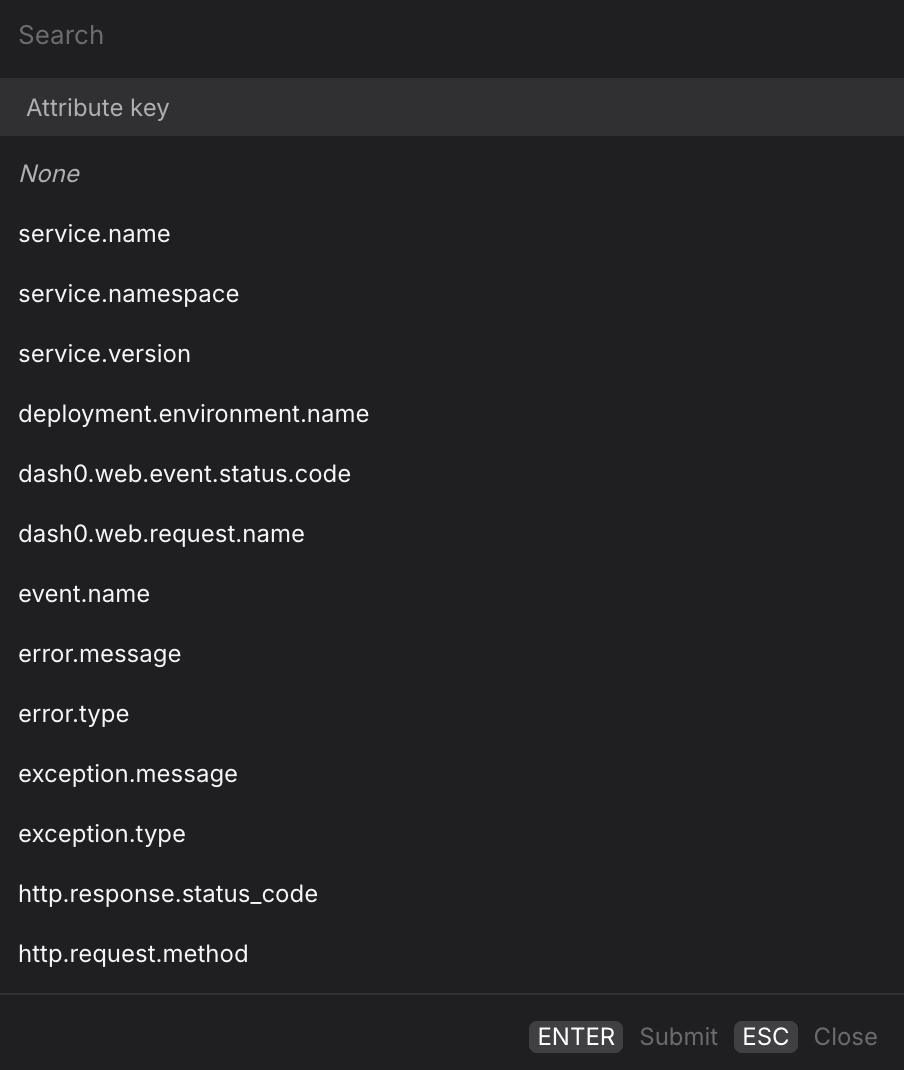
- Group by
dash0.web.request.nameto compare request volume or duration across all endpoints in a single chart — useful for identifying which API calls are the slowest or most error-prone for real users. - Group by
dash0.web.event.status.codealongside the Events total metric to visualize the split between successful and error events over time, and quickly detect when error events begin to grow. - Group by
service.namewhen multiple frontend applications report into the same environment, to compare their performance and error rates side by side. - Group by
http.request.methodto separateGETandPOSTrequest volumes — write operations often have very different latency profiles from reads and may warrant separate SLO thresholds. - Group by
error.typeorexception.typealongside the Errors metric to break down frontend error volume by error class — useful for prioritising which error types to investigate first. - For multi-dimension breakdowns, switch to the PromQL tab. Your current Web Events query is carried over and you can extend the
byclause manually — for example, to split by bothservice.nameanddash0.web.event.status.codesimultaneously.
Create Dashboards and Check Rules from the Query
Once you have the view you want, use the buttons at the top of the Query Builder, above the preview chart.
![]()
- Click Add to dashboard to add the current query as a panel to a new or existing dashboard.
- Click Create check rule to open the check rule editor with this query pre-filled as the rule expression.