Last updated: July 14, 2026
Analyze Service Performance
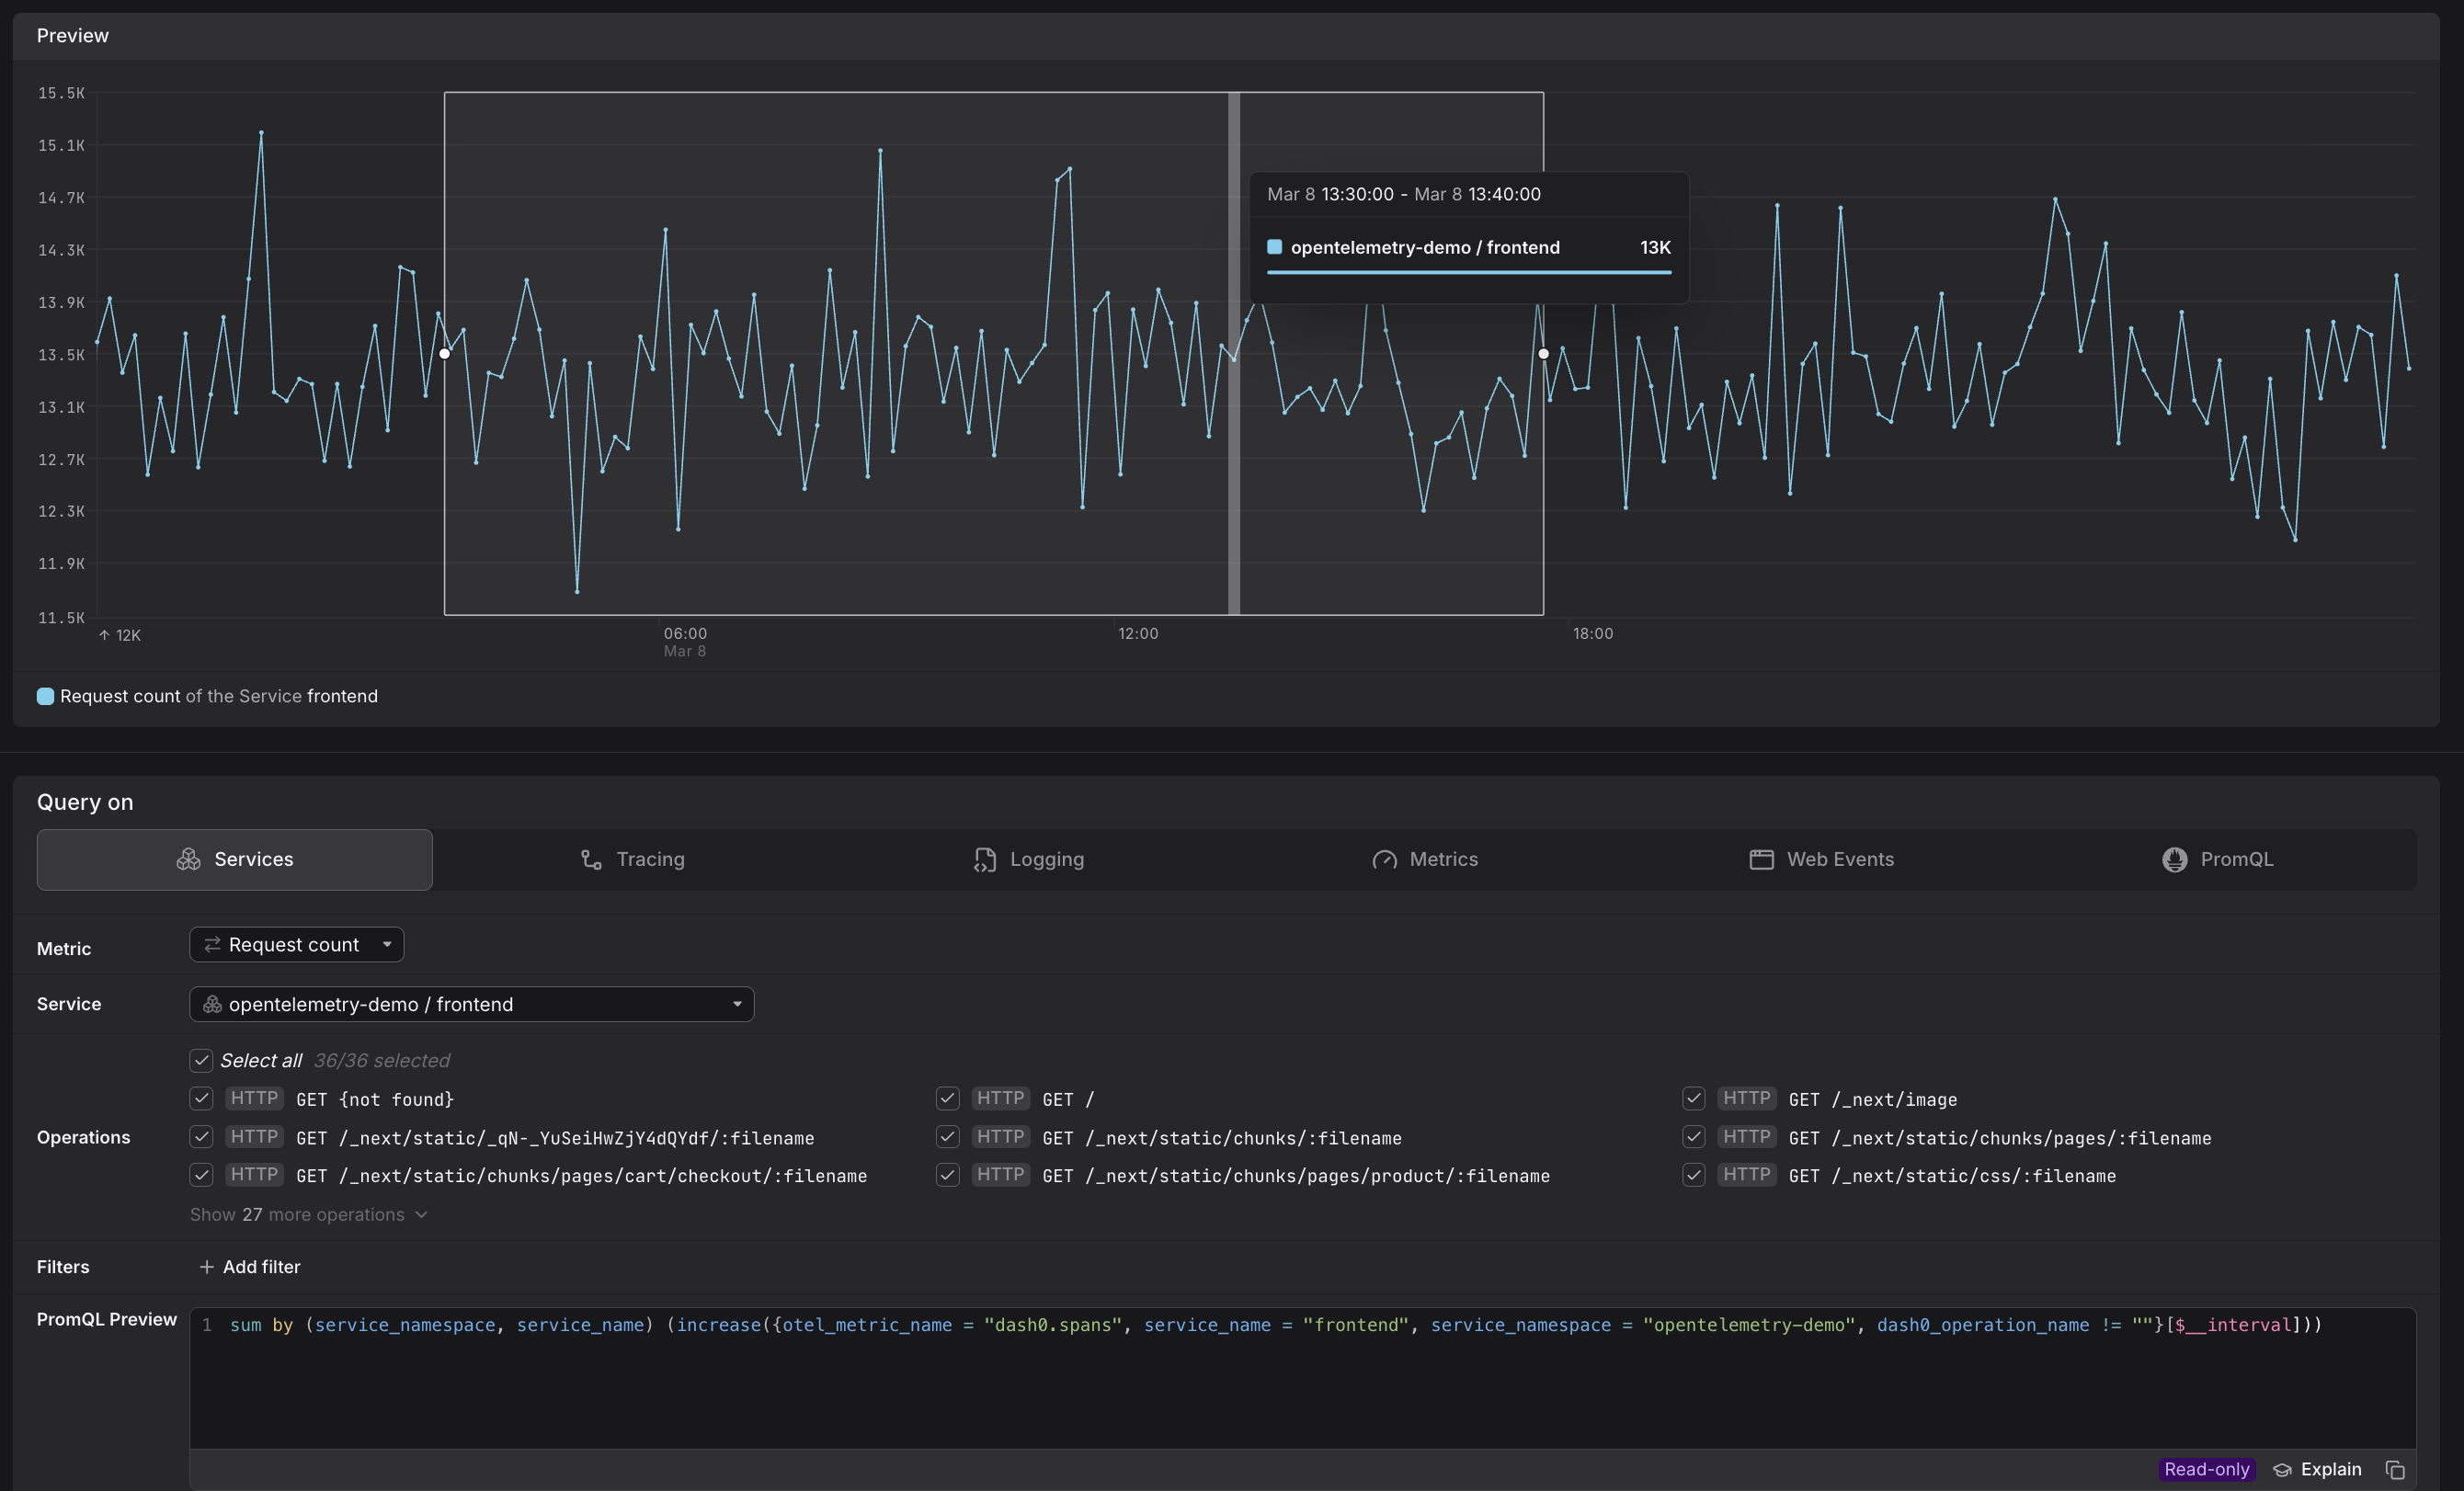
The Services tab in the Query Builder allows you to investigate the behavior, in terms of RED metrics, of the services.
Use it to quickly investigate latency, request count, or error rate for a specific service and narrow the data down to the operations that matter.
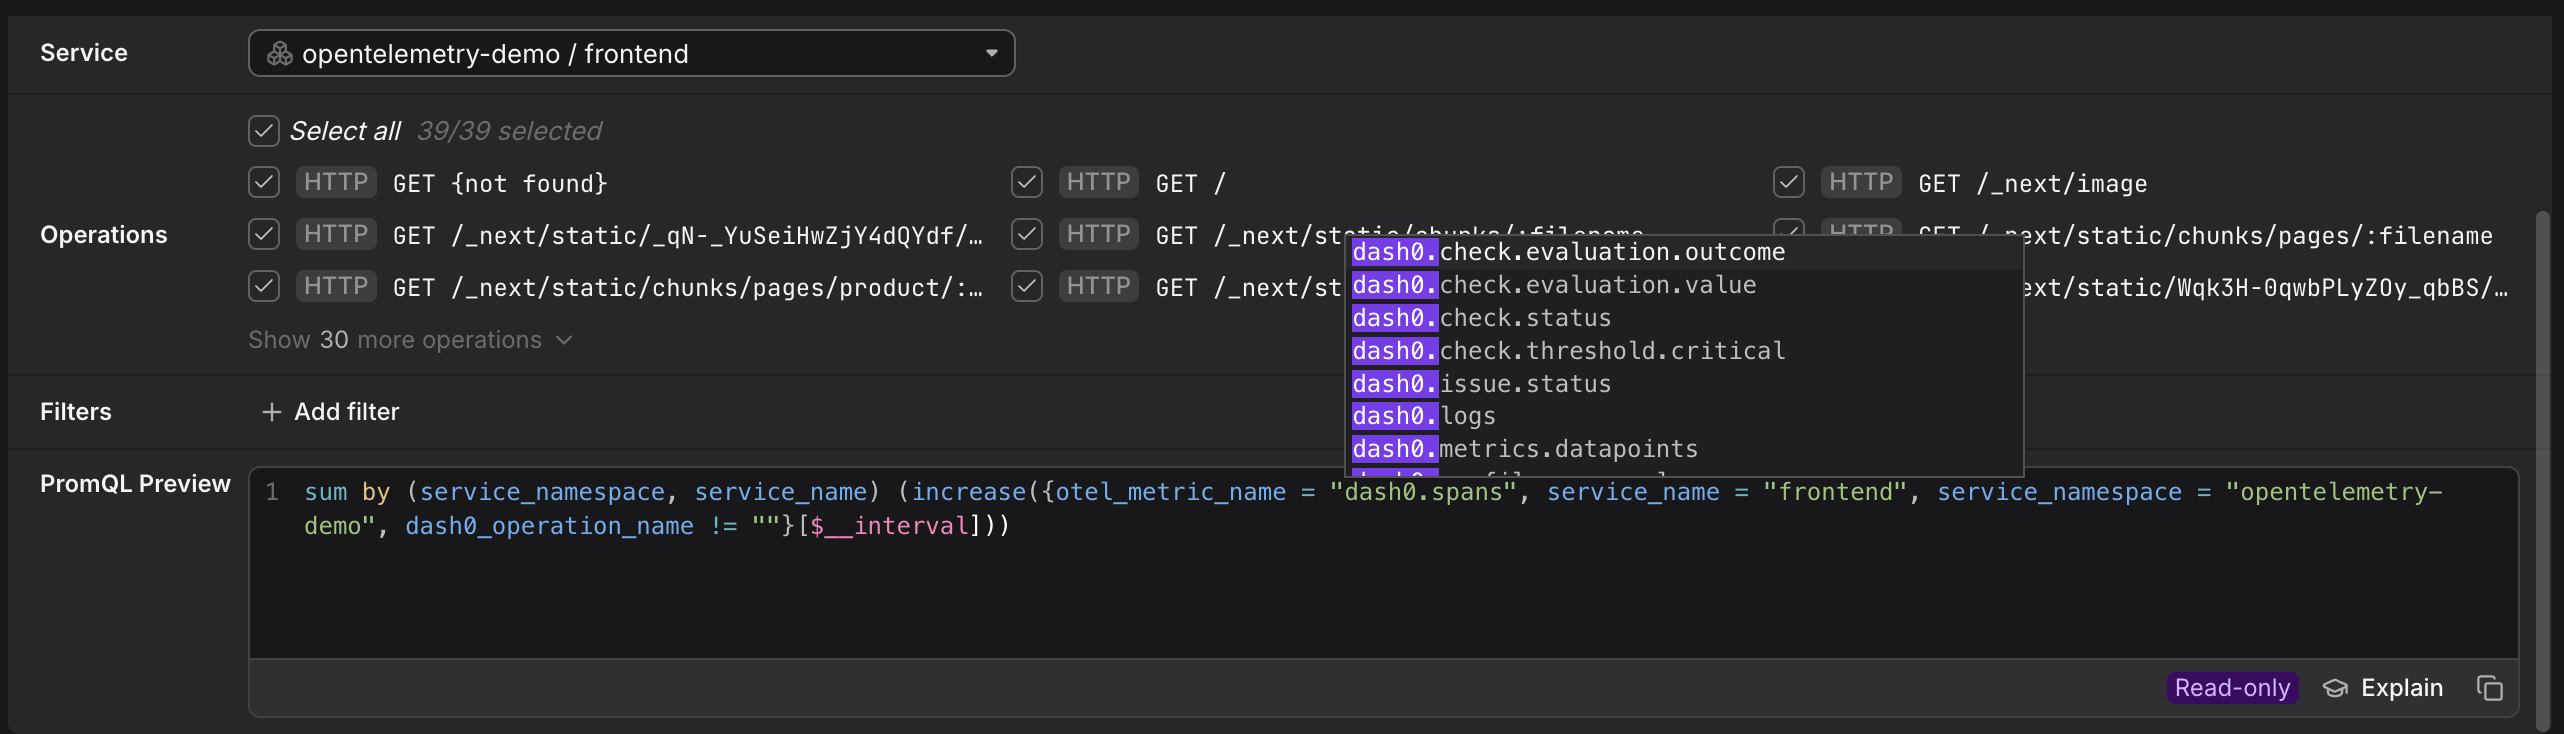
Dash0 automatically generates a set of built-in synthetic metrics from your telemetry. These appear alongside your own custom metrics in the Query Builder, as can be seen above. For example:
dash0.spans— derived from span telemetry; used by the Services and Tracing tabs.dash0.spans.duration— the duration histogram of all spans; powers latency queries in Services and Tracing.
These metrics are also accessible directly in the Metrics and PromQL tabs, giving you the flexibility to combine them with your own metrics or apply custom aggregations.
Select the Metric
Use the Metric dropdown to choose what you want to measure.
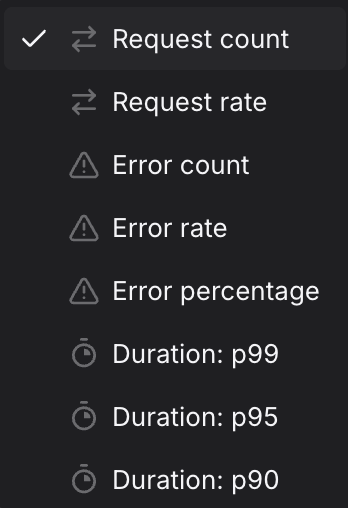
The preview chart updates immediately and the PromQL Preview shows the generated query, including any filters and aggregations applied.
Filter by Service
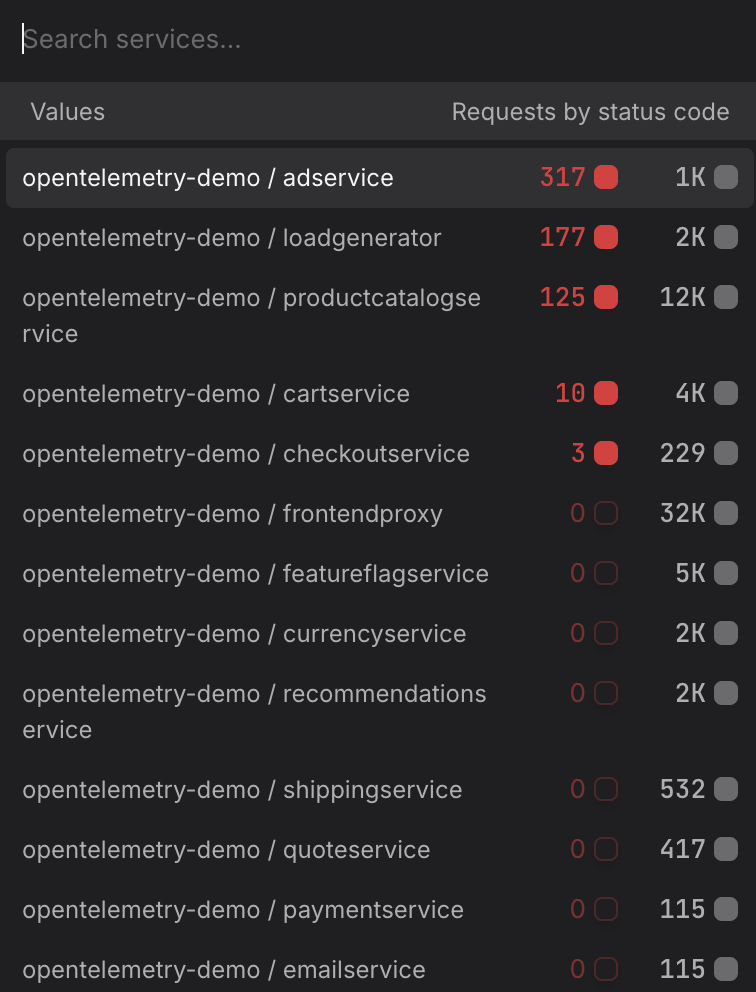
Use the Service dropdown to select the service you want to investigate.
- Start at the edge, work inward. If you are investigating a user-reported slowdown, start with your outermost public-facing service — for example
frontendorapi-gateway— to confirm whether latency is concentrated there or whether it is being passed down from a dependency. Then move to upstream callers likecheckoutorpaymentto trace where the time is actually being spent. - Investigate a downstream dependency directly. If a call-graph or trace already points to a slow dependency — for example a
recommendationorproduct-catalogservice — select that service directly rather than the caller. Measuring the dependency in isolation tells you whether the problem is in the service itself or in how it is being called. - Compare services side by side. To compare two services — for example
order-serviceandpayment-service— build a query for each and add both to the same dashboard panel. Seeing their P95 latency on the same chart makes it easier to spot which service started degrading first after a deployment.
For more information, see Filtering.
Filter by Operation
Once a service is selected, the Operations list appears below the service picker, listing the related operations.
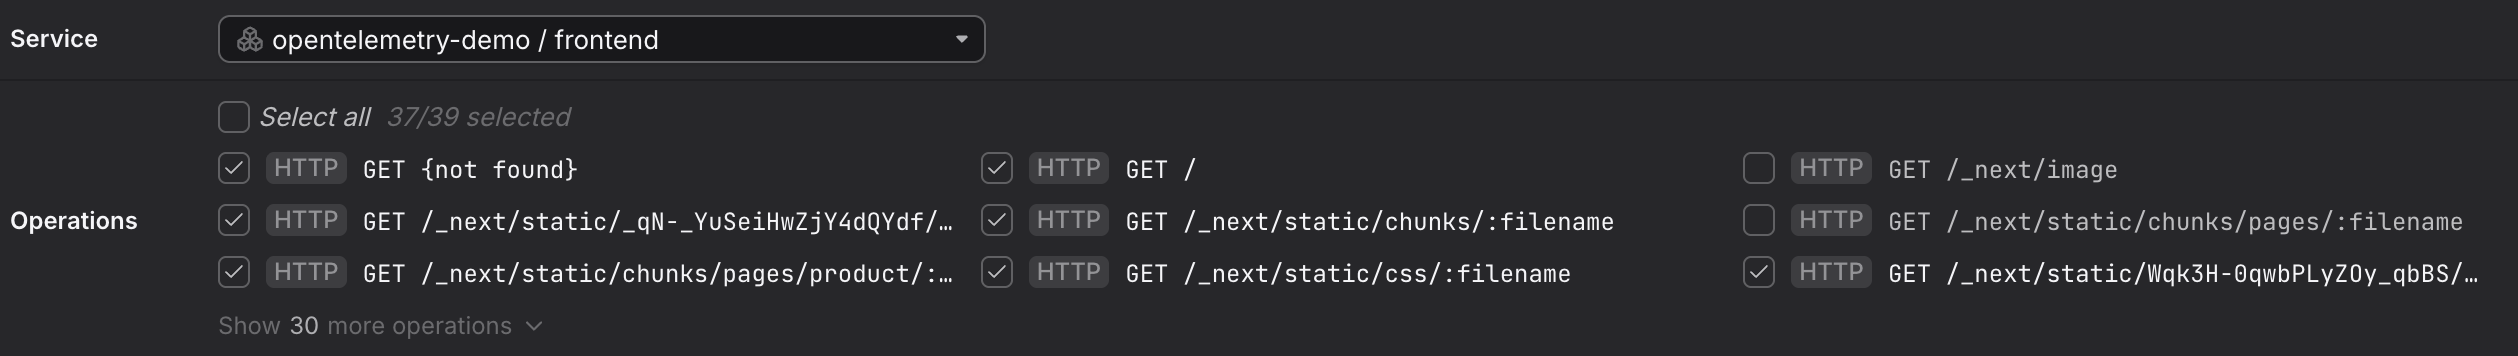
It shows every operation (endpoint) that the selected service has reported spans for.
- All operations are selected by default.
- Uncheck individual operations to exclude them from the query — for example, to remove a health-check endpoint like
/pingthat would otherwise skew your latency data. (More tips below.) - Use Select all to reset to the full set.
- Remove health-check and liveness probe endpoints. Kubernetes liveness and readiness probes generate a continuous high-frequency stream of fast, successful spans. Endpoints like
/healthz,/readyz,/livez, or/pingwill pull your P90 and P95 values down and make real user latency appear better than it is. Uncheck these before adding a query to a dashboard or check rule. - Isolate write operations from reads. Services that handle both reads and writes often show a bimodal latency distribution —
GEToperations are typically fast whilePOSTorPUToperations that write to a database are slower. Uncheck read operations likeGET /productswhen you want a clean view of write latency, and vice versa. - Focus on a single high-value endpoint. If you are building a check rule for a specific SLO — for example a 300 ms P95 target for your checkout flow — uncheck everything except the operation that represents that flow, such as
POST /checkout. Including unrelated operations in the same rule makes it harder to attribute a breach to its root cause. - Use Select all to reset after exploring. If you have been unchecking operations to explore different slices of the data, click Select all before promoting the query to a dashboard to make sure you are not accidentally omitting operations that belong in the final view.
Filter by Attributes
To narrow the data further, click + Add filter and specify the attribute and value you want to match. Multiple filters are combined with AND logic.
- Isolate a single environment. Filter by
deployment.environment=productionto exclude staging or canary traffic from your baseline. This is especially important before creating a check rule, where staging noise can cause false-positive alerts. - Scope to a specific cluster. If the same service runs across multiple Kubernetes clusters, filter by
k8s.cluster.name=prod-eu-west-1to compare clusters individually and rule out region-specific issues. - Focus on error spans only. Filter by
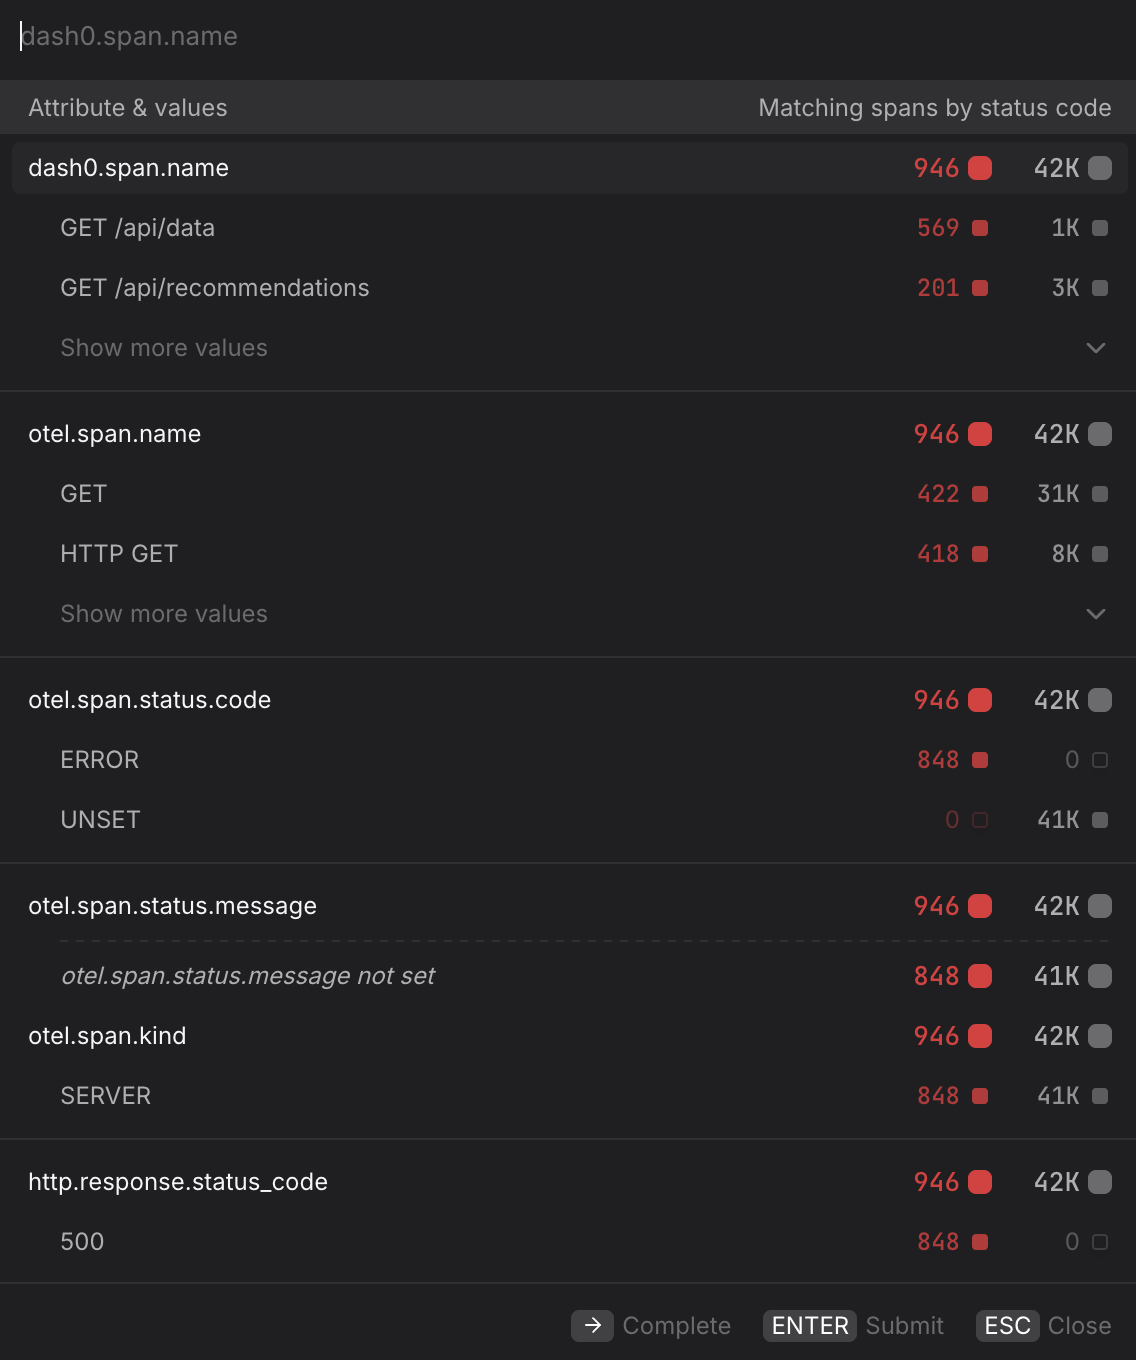
otel.span.status.code=ERRORalongside the Error rate metric to isolate spans that completed with an error status. UseUNSETto see spans where no explicit status was set — these are neither successes nor failures and can indicate incomplete instrumentation. - Filter by HTTP response code. Filter by
http.response.status_code=500to isolate server-side failures and separate them from client errors (400–499) that may not warrant an alert. - Narrow to a specific operation name. Filter by
dash0.span.name=GET /api/datato focus on a single endpoint without using the Operations list — useful when you want to combine an operation filter with other attribute filters in the same query. - Pin to a specific namespace. In multi-tenant clusters, filter by
k8s.namespace.name=acme-prodto ensure you are only seeing spans from the intended workload and not from services that share the same name in a different namespace.
Finetune the Query
Use Ctrl-Space in the PromQL Preview to see relevant ways of finetuning the prompt as needed.
A common workflow is to start with a visual tab to get the basic shape of a query, then switch to the PromQL tab to add complexity.
Create Dashboards and Check Rules from the Query
Once you have the view you want, use the buttons at the top of the Query Builder, above the preview chart.
![]()
- Click Add to dashboard to add the current query as a panel to a new or existing dashboard.
- Click Create check rule to open the check rule editor with this query pre-filled as the rule expression.