Last updated: July 14, 2026
Analyze All Metrics
The Metrics tab in the Query Builder gives you access to every metric available in your Dash0 environment.
Use it when you need full control over metric selection and aggregation, or when the focused tabs (Services, Tracing, Logging, Web Events) do not cover the metric you want to query.
Metric Types
Dash0 supports all standard OpenTelemetry metric types.
- Sum (Counter / UpDownCounter) — monotonically increasing or bidirectional cumulative values
- Gauge — current value at a point in time
- Histogram — distribution of values across configurable buckets
- ExponentialHistogram — like histogram but with dynamically sized buckets
- Summary (legacy) — client-side calculated quantiles, not produced by OTel SDKs but supported for backwards compatibility
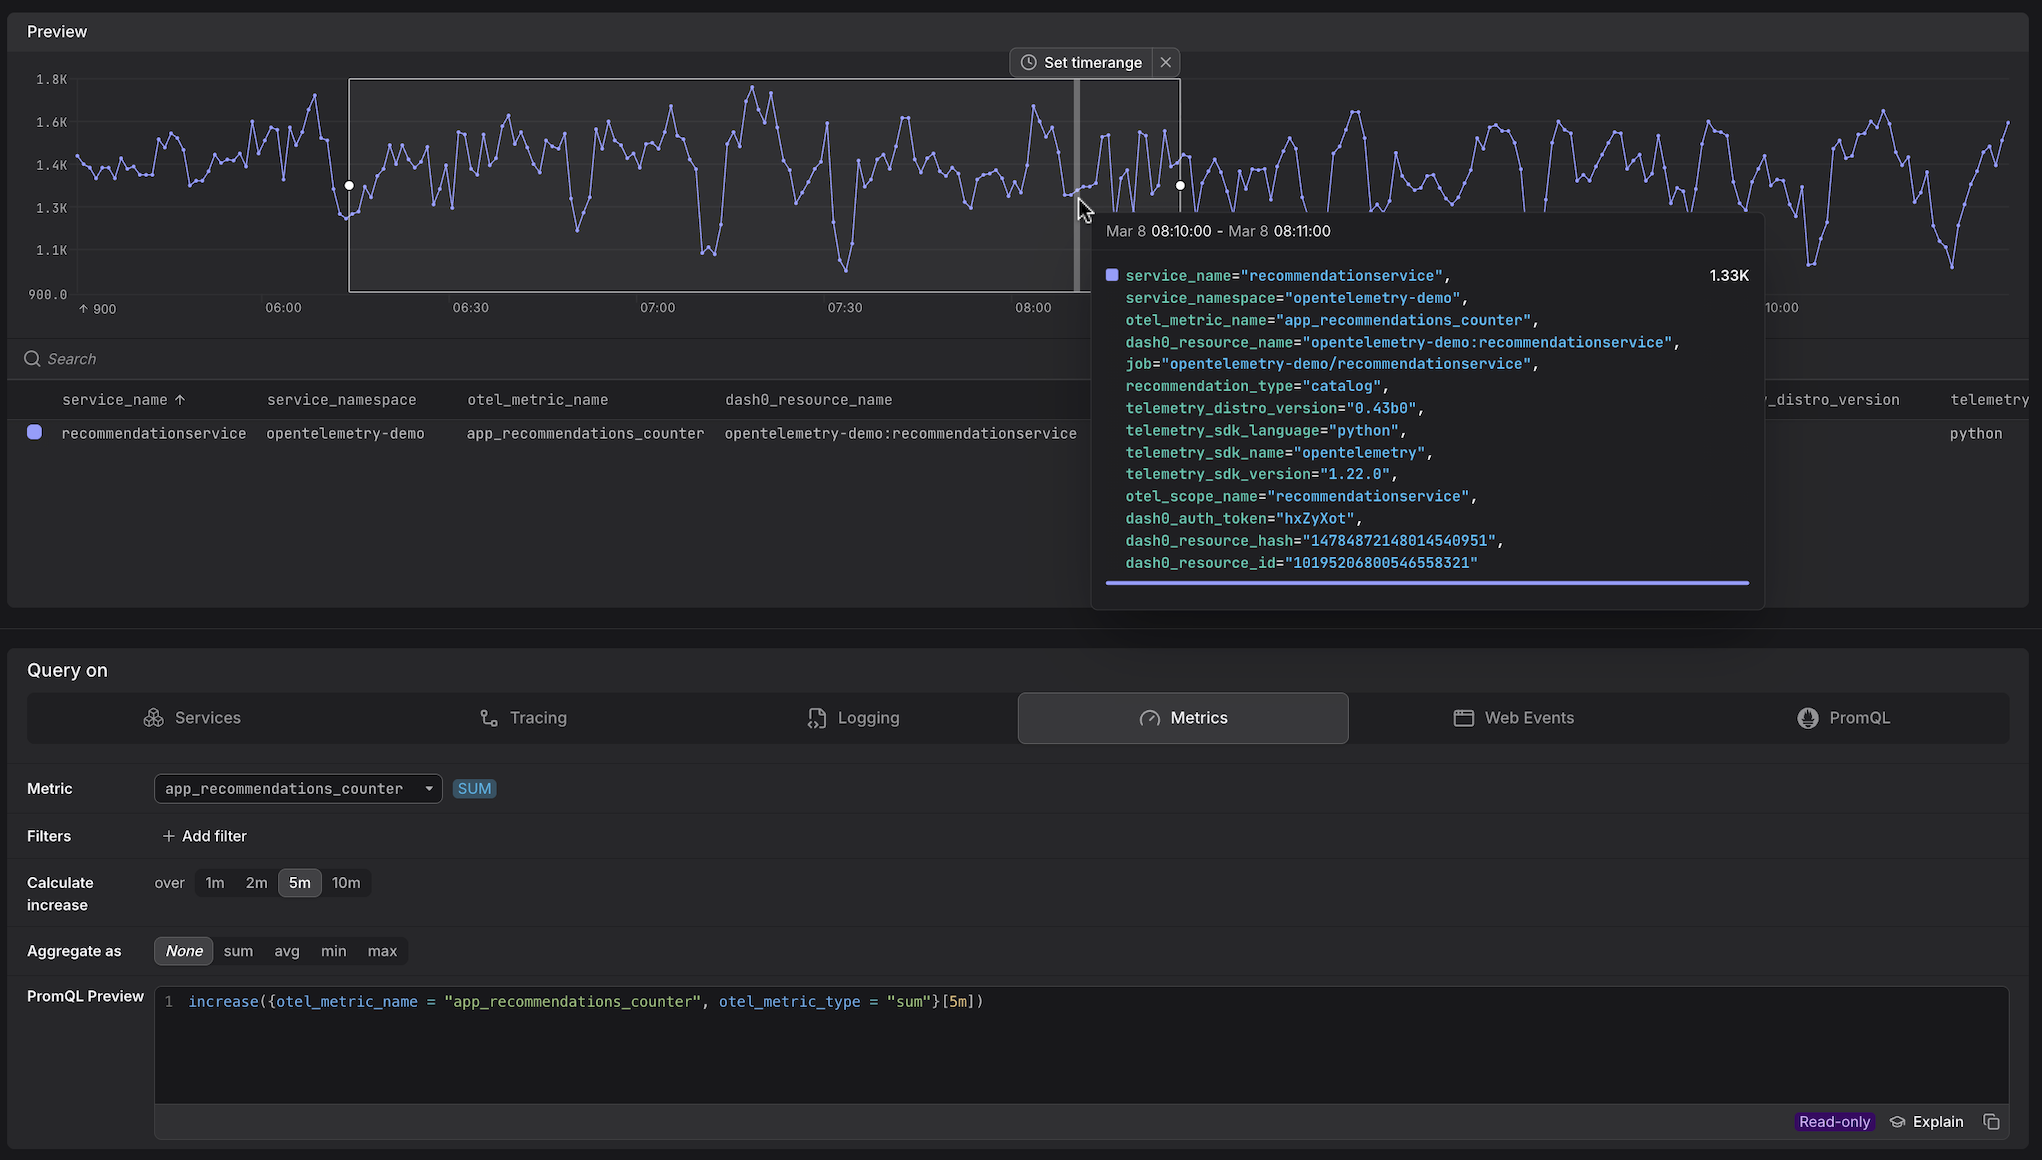
Select the Metric
Use the Metric dropdown to choose what you want to measure. Type to search by name. Each metric is labelled with its type — SUM, GAUGE, or HIST — which determines the PromQL pattern used.
The type badge shown next to each metric in the picker determines the PromQL pattern the Query Builder generates.
For more detail on how these types are represented in the wire format, see the OTLP Metric Data Model.
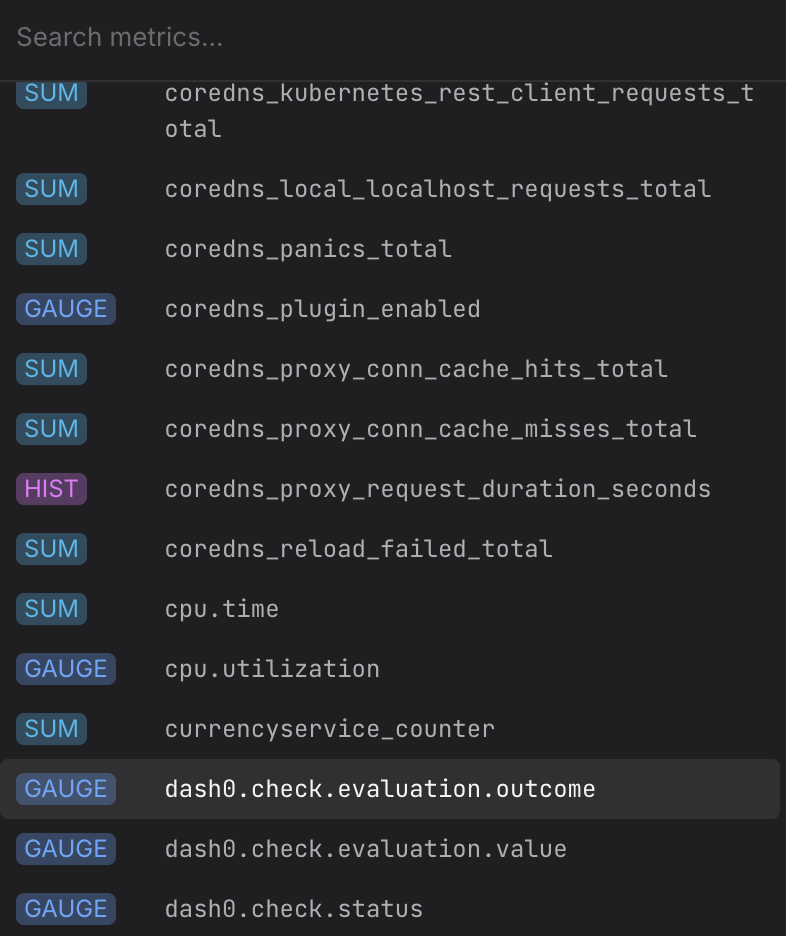
Your Metrics
These are the metrics your services, infrastructure components, and third-party integrations emit and store directly as time series.
They appear in the picker alongside their type badge and can be queried, filtered, and split like any other metric.
The cardinality and resolution of these metrics are determined by your instrumentation.
For example, depending on the custom metrics you make available, you'll see something like the below:
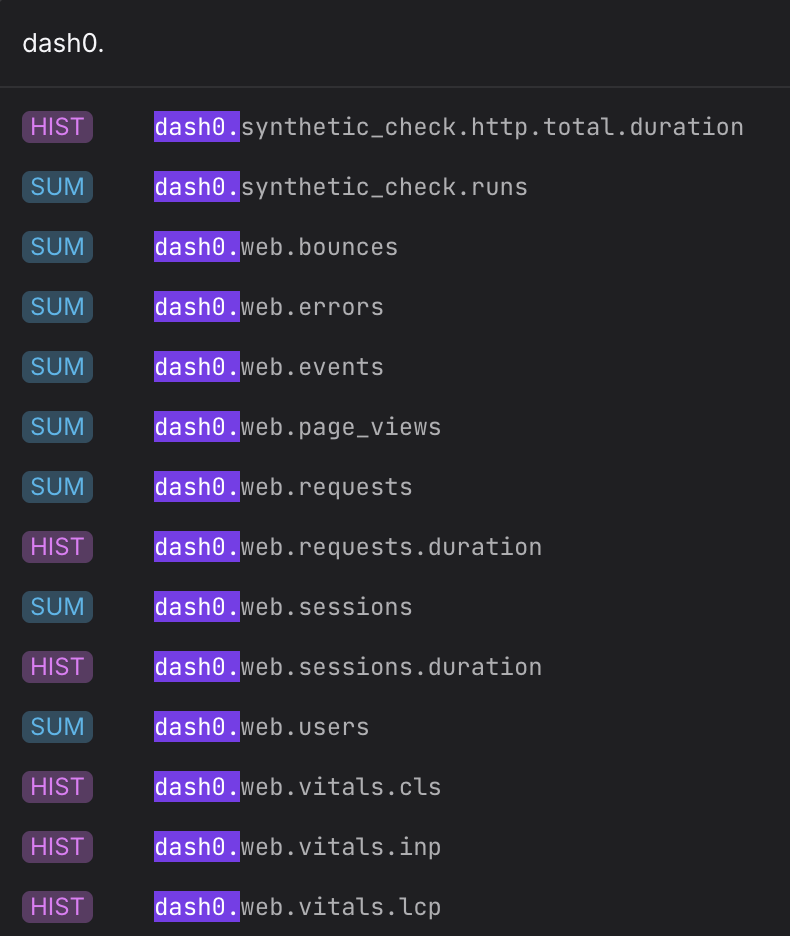
Dash0 Synthetic Metrics
Rather than storing pre-computed metric time series, Dash0 derives its own metrics to support your requirements on demand directly from the underlying raw telemetry — logs, spans, web events, and synthetic check results.
When you query a synthetic metric, Dash0 reads the raw records for the selected time range, aggregates them at a granularity appropriate to the query step size, and returns a time series on the fly.
Synthetic metrics are constrained by default to the resource level — that is, they are aggregated by dash0.resource.id out of the box. This prevents the very high cardinality of the underlying telemetry (potentially thousands of services, pods, and request paths) from making queries unusably large. See Configure the Aggregation below for how to expand to additional dimensions using Split by.
For example, here is a subset of Dash0 synthetic metrics:
Configure the Aggregation
Once a metric is selected, the Aggregate as controls let you reduce multiple time series into a single line.
- None — show all individual time series without aggregation. Useful when you have low cardinality and want to see each series separately.
- sum — add all series together into a single total. The most common choice for counter metrics.
- avg — average across all series. Useful for gauge metrics where you want the mean value across instances.
- min / max — return the lowest or highest value across all series. Useful for gauges where you want to surface the worst-case or best-case value across a fleet.
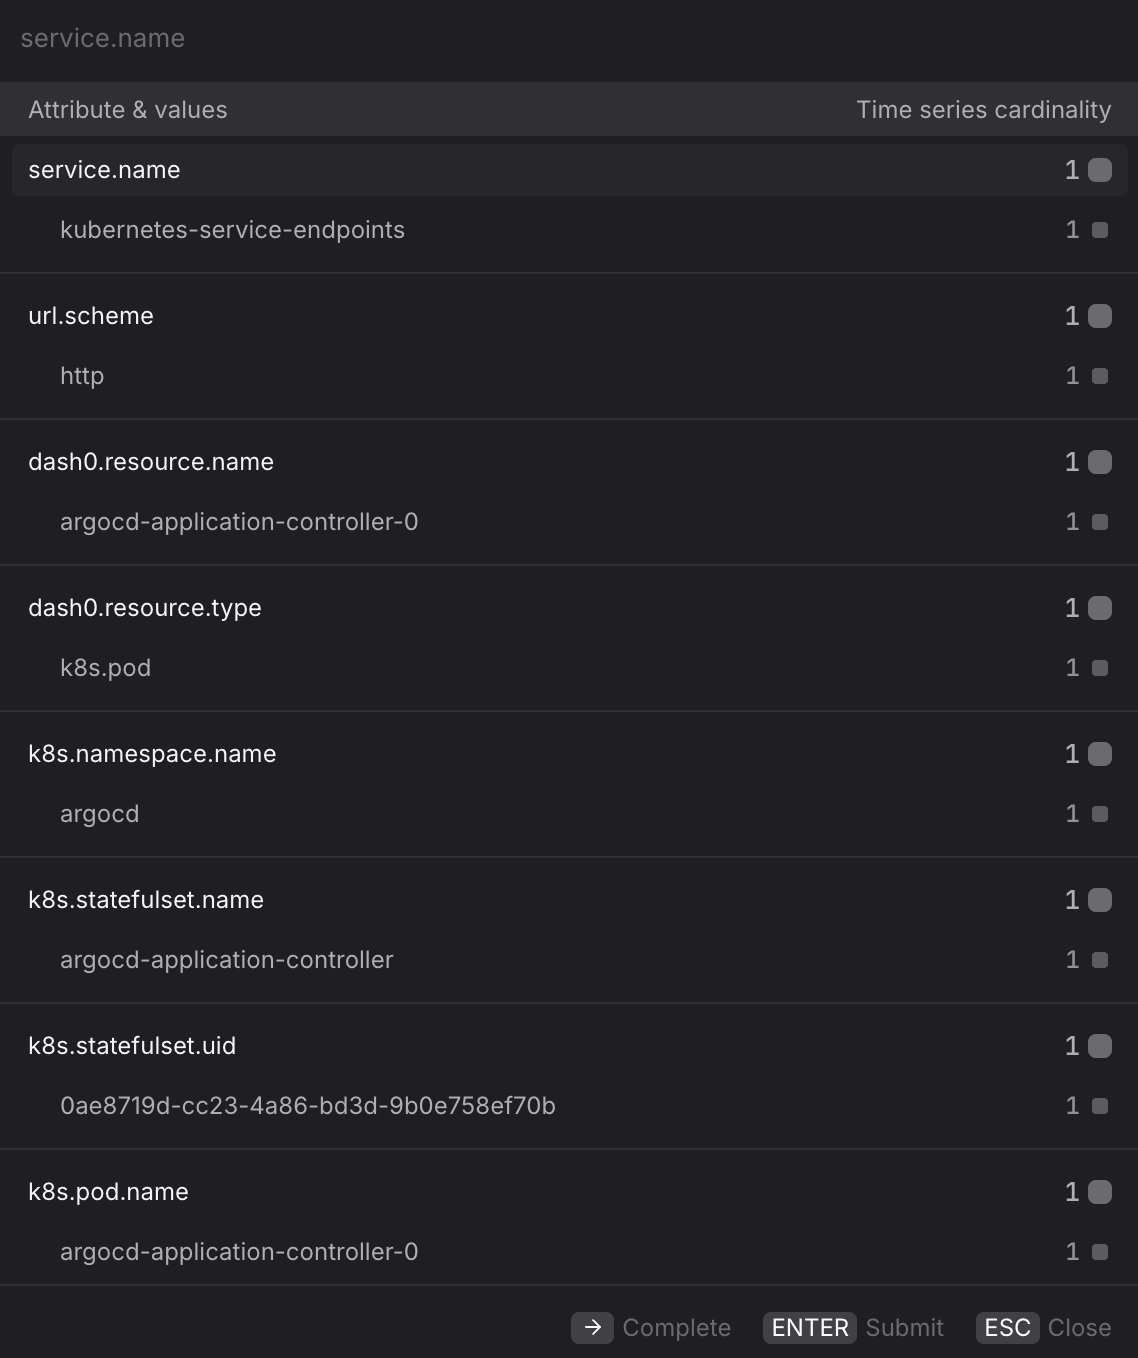
- Once you select an aggregation function, the Split by controls become available. For synthetic metrics, the Split by field is pre-populated with
dash0.resource.id— this is what produces the default resource-level breakdown. Keeping thedash0.resource.idattribute in the resulting time series ensures that Dash0 can correctly calculate the health of the respective resources. Click + Add split to add further dimensions alongsidedash0.resource.id, to add new dimensions to the chart. - Add a Filter before splitting to constrain which records feed into the aggregation — for example, filtering to a single
service.namebefore splitting byotel.log.severity.textkeeps cardinality manageable while still exposing the severity breakdown you need. - For synthetic metrics, each split attribute is reflected immediately in the PromQL Preview as a
by (...)clause. For example, selectingavgand splitting byservice.nameproducesavg by (service_name) (increase({otel_metric_name = "dash0.logs"}[2m])).
Add Filters
Use + Add filter to scope the query to a subset of your data. Multiple filters are combined with AND logic.
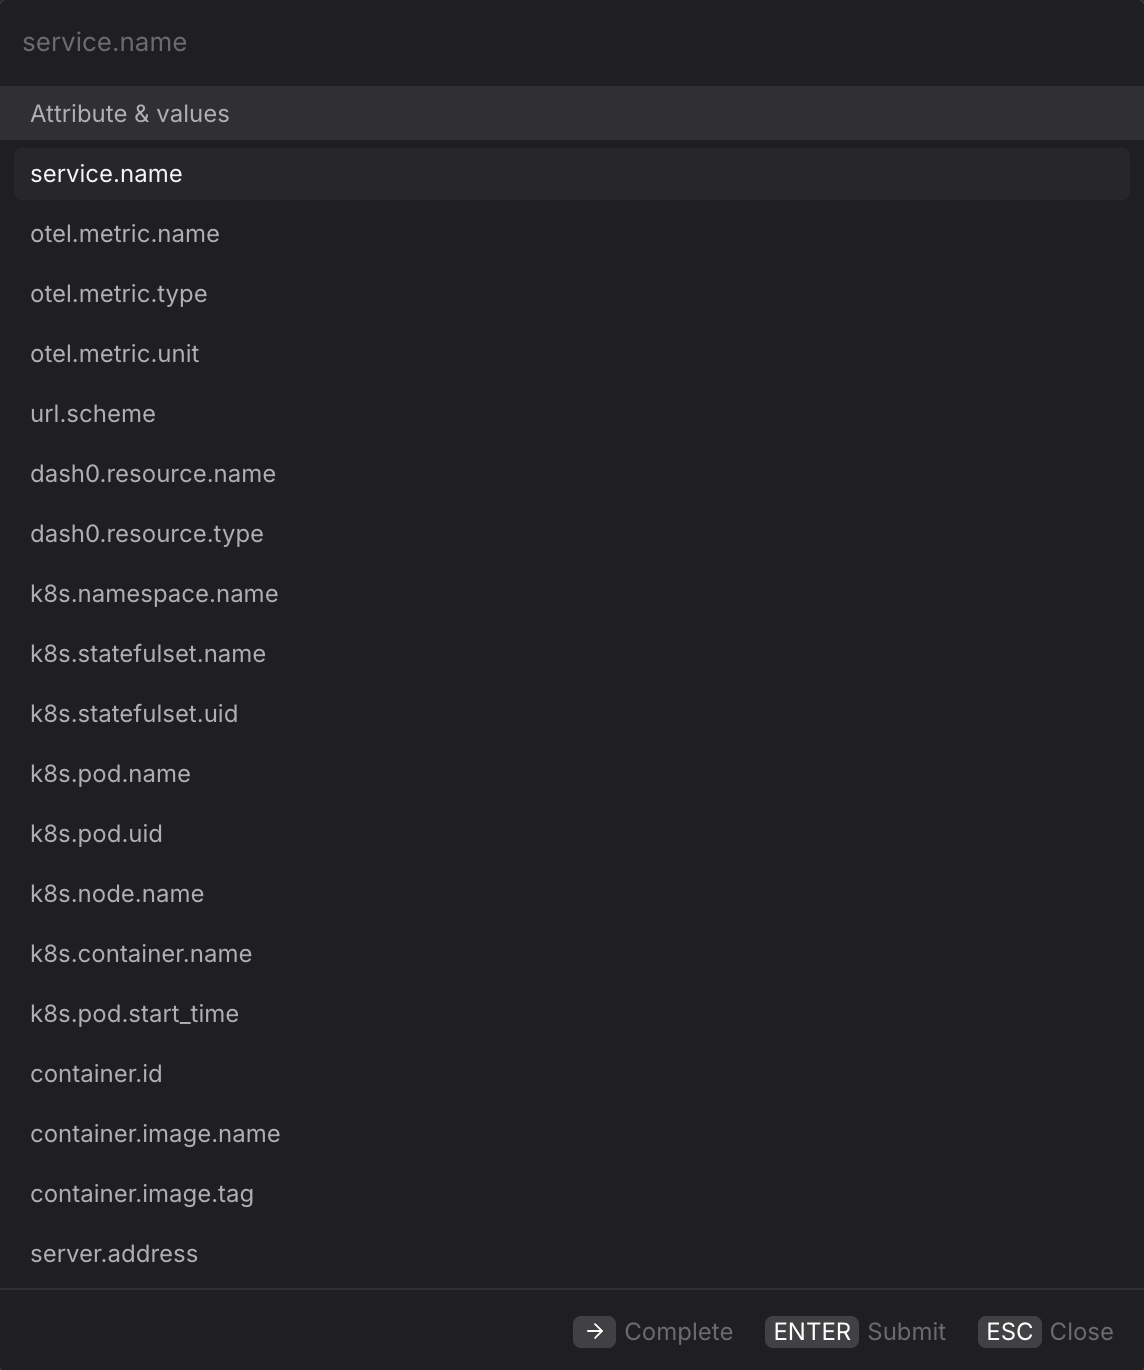
- Scope to a single service. Filter by
service.nameto restrict the query to metrics emitted by a specific service — useful when the same metric name is emitted by multiple services and you want to isolate one. - Pin to a Kubernetes namespace. Filter by
k8s.namespace.nameto scope infrastructure metrics to a specific namespace — essential in multi-tenant clusters where the same metric may be emitted from several namespaces. - Scope to a specific pod or node. Filter by
k8s.pod.nameork8s.node.nameto drill down to a single instance — useful when aggregate metrics look healthy but you suspect one instance is behaving differently. - Filter by resource type. Filter by
dash0.resource.typeto restrict metrics to a specific infrastructure resource type — useful when a metric is emitted from multiple resource types and you want to isolate one. - Filter by metric type. Filter by
otel.metric.typeto restrict results to a specific metric type — useful when searching for a metric by partial name and the results include multiple types.
Split By an Attribute
Use Split by to break the aggregated time series into one line per unique value of a label, without switching to the PromQL tab. Click + Add split to add a split dimension.
- Split by
k8s.pod.nameto compare metric values across individual pods — useful for detecting whether a problem is isolated to a single instance rather than affecting the whole fleet. - Split by
k8s.node.nameto surface node-level differences in infrastructure metrics — for example, to check whether resource counts or connection statuses are uniform across nodes. - Split by
k8s.namespace.nameto compare the same metric across namespaces in a single chart — useful for multi-tenant environments where you want to rank namespaces by activity or resource consumption. - Split by
dash0.resource.nameto break down metrics by the specific infrastructure component that emitted them. - Split by
container.image.tagto compare metric values across container image versions — useful for verifying that a newly deployed image has not changed the behavior of a key metric. - For more complex queries — for example, arithmetic between two metrics, multi-level aggregations, or joining metrics from different sources — switch to the PromQL tab. Your current Metrics query is carried over and you can extend it manually.
Create Dashboards and Check Rules from the Query
Once you have the view you want, use the buttons at the top of the Query Builder, above the preview chart.
![]()
- Click Add to dashboard to add the current query as a panel to a new or existing dashboard.
- Click Create check rule to open the check rule editor with this query pre-filled as the rule expression.