Last updated: July 14, 2026
Analyze Tracing Data
The Tracing tab in the Query Builder provides a cross-service view of tracing data across your entire environment.
Use it when you want to analyze latency, request volumes, or error rates across all services at once, or when you want to break down span data by attributes that cut across service boundaries.
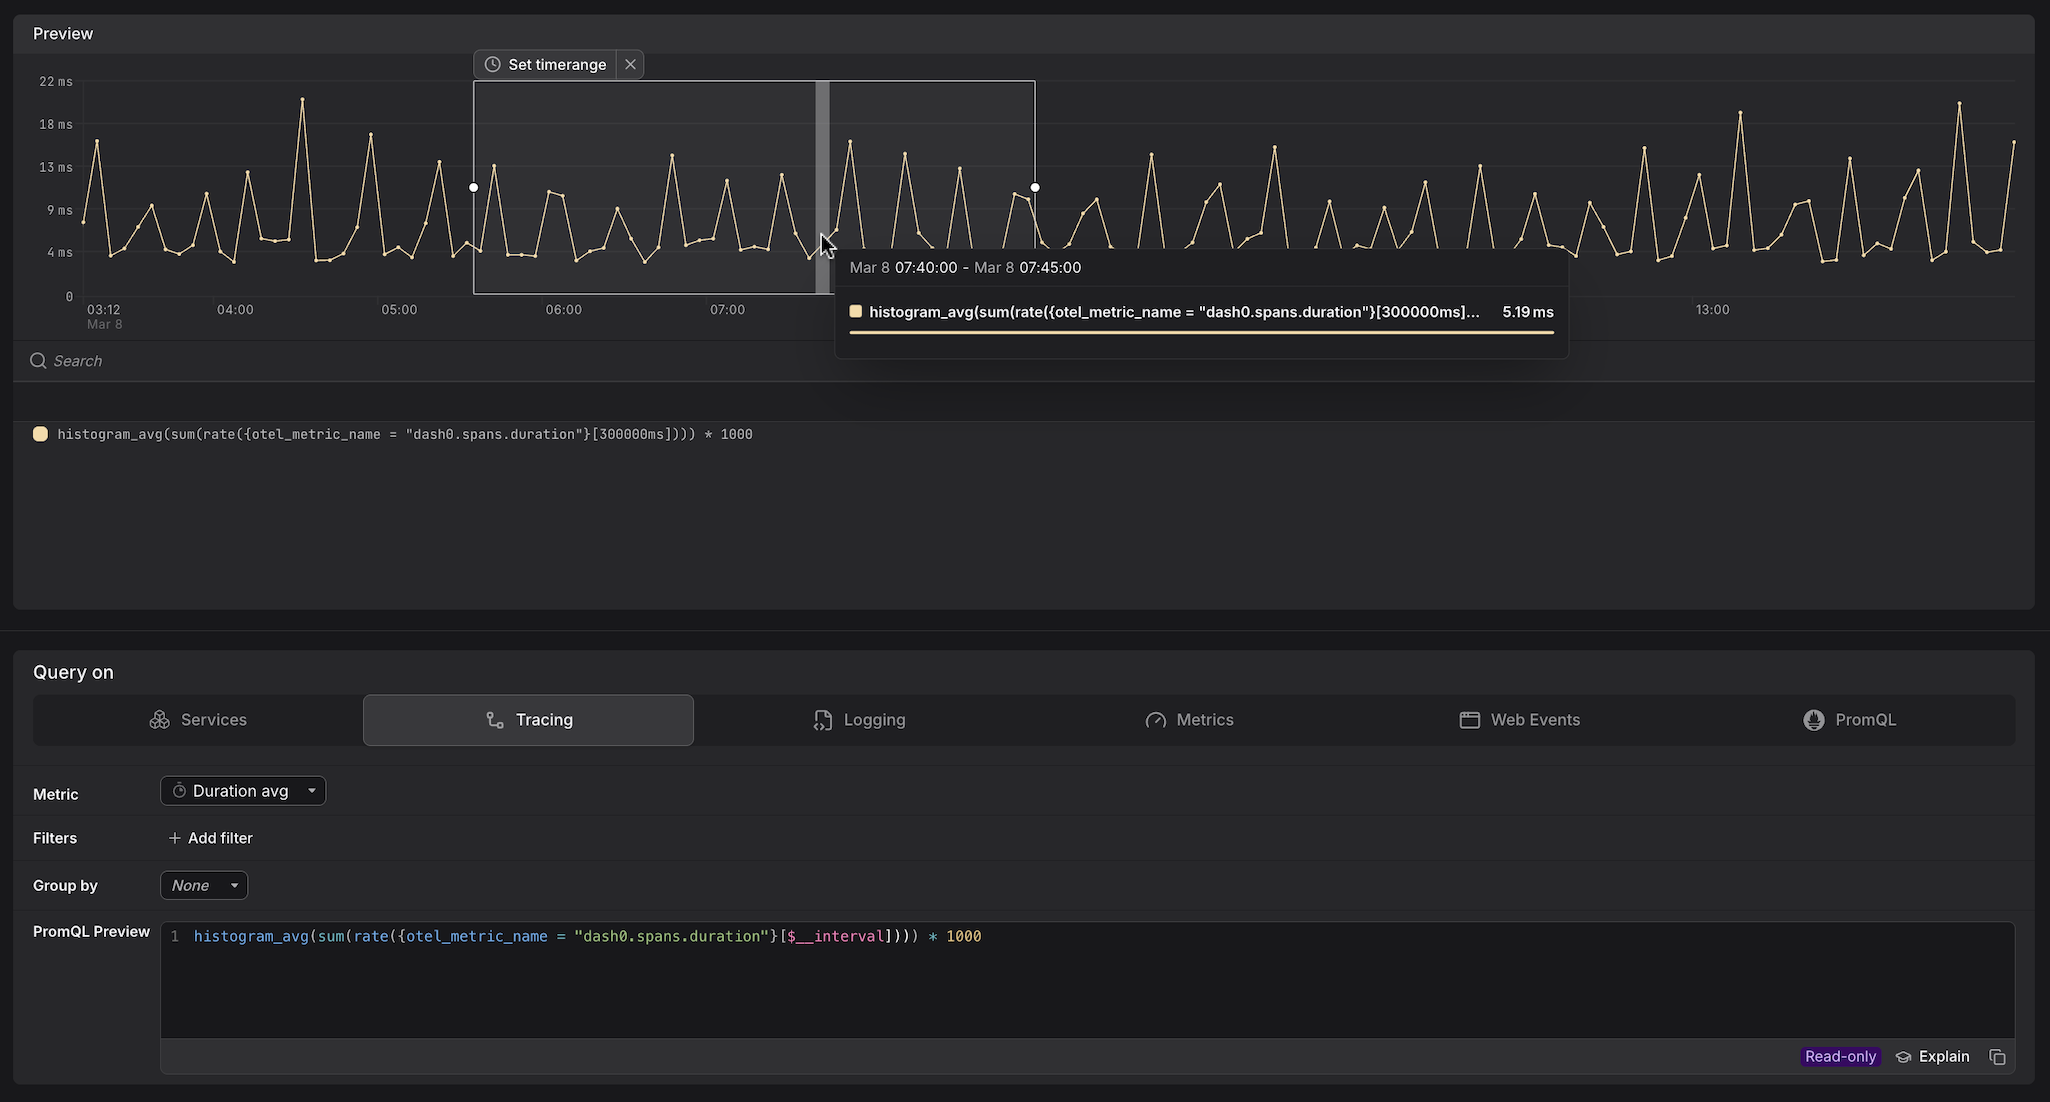
Dash0 automatically generates a set of built-in synthetic metrics from your telemetry. These appear alongside your own custom metrics in the Query Builder, as can be seen above. For example:
dash0.spans— derived from span telemetry; used by the Services and Tracing tabs.dash0.spans.duration— the duration histogram of all spans; powers latency queries in Services and Tracing.
These metrics are also accessible directly in the Metrics and PromQL tabs, giving you the flexibility to combine them with your own metrics or apply custom aggregations.
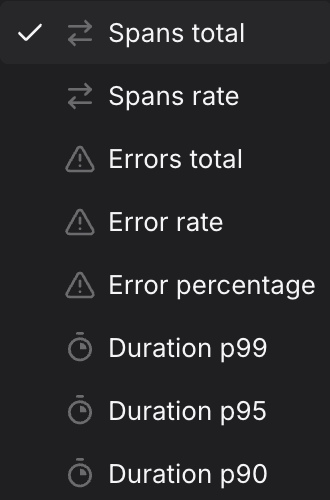
Select the Metric
Use the Metric dropdown to choose what you want to measure.
The preview chart updates immediately and the PromQL Preview shows the generated query, including any filters and aggregations applied.
Add Filters
Use + Add filter to scope the query to specific span attributes. Multiple filters are combined with AND logic.
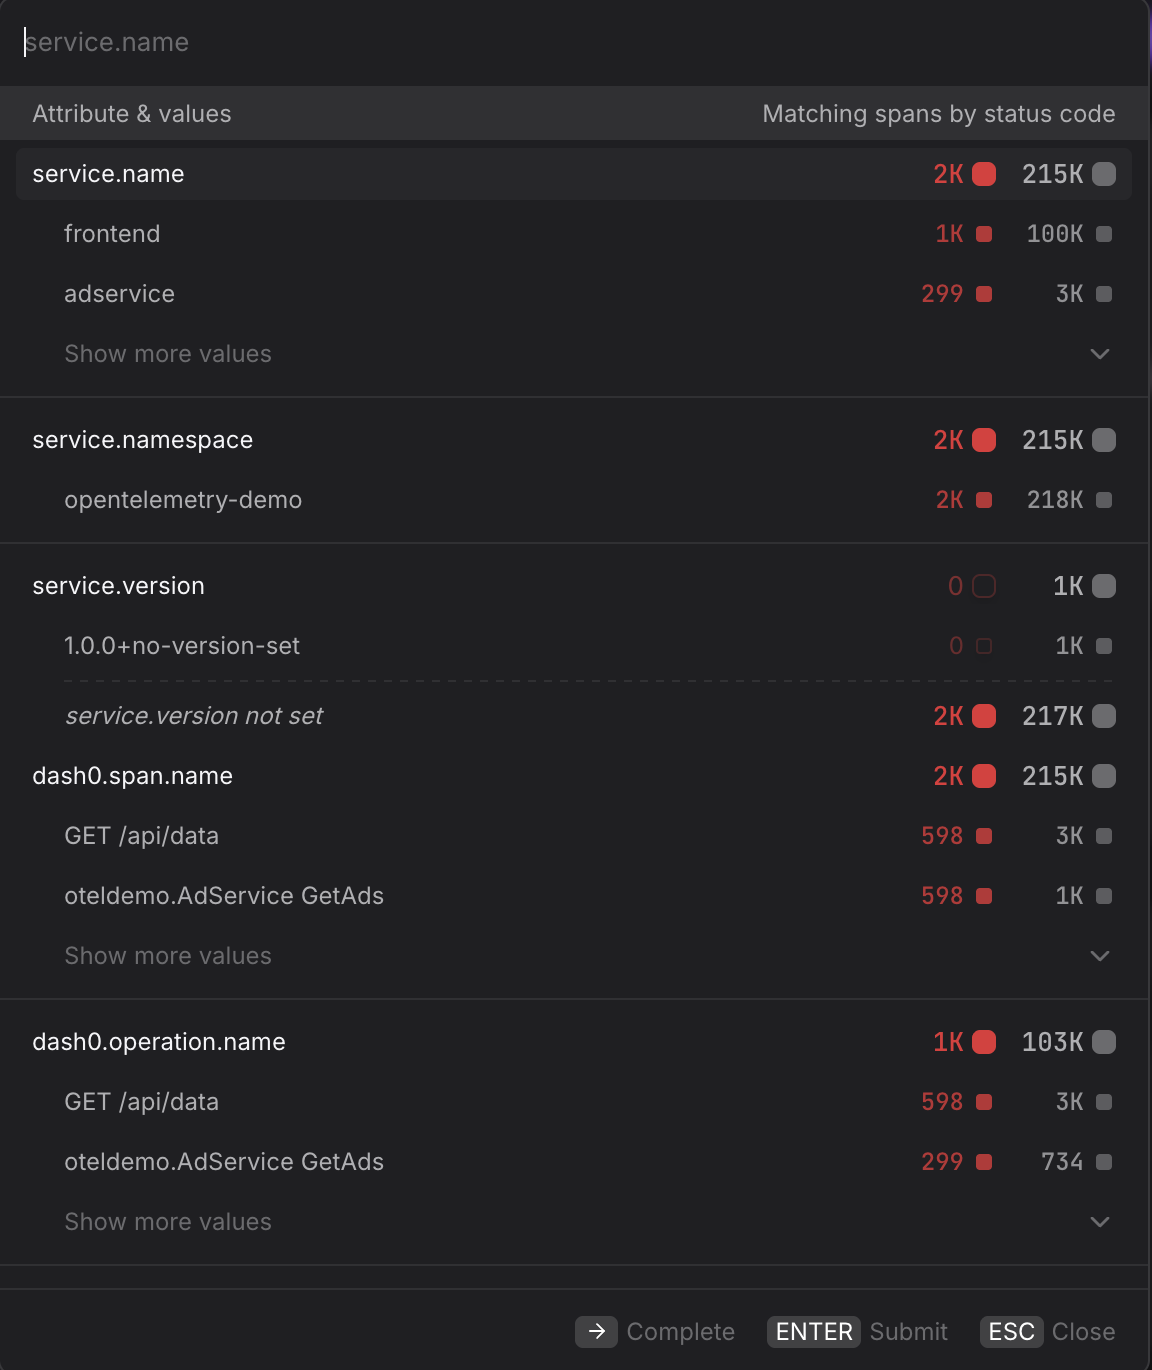
- Scope to a single service. Filter by
service.name=frontendto restrict the query to a single service without switching to the Services tab — useful when you want to combine a service filter with a Group by dimension that is not available in the Services tab. - Scope to a specific namespace. Filter by
service.namespace=acme-prodin multi-tenant clusters to ensure you are only seeing spans from the intended workload and not from services that share the same name in a different namespace. - Focus on error spans only. Filter by
otel.span.status.code=ERRORalongside the Error rate metric to isolate spans that completed with an error status. UseUNSETto see spans where no explicit status was set — these are neither successes nor failures and can indicate incomplete instrumentation. - Filter by HTTP response code. Filter by
http.response.status_code=500to isolate server-side failures and separate them from client errors (400–499) that may not warrant an alert. - Narrow to a specific operation. Filter by
dash0.operation.name=GET /api/datato focus on a single endpoint across all services — useful when the same operation name appears in multiple services and you want to compare their behavior in the same query.
For more information, see Filtering.
Group By an Attribute
Use the Group by dropdown to split the time series by a span attribute, producing one line per unique value of that attribute.
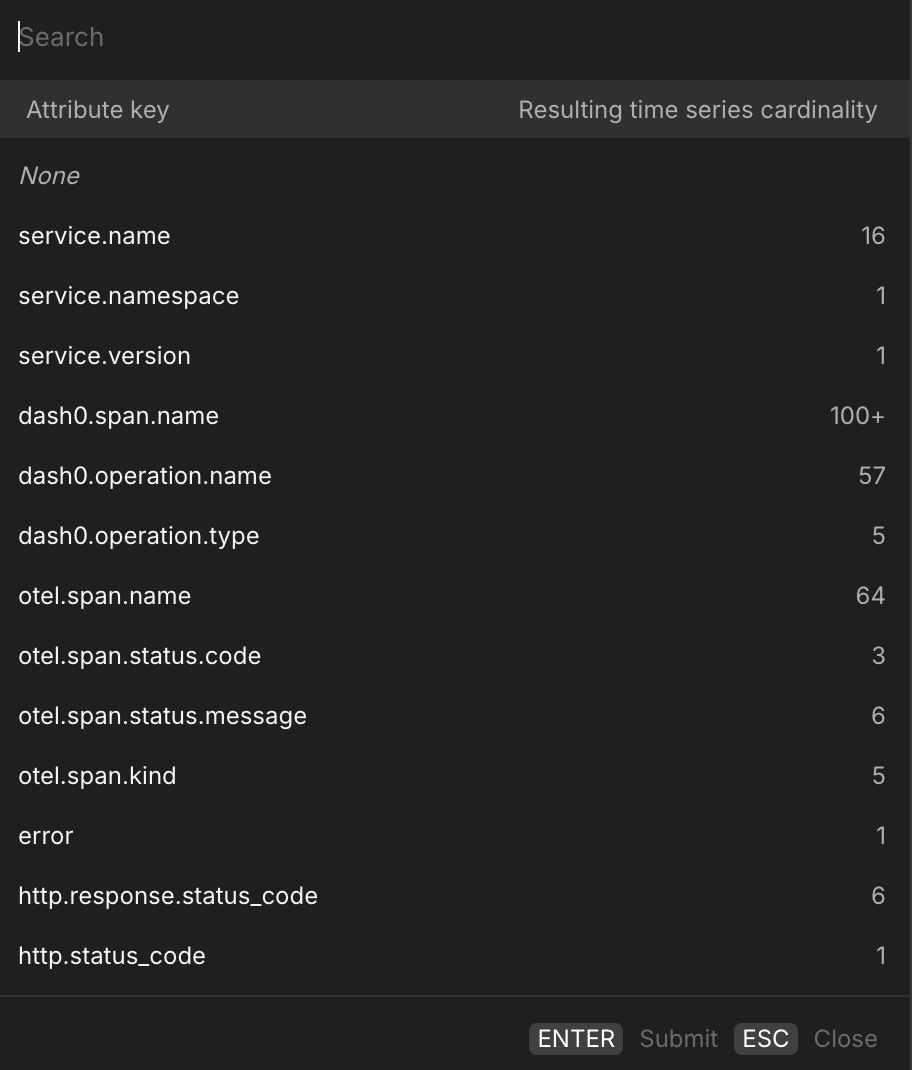
- Group by
service.nameto compare latency or error rates across all services in a single chart — useful for spotting which service started degrading after a deployment without having to build separate queries per service. - Group by
dash0.operation.nameto rank operations by latency or error rate across your entire environment, without being restricted to a single service. - Group by
otel.span.kindto separate client-side spans (CLIENT) from server-side spans (SERVER) — the two often have very different latency profiles and mixing them can obscure where time is actually being spent. - Group by
http.response.status_codealongside the Spans total metric to visualize the distribution of response codes over time and quickly spot when500responses begin to climb relative to200responses. - For multi-dimension breakdowns, switch to the PromQL tab. Your current Tracing query is carried over and you can extend the
byclause manually — for example, to split by bothservice.nameanddash0.operation.namesimultaneously.
Create Dashboards and Check Rules from the Query
Once you have the view you want, use the buttons at the top of the Query Builder, above the preview chart.
![]()
- Click Add to dashboard to add the current query as a panel to a new or existing dashboard.
- Click Create check rule to open the check rule editor with this query pre-filled as the rule expression.