
Last updated: September 16, 2026
Track Adoption
The Adoption tab answers two separate questions: how far AI coding has spread, and how sophisticated the usage has become.
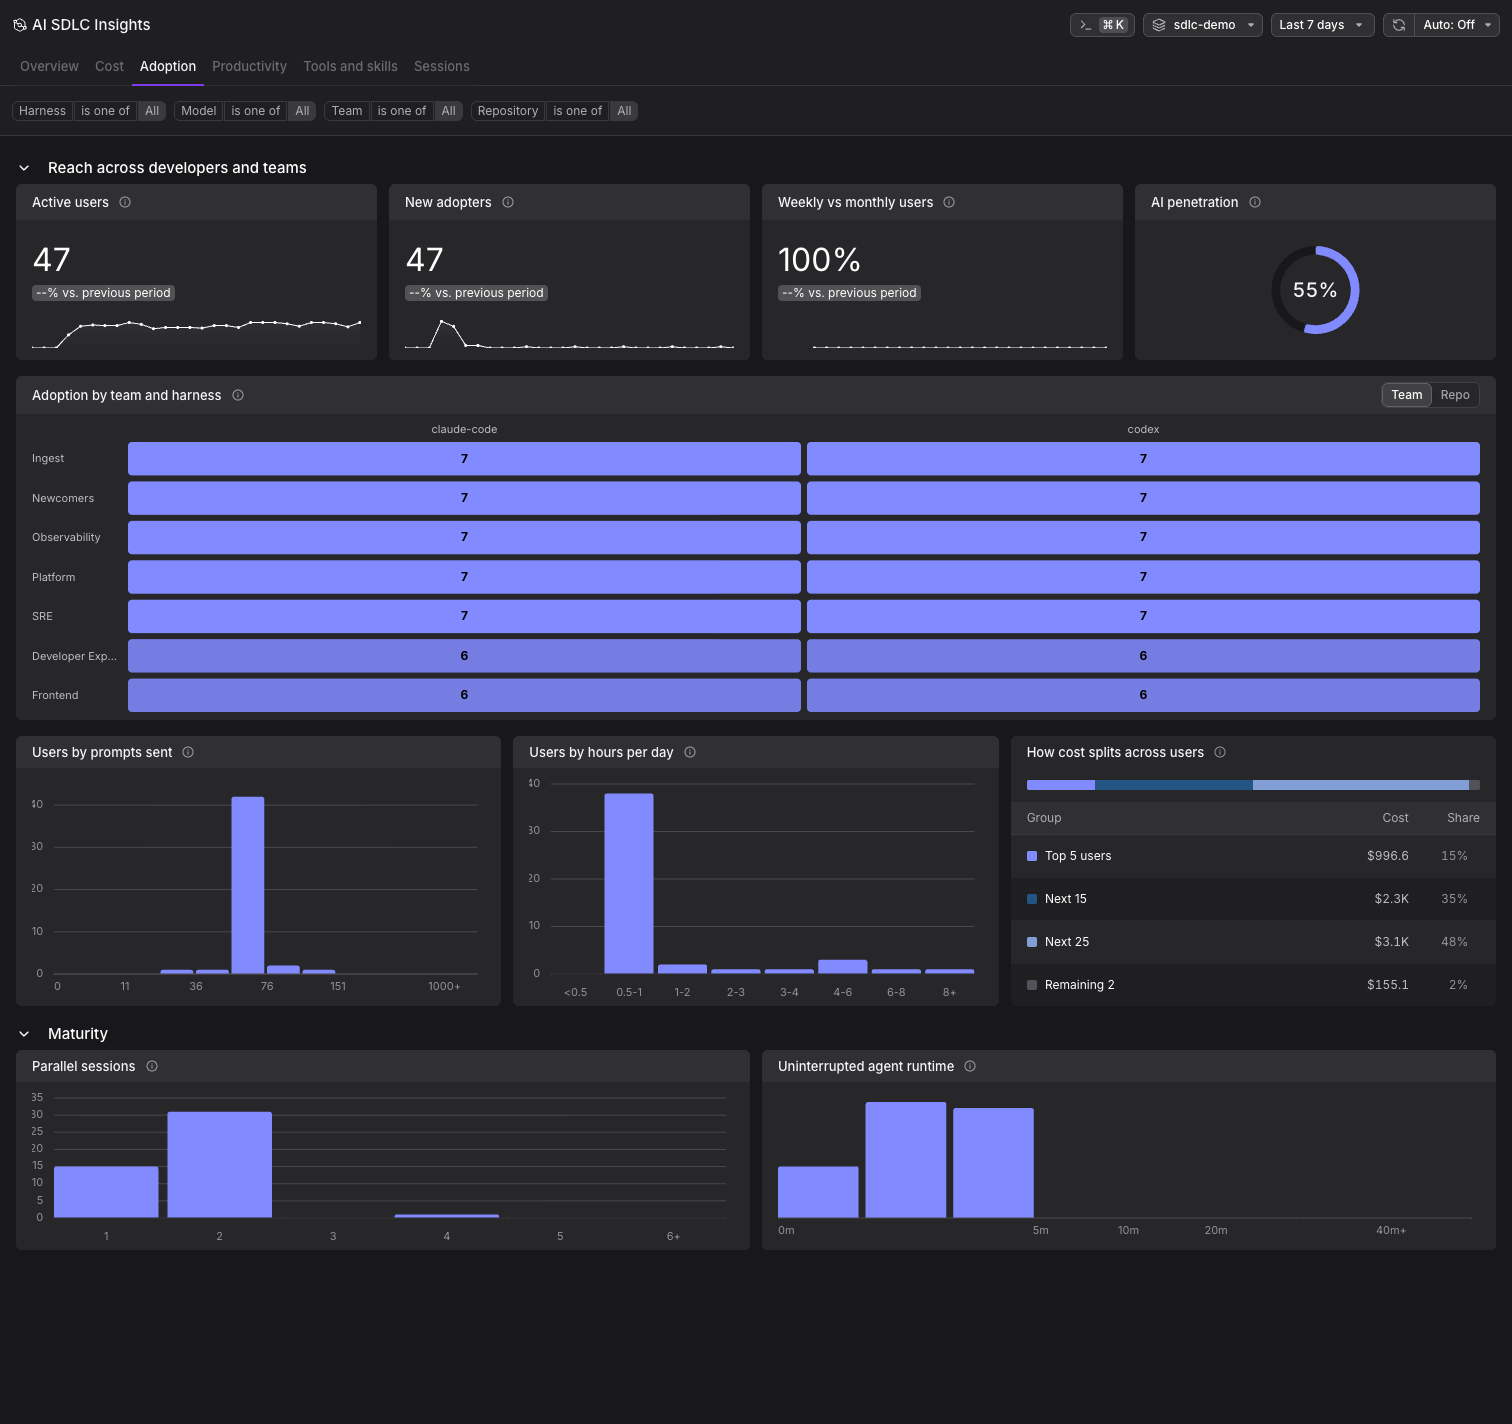
Reach Across Developers and Teams
- Active users and New adopters, each compared against the previous period.
- Weekly vs monthly users: Weekly active users over the last 7 days divided by monthly active users over the last 28 days. A high number means the same people come back week after week. Both windows are fixed and do not follow the selected time range.
- AI penetration: The share of merged pull requests with at least one AI coding session on the branch. It measures reach, not quality, and needs the GitHub integration.
- Adoption by team and harness: A matrix of users per team per harness, with a Team / Repo toggle to switch the rows.
- Users by prompts sent: A histogram from light users to power users.
- Users by hours per day: A histogram of daily time spent in sessions.
- How cost splits across users: Spend grouped into the top 5 users, the next 15, the next 25, and everyone remaining, with each group's share of the bill.
Maturity
Two histograms that describe how developers work with agents rather than whether they do:
- Parallel sessions: How many sessions a developer runs at once. Sustained values above one mean developers are delegating work and moving on rather than watching a single session.
- Uninterrupted agent runtime: How long an agent runs before a person intervenes. Longer runs indicate developers trust the agent with larger units of work, and usually follow from better prompts, clearer project instructions, and tooling the agent can use without asking.
Read these together with cost. Rising parallelism and longer uninterrupted runs raise spend per developer while the developer's own time is spent elsewhere, which is the intended trade rather than a cost regression.
How to Use Track Adoption
Separate reach from habit. Active users counts anyone who ran a session. Weekly vs monthly users tells you whether those people came back. Broad reach with a low ratio means developers tried agents and drifted away, which is a different problem than narrow reach with a high ratio.
Find where adoption is uneven. The team and harness matrix shows which teams picked agents up and which did not. Teams with low adoption may need training, clearer use cases, or examples from colleagues.
Check whether cost is concentrated. If the top 5 users account for a large share of the bill, that is either a small group of power users worth learning from or a small group worth reviewing. Drill into their sessions to tell which.
Use maturity to target enablement. A team with broad adoption but a parallel-session count pinned at one is using agents as a faster autocomplete. That is the team where workflow training, not more licenses, changes the outcome.
Further Reading
- Explore Sessions: Drill into individual developer workflows.
- Key Concepts: Definitions for AI penetration and weekly vs monthly users.
- Measure Productivity: Connect adoption to throughput and time to merge.
- Track Cost: See what AI coding costs across your organization.