
Last updated: September 16, 2026
Read the Overview
The Overview is the front door to AI SDLC Insights. It carries the five headline numbers and three views that appear nowhere else in this form.
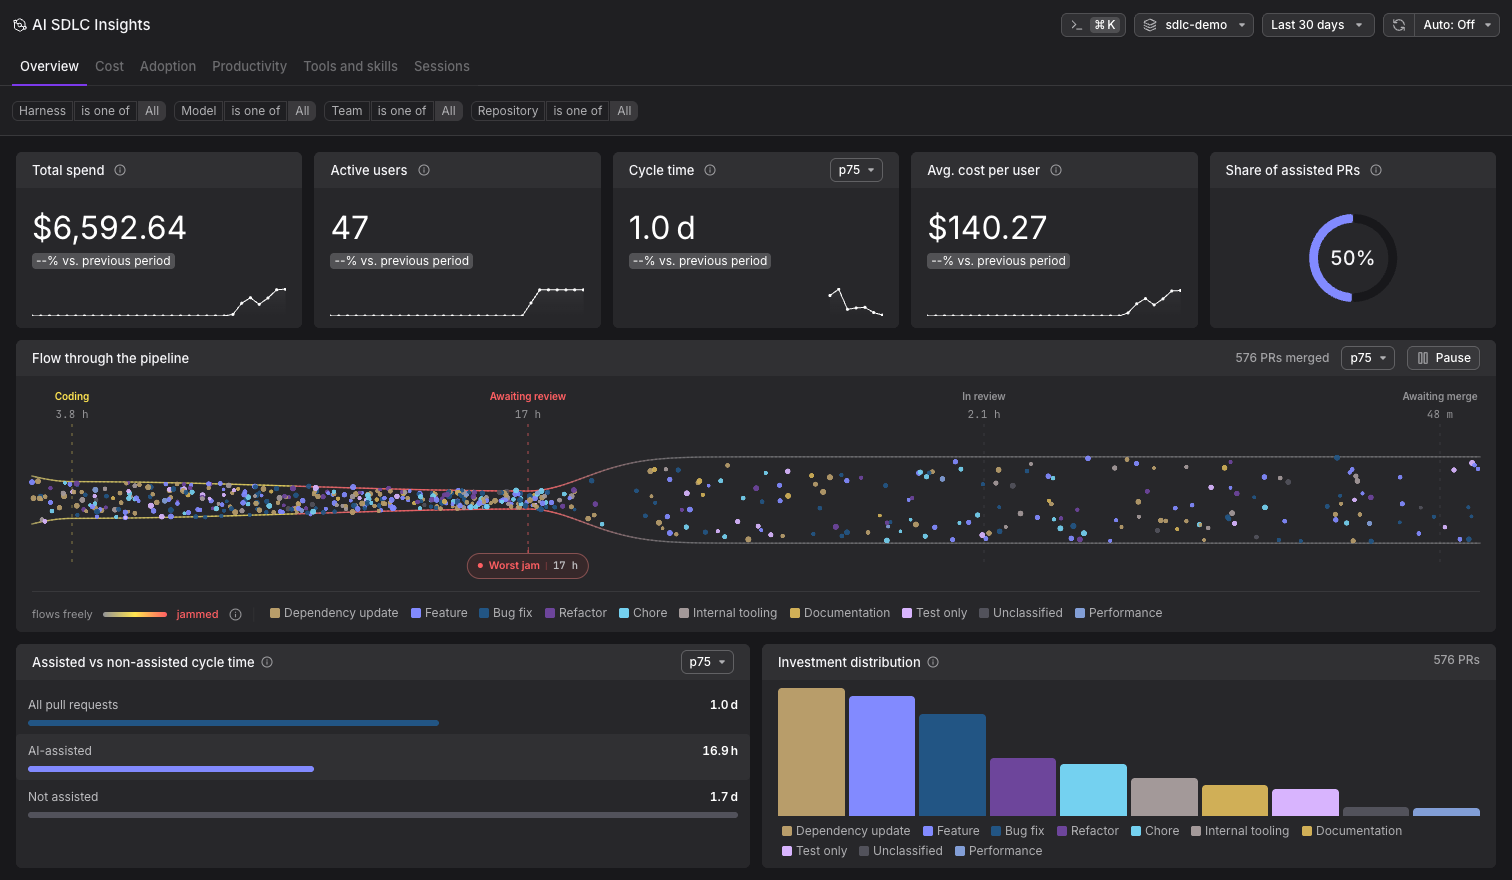
What the Overview Shows
Headline numbers
- Total spend: What model usage cost in the selected range, compared against the previous period.
- Active users: Developers whose harness emitted telemetry in the range.
- Cycle time: First commit to merge, at the percentile you pick. See Cycle time.
- Avg. cost per user: Total spend divided by active users.
- Share of assisted PRs: The share of pull requests opened in the range that an AI coding agent assisted.
Flow through the pipeline
Merged pull requests move through four stages, and this view shows how long they sit in each one at the selected percentile:
- Coding
- Awaiting review
- In review
- Awaiting merge
The stage with the longest wait is called out as the worst jam. Hovering a stage explains what it measures and how many pull requests are in it right now. Awaiting review, for example, runs from ready for review to the first thing that unblocked the pull request: a review by someone other than the author, or an approval by anyone, an automated reviewer's included.
Each dot is a pull request, colored by PR type. Use Pause to stop the animation and read the distribution.
Assisted vs non-assisted cycle time
Three bars at the selected percentile: all pull requests, the ones an AI coding agent assisted, and the ones it did not. This is the closest thing to a direct answer on whether agent-assisted work ships faster.
Read this comparison as a description, not a verdict. Agent-assisted and unassisted pull requests are not randomly assigned. Teams reach for agents on particular kinds of work, so some of any gap reflects which changes got an agent rather than what the agent did to them. The PR type breakdown on the Productivity tab is the place to check whether the mix explains the difference.
Investment distribution
Merged pull requests grouped by PR type, showing where engineering effort actually went. The Productivity tab carries the same chart alongside Where the work goes, which splits sessions by harness, activity, model, or team.
How to Use the Overview
Find the jam before optimizing the wrong thing. Coding time is the stage teams assume they are improving with agents, but the worst jam is frequently awaiting review. Shipping faster then depends on review capacity, not on model choice.
Check reach before reading cost. A high total spend with few active users means concentrated usage, which is a different conversation than broad adoption at the same price. Read total spend and active users together.
Treat the assisted comparison as a starting question. If assisted pull requests merge faster, check on the Productivity tab whether they are also smaller or more heavily weighted toward one PR type.
Further Reading
- Key Concepts: Definitions for cycle time, PR type, and the flow stages.
- Measure Productivity: Throughput, time to merge, and review depth.
- Track Adoption: Who uses AI coding and how habitually.
- Track Cost: Spend by harness, model, effort, team, and repository.