
Last updated: September 16, 2026
Explore Sessions
The Sessions tab lists individual harness runs and lets you open any one of them in full.
What Explore Sessions Shows
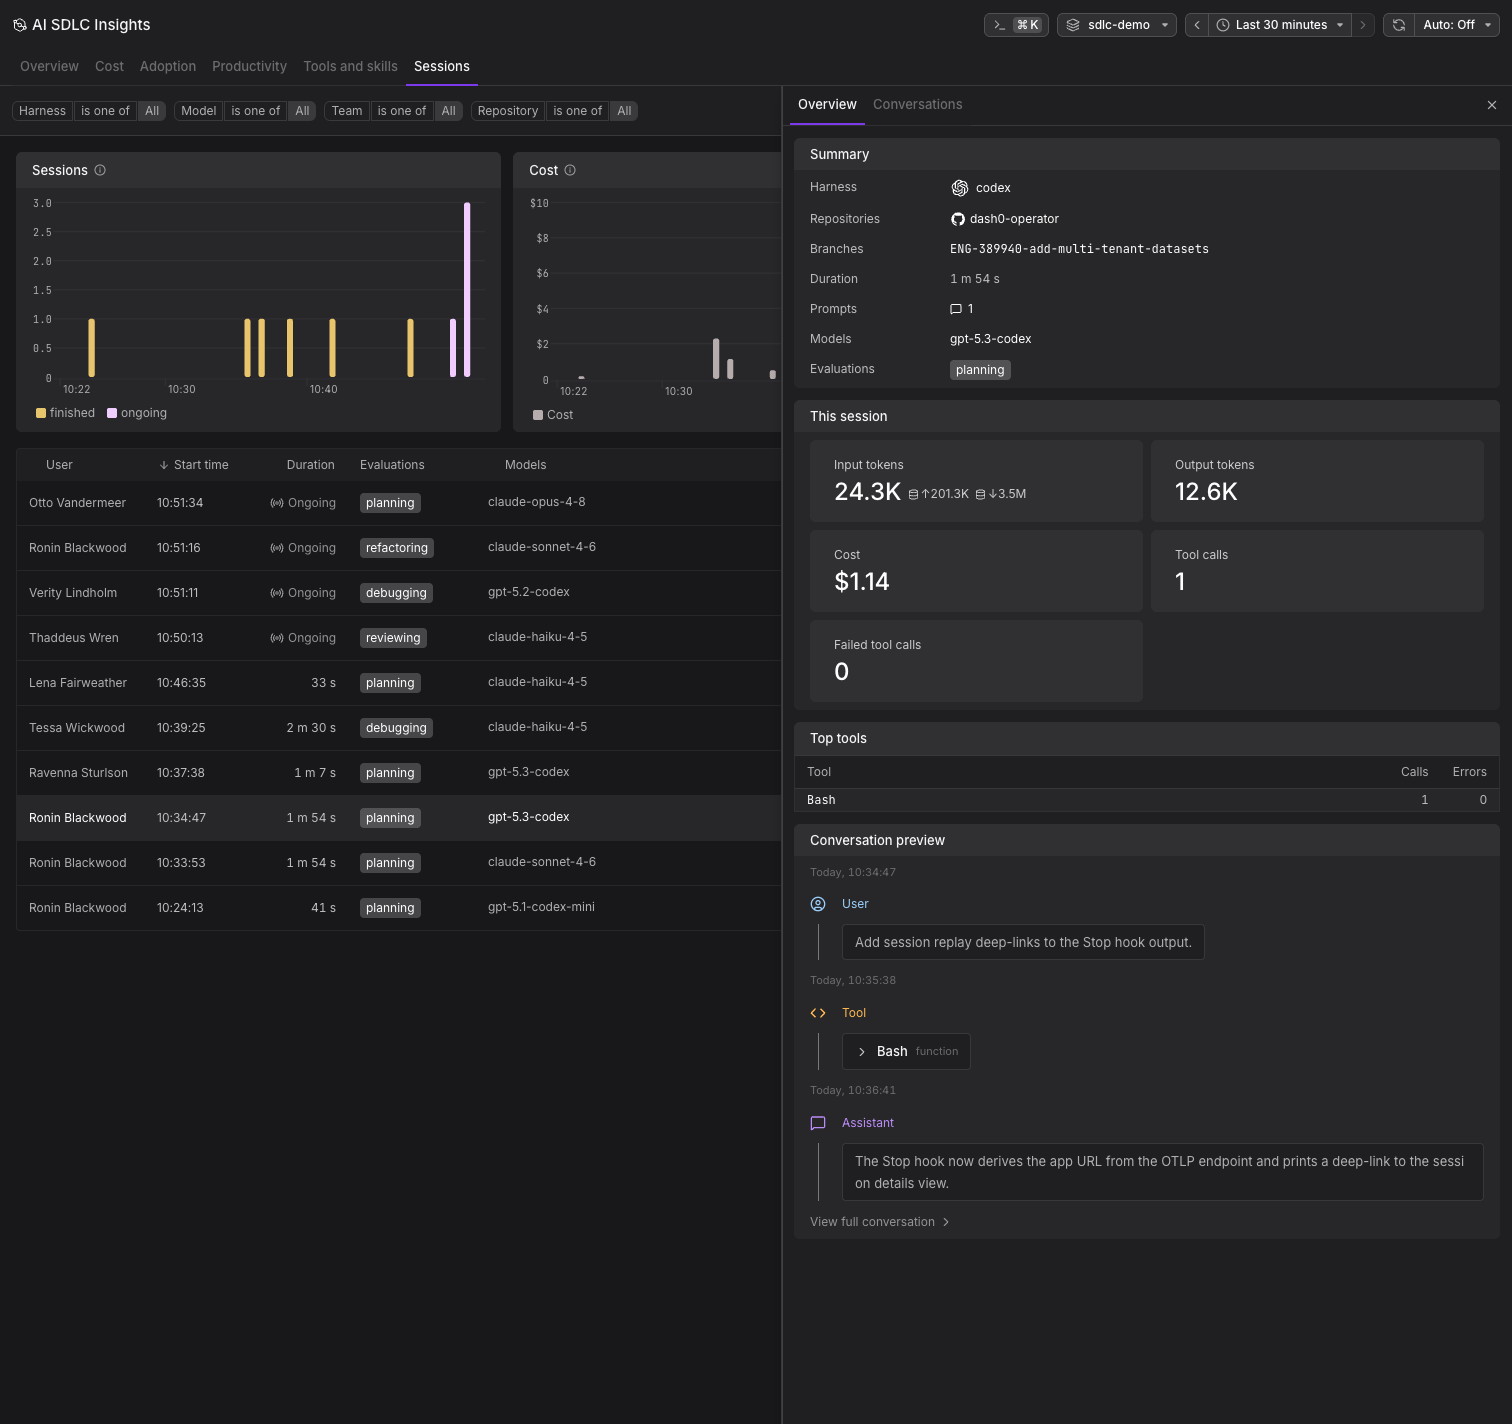
Three charts sit above the list:
- Sessions: Sessions over time, split into finished and ongoing.
- Cost: Spend over the same interval.
- What sessions worked on: The share of sampled sessions per activity. A session that both debugged and planned counts in both, so the bars do not add up to 100%.
The list itself has a row per session:
| Column | What it shows |
|---|---|
| User | The developer who ran the session |
| Start time | When the session began |
| Duration | How long it ran, or an Ongoing badge |
| Evaluations | The activities Dash0 evaluated the session as working on |
| Models | Which models were used |
| Repositories | The codebases worked on |
| Cost | Token spend for the session |
| Prompts | Number of user prompts |
Sort by any column to surface the most expensive or longest-running sessions, and use the Harness / Model / Team / Repository filter bar at the top of the page to narrow the list. Click a row to open its detail panel.
Session Detail Panel
The panel opens on two tabs, Overview and Conversations.
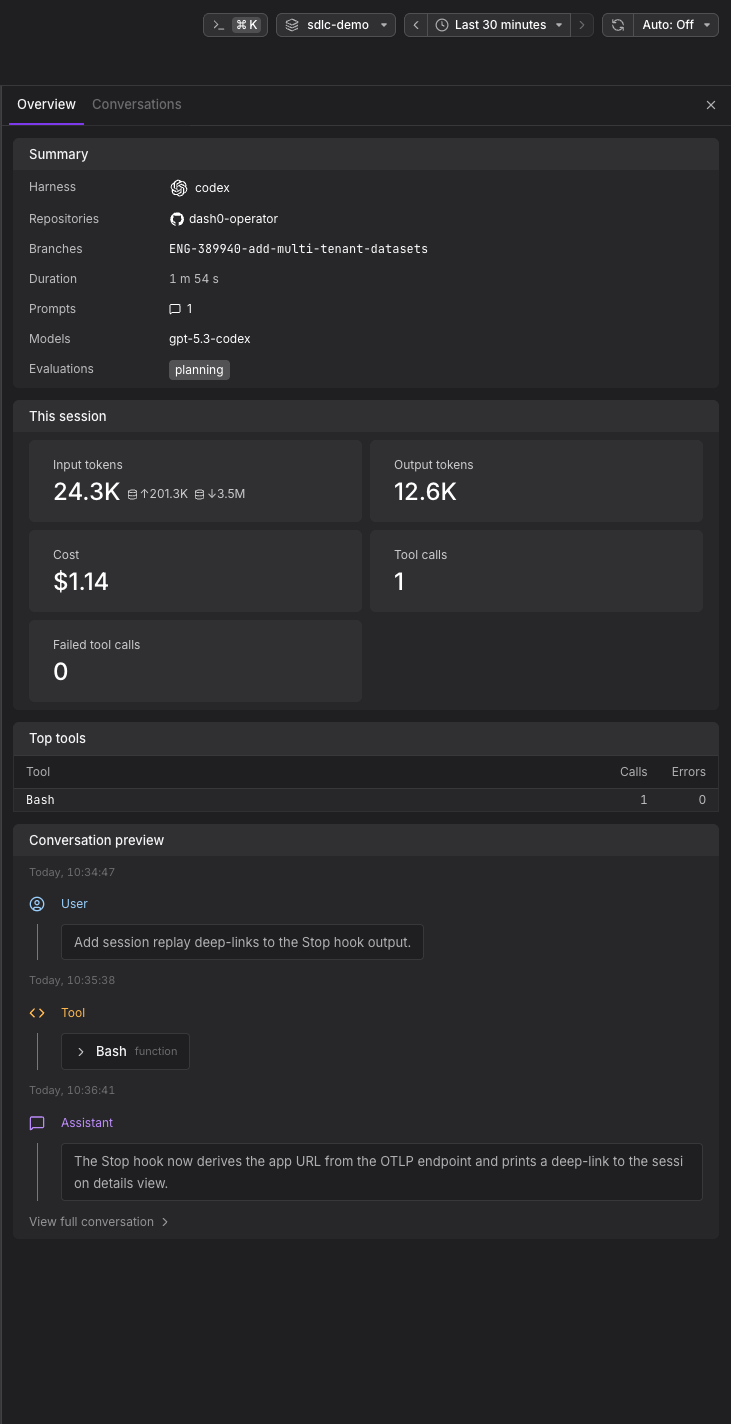
Summary identifies the session:
- Harness: The coding tool that ran, for example
claude-code,cursor, orcodex. - Repositories and Branches: Where the work happened. The branch is what links this session to a pull request.
- Duration, Prompts, and Models.
- Evaluations: The activities the session was evaluated as working on.
This session carries the numbers:
- Input tokens, with cache reads and cache creation broken out alongside.
- Output tokens, Cost, Tool calls, and Failed tool calls.
Top tools and Top MCP tools rank what the session called, with call and error counts. Conversation preview shows the prompts and responses, including the tools invoked along the way; open the full conversation to read the complete exchange.
This is where you go to understand a single number from another tab, for example why one session was unusually expensive or why a user's tool calls failed.
How to Use Explore Sessions
Find expensive sessions. Sort by cost to surface the sessions that consumed the most tokens. High-cost sessions may indicate complex work, inefficient prompting, or runaway tool calls. The cache read and cache creation figures usually explain the gap: a session that keeps recreating its cache pays for the same context repeatedly.
Investigate failed tool calls. The detail panel shows failed tool calls. Common causes include permission errors, missing files, or misconfigured MCP servers. Use this to identify patterns and fix the underlying issues.
Check why a session is not attributed to a pull request. If a session you expected to count as assisted does not, open it and look at Branches. A session that reported no branch cannot be linked to a pull request.
Learn from power users. Filter by user to see sessions from developers who use AI coding most effectively. Review their conversation flow and tool usage to identify patterns worth spreading.
Further Reading
- Analyze Tools and Skills: Understand which tools are called across sessions.
- Key Concepts: Definitions for sessions, evaluations, and activity.
- Track Cost: See aggregate spend across all sessions.
- Troubleshoot AI SDLC Insights: Solutions for session and telemetry issues.