
Last updated: September 16, 2026
Track Cost
The Cost tab makes spend visible at every level, which is the starting point for connecting spend to outcomes.
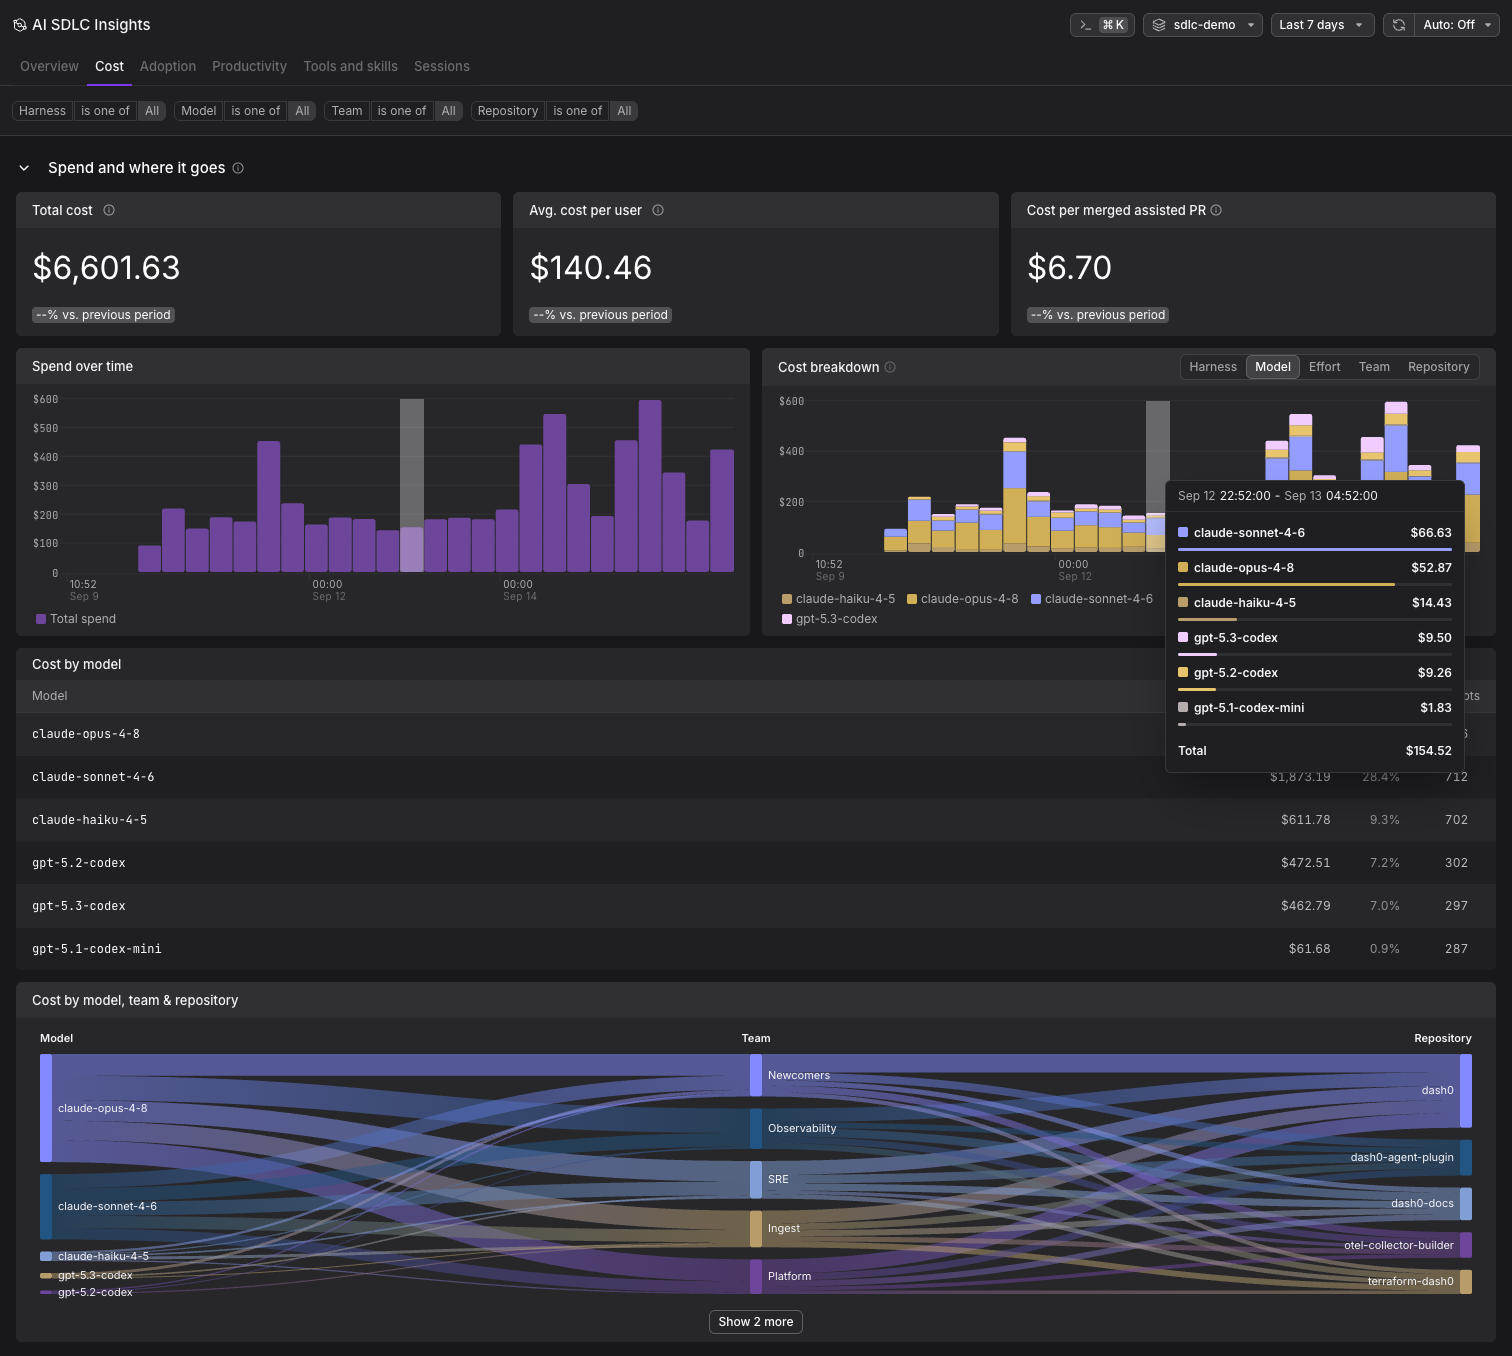
Spend and Where It Goes
- Total cost and Avg. cost per user, each compared against the previous period.
- Cost per merged assisted PR: Total spend divided by the merged pull requests an AI coding agent assisted. This is the unit-economic headline: what one shipped, agent-assisted change cost in tokens. It needs the GitHub integration.
- Spend over time: Total spend per interval.
- Cost breakdown: The same spend split by Harness, Model, Effort, Team, or Repository.
- Cost by model: A table ranking models by spend, with each model's share of the total and the prompt count behind it.
- Cost by model, team & repository: A Sankey diagram tracing spend from model, through team, to repository. Use it to see which team's work drives a given model's bill, and where that work lands.
Cost is computed from token counts using a Dash0-maintained pricing catalog. For developers on flat-rate or subscription plans, the provider does not expose per-session usage, so the figures are an estimated API-equivalent cost: what the same tokens would cost at pay-as-you-go rates. For those seats, this estimate is the only window into per-developer and per-model usage.
The Effort breakdown splits spend by the reasoning level requested of the model. Only Claude Code reports one, so sessions from Cursor, OpenAI Codex, and GitHub Copilot CLI carry no effort value and an organization running only those harnesses sees nothing here. See Effort.
How to Use Track Cost
Spot which models drive spend. The cost breakdown by model shows which models dominate your bill. A frontier model often dominates spend even when it does not dominate session count, which is the signal for a model-governance conversation.
Judge models on throughput per dollar, not price per token. Read the per-model cost here against time to merge on the Productivity tab. A model that takes more prompts but costs far less per token, and reaches the same time to merge, is the better economic choice. One that is cheaper per token but doubles time to merge is not.
Trace a bill to the work behind it. The Sankey is the fastest way to answer "why is this model expensive?" A single team pushing one repository through a frontier model looks very different from broad usage at the same total.
Compare harnesses on the same terms. Because cost is computed from tokens rather than vendor billing, switching the breakdown to Harness compares your harnesses directly, including the ones whose subscription pricing hides usage.
Watch the trend, not the total. Spend over time shows whether cost is climbing, stable, or dropping. Sudden spikes often indicate new team members onboarding, a major refactoring, or a shift to more expensive models.
Further Reading
- Key Concepts: Definitions for cost, effort, and cost per merged assisted PR.
- Measure Productivity: Connect spend to throughput and time to merge.
- Track Adoption: See how spend is distributed across developers.
- Explore Sessions: Drill into individual sessions to understand costs in detail.