
Last updated: October 2, 2026
Write Prompts
Write prompts to instruct Agent0 what to do when your automation runs. The prompt is your instruction to Agent0, with variables filled in from the triggering event.
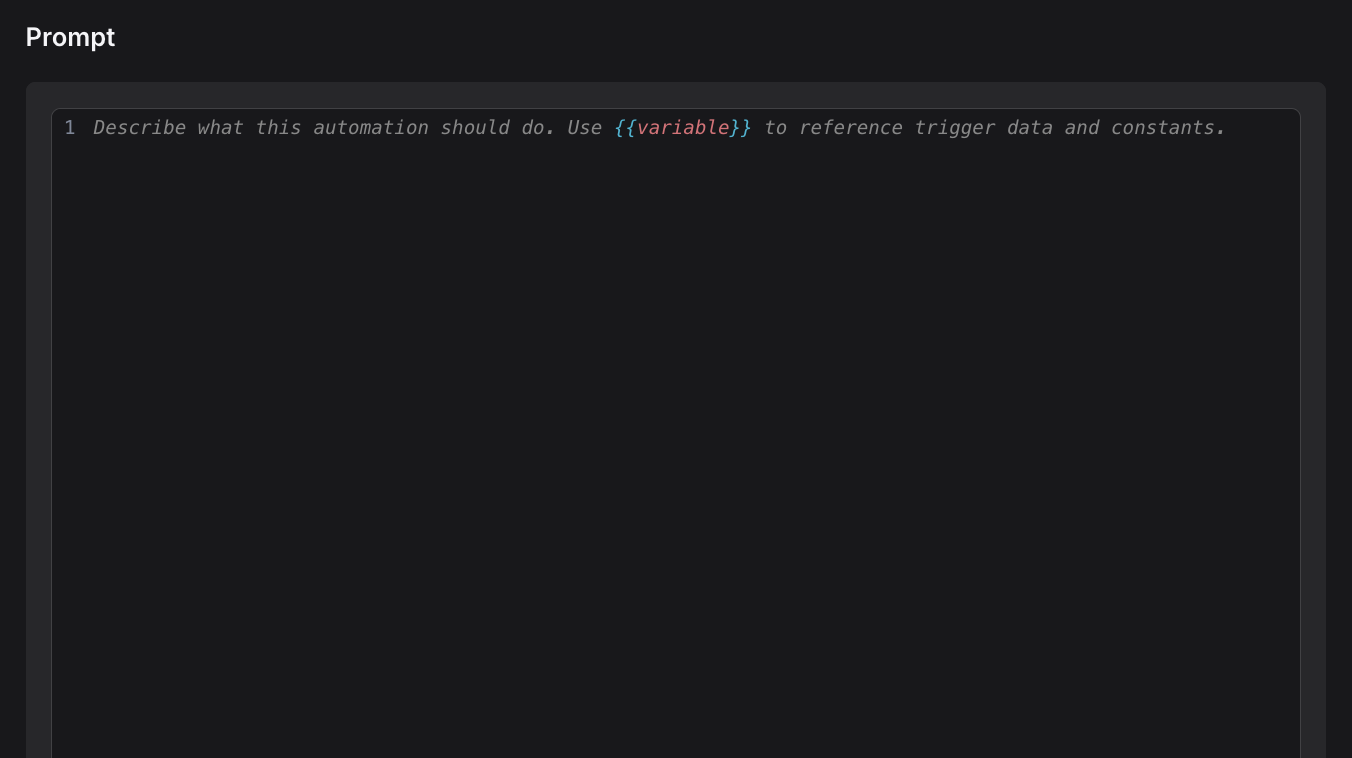
The User Prompt Field
The prompt lives in the Agent section of the automation form, below the Model field. It contains the instruction text sent to Agent0. Write it as if you're instructing a capable colleague who has access to your observability data but needs clear direction.
When an automation triggers:
- Variables like
{{slack.channel.name}}are replaced with actual values from the event - The resolved prompt is sent to Agent0
- Agent0 analyzes the instruction, queries data, and takes actions
- Results are recorded in the run history
Write Clear Instructions
Agent0 performs best with specific, actionable instructions.
Be Specific
Vague:
1Check the service.
Specific:
1Query the error rate for the checkout service over the last hour. If it exceeds 5%, post a summary to #incidents with the top 3 error messages.
The specific version tells Agent0:
- Which service (
checkout) - Which metric (
error rate) - Time range (
last hour) - When to act (
exceeds 5%) - Where to post (
#incidents) - What to include (
top 3 error messages)
Include Context
Explain why the task matters to help Agent0 make better decisions.
Without context:
1Query metrics for {{check.name}}.
With context:
1Check {{check.name}} failed in production. This check monitors our payment gateway. Query error rate, latency, and recent log errors over the last 30 minutes to help the on-call engineer diagnose the issue.
Context clarifies this is a production incident requiring urgency and focuses on payment-critical metrics.
Set Expectations
If you want specific output format, ask explicitly:
1Query the top 5 services by error rate in the last 24 hours. Format as a bulleted list with service name, error count, and p99 latency. Post to #daily-reports.
Agent0 will structure output to match your expectations.
Use Variables
Variables are placeholders that get replaced with real values when the automation runs.
Variable Syntax
Reference variables with double curly braces: {{variableName}}
Example:
1A user mentioned {{slack.message.text}} in {{slack.channel.name}}. Investigate this issue.
At runtime, if a message says "checkout service is down" in #incidents, the prompt becomes:
1A user mentioned checkout service is down in incidents. Investigate this issue.
Essential Variables
Most prompts use these variables:
Time:
{{now}}— Current timestamp (e.g.,2026-06-13T14:30:00Z){{today}}— Current date (e.g.,2026-06-13)
Slack triggers:
{{slack.channel.name}}— Channel name{{slack.message.text}}— Message content{{slack.user.handle}}— Who posted the message
Check triggers:
{{check.name}}— Failed check name{{label.service}}— Service from check labels
GitHub triggers:
{{github.repository}}— Repository name (e.g.,dash0hq/dash0){{github.action}}— What happened (e.g.,opened)
GitLab triggers:
{{gitlab.project}}— Project path (e.g.,acme/backend/api){{gitlab.action}}— Merge request action (e.g.,open), on the Merge Request trigger{{gitlab.comment.body}}— Comment text, on the Comment trigger
Start typing {{ in the prompt editor to see autocomplete suggestions for available variables.
When to Use Constants
Constants are custom values you define once and reuse. Use them for:
Environment names:
12Define: environment = "production"Use: Check failed in {{environment}} environment.
Default channels:
12Define: alert_channel = "incidents"Use: Post findings to #{{alert_channel}}.
Team identifiers:
12Define: team = "platform-team"Use: Alert the {{team}} about this issue.
Common timeframes:
12Define: analysis_window = "1h"Use: Query error rate over the last {{analysis_window}}.
Define constants in the automation's Constants section, then reference them like any other variable.
Example Prompts
Real-world examples demonstrate effective patterns.
Incident Triage
Trigger: Failed check
Prompt:
1234567891011Check "{{check.name}}" failed for service {{label.service}}.Query the following for the last 30 minutes:- Error rate and top 5 error messages- p99 latency trend- Recent log errors (limit 10)Summarize your findings and post to #incidents with:1. What happened2. Which service is affected3. Recommended next steps for the on-call engineer
Slack-Driven Investigation
Trigger: Slack message containing "investigate"
Prompt:
12345678910{{slack.user.handle}} asked to investigate something in {{slack.channel.name}}.Message: "{{slack.message.text}}"Parse the message for service names. For each service mentioned:1. Query error rate over the last hour2. Check for active check failures3. Look for latency spikesRespond in thread with your findings. If no issues found, confirm the service is healthy.
Scheduled Reporting
Trigger: Cron 0 9 * * MON-FRI (9am weekdays)
Prompt:
123456789101112Morning service health report for {{today}}.Query all services and identify the top 5 by error count in the last 24 hours.For each service include:- Service name- Total error count- Error rate percentage- p99 latency- Active check failures (if any)Format as a bulleted list and post to #daily-reports.
PR Review
Trigger: GitHub pull request opened
Prompt:
12345678910111213Pull request opened in {{github.repository}}.Review the PR for services that might be affected by the changes. For each identified service:1. Query error rate and latency over the last 7 days2. Check if there are any active alerts or check failures3. Note any historical performance issuesIf you find concerning patterns (error rate trending up, latency spikes, active alerts), post a comment with:- Which services are at risk- What the current health metrics show- Recommendations for extra testingIf all services are healthy, do not comment.
SLO Monitoring
Trigger: Schedule @hourly
Prompt:
1234567891011121314Hourly SLO compliance check for {{today}} at {{now}}.Query SLO burn rate for the payment service over the last hour. If the burn rate suggests we'll exhaust the error budget before the end of the rolling 28-day window, report the projected time to exhaustion and:1. Calculate remaining budget percentage2. Identify top contributing error types3. Check if recent deployments correlate with the increase4. Post an alert to #slo-alerts with:- Current burn rate- Projected budget exhaustion date- Top errors contributing to the burn- Recent deployment times (if any)If burn rate is within acceptable limits, take no action.
Common Pitfalls
Avoid these mistakes that lead to unexpected behavior.
Missing output destination:
If you don't say where to post results, Agent0 may only write a summary without taking action.
Solution: Always specify: "Post to #incidents", "Post summary to Slack".
Vague instructions:
Prompts like "check the service" give Agent0 too much freedom, leading to inconsistent results.
Solution: Be specific about metrics, time ranges, and output format.
Using variables from the wrong trigger:
Referencing {{slack.channel.name}} in a schedule-triggered automation shows literal {{...}} text.
Solution: Only use variables available for your trigger type, or branch on {{dash0.trigger.kind}}.
Assuming Agent0 has context it doesn't:
Agent0 doesn't remember previous runs or have implicit knowledge beyond what's in Dash0.
Solution: Include relevant context in the prompt: what the service does, why the check matters, expected behavior.
Best Practices
Follow these guidelines for reliable results:
- One task per prompt: Don't cram multiple unrelated tasks into one automation. Split complex workflows into separate automations.
- Test with manual runs: Click Run Now to test prompts before enabling. Manual runs let you verify the prompt works as expected.
- Start simple, iterate: Begin with a basic prompt and refine based on run results. Review past runs to see what Agent0 did.
- Use required tool calls: If your automation's value depends on posting to Slack or querying a metric, add that tool to Required Tool Calls in guardrails.
- Reference variables correctly: Double-check variable names. A typo like
{{slack.chanel.name}}leaves the placeholder unresolved. - Avoid prompt injection risks: Don't let untrusted input control critical parts. Use Tool Parameter Overrides in guardrails to pin channel IDs instead of relying on
{{slack.message.text}}.
Advanced Patterns
Advanced techniques enable more sophisticated automation behaviors.
Conditional Logic
Instruct Agent0 to make decisions based on query results:
1234567Query the error rate for the checkout service over the last hour.If the error rate is below 1%, take no action.If between 1% and 5%, post a warning to #alerts with the current rate and trend.If exceeds 5%, post an urgent alert to #incidents with priority "High" and tag the on-call team.
Multi-Step Workflows
Break complex tasks into numbered steps:
123451. Query the error rate for service {{label.service}} over the last 30 minutes.2. If errors exist, query the top 5 error messages with counts.3. Search logs for the most common error message to find stack traces.4. Summarize your findings: what's failing, how often, and the likely cause.5. Post your summary to #incidents with a recommendation for the on-call engineer.
Dynamic Service Lists
Use query results to drive subsequent actions:
12345678Query all services with error rate > 2% in the last hour.For each service:1. Get the top 3 error messages2. Check for active alerts3. Query recent deployments (last 24 hours)Compile a report listing each service with its error rate, top errors, active alerts, and recent deployments. Post to #health-check.
Handling Multiple Trigger Types
If your automation has different trigger types, handle each case:
123If this is a Slack message, respond in thread in #{{slack.channel.name}}.If this is a scheduled run, post the daily report to #daily-reports.
Alternatively, create separate automations for each trigger type to keep prompts simpler.
Further Reading
- Configure Triggers — Learn which variables are available for each trigger type
- Set Guardrails — Enforce required tool calls and pin parameters
- Configure General Settings — Set up constants and basic information
- Use Templates — Start with pre-built prompt examples