
Structured logging is the practice of emitting each log event as a set of typed key-value pairs, usually serialized as JSON, instead of as a line of free-form text. The reason it exists is mechanical: a plain-text log line encodes its data inside a human-readable sentence, so anything downstream has to parse that sentence back into fields with regular expressions before it can filter or aggregate. Structured logging skips the round trip by keeping the data as data from the moment it's written.
This article explains what structured logging changes at the data level, how it connects to the OpenTelemetry log data model, and the failure modes that tend to surface once a fleet of services is emitting structured logs. If you're looking for hands-on implementation across specific languages and frameworks, see our guide to structured logging for modern applications.
What changes when logs are structured
Here is a typical unstructured log line:
12026-07-14 14:54:55 INFO New report created by user 4253 in 342ms
It reads fine to a human, but the moment you want to answer "what's the p95 report-creation latency for user 4253 today?", you're stuck. The user ID, the duration, and the event type are all buried inside one string. Your log management backend has to apply a regex that knows this exact message layout. Change the wording, add a field, or introduce a second service that phrases it differently, and the regex breaks.
The same event as a structured log carries its fields explicitly:
12345678{"timestamp": "2026-07-14T14:54:55.162Z","level": "INFO","message": "report created","user_id": 4253,"report_id": 9981,"duration_ms": 342}
Now user_id is a field with an integer value, duration_ms is a number you can compare and average, and message is a stable label you can group by. No parsing rules, no regex maintenance, and no assumptions about word order.
On the application side, the change is small. Every major ecosystem has libraries that accept a message plus fields and handle serialization for you: structlog in Python, slog in Go (standard library since Go 1.21), pino in Node.js, Serilog in .NET, Logback with a JSON encoder in Java. You describe the event and attach fields; the library writes JSON and adds the timestamp and level.
Why the format change matters
Once logs are structured, searching and filtering stop depending on text matching. Instead of grepping for a substring and hoping the wording is consistent, you query user_id = 4253 AND duration_ms > 1000 and get exactly the slow requests for that user. Aggregation works the same way, so computing error rates or latency percentiles straight from your logs no longer means extracting numbers out of prose.
Correlation across services is the bigger win. If every service tags its logs with a shared request_id, or better, a trace ID, you can follow one request through a dozen services without guessing which lines belong together. That's the gap between debugging a distributed system methodically and reconstructing it by eye.
Automation also gets reliable inputs. Alerting rules, dashboards, and downstream pipelines key off specific fields instead of brittle text patterns, so a rule that fires on level = "ERROR" AND service = "checkout" keeps working even after someone rewords the message. These benefits compound once logs feed into a broader observability workflow alongside metrics and traces.
How OpenTelemetry standardizes structured logs
Structured logging solves the format problem within a single service, but it doesn't by itself standardize field names or connect logs to the rest of your telemetry. That's the gap the OpenTelemetry log data model fills. It defines a common shape for a log record so that logs from any language or library land in the same structure.
A few fields do the heavy lifting. Body holds the log message or payload. Attributes holds the structured key-value context you attach at the call site. Resource describes where the log came from, such as service.name and host.name, and is attached automatically rather than repeated in every call. SeverityText is the original level as the source wrote it (INFO, WARN), while SeverityNumber normalizes that level onto a numeric scale from 1 to 24, where INFO is 9 and ERROR is 17. The numeric field is what lets you compare and filter severity consistently even when one service says WARNING and another says WARN.
The two fields that unlock correlation are TraceId and SpanId. When a log record is emitted inside an active span, an OpenTelemetry-aware logging setup populates these automatically. Every log line produced during a request then carries the same trace context as the distributed trace for that request, so you can jump from an error log straight to the full trace that produced it, or from a slow span to the logs written while it ran.
OpenTelemetry also standardizes attribute names through its semantic conventions, which matters more than it first appears. Rather than each team inventing its own keys, the conventions define names like http.request.method and http.response.status_code for HTTP context. (These are the current stable names; older instrumentation used http.method and http.status_code, which are now deprecated.) Errors have their own shape too: a log record representing an exception is expected to carry exception.type, exception.message, and exception.stacktrace as attributes, so any backend can recognize and render it without custom parsing.
Common pitfalls
The failure modes of structured logging aren't obvious until you've run it across many services.
Inconsistent field names and types. If one service logs userId as a string and another logs user_id as an integer, cross-service queries silently miss data. Backends that infer a schema per field can reject the mismatched records outright. Elasticsearch, for instance, will refuse to index a document where duration arrives as the string "342ms" after it already mapped duration as a number, and those logs get dropped without warning. Agree on field names and types up front, ideally by adopting the OpenTelemetry semantic conventions rather than inventing your own vocabulary.
High-cardinality field explosion. Structured logs make it tempting to attach unbounded values, such as full URLs containing IDs or raw request bodies, as top-level indexed fields. Indexing those can inflate storage and query cost well beyond what the extra searchability is worth. Keep unbounded values in the body or in fields you don't index, and reserve indexed fields for the dimensions you actually filter and group by.
Mixed-format streams during migration. When half your log lines are JSON and half are plain text, a collector configured to parse JSON will mangle or discard the plain-text lines, and multi-line stack traces get split into separate malformed records. Pick one format per output stream and route legacy text logs through a parser that reconstructs them into the same structure. Our structured logging guide covers legacy log migration in detail.
Accidental sensitive data exposure. Structured fields make sensitive data easier to leak precisely because attaching context is so easy. An email or token dropped into a field is now indexed and queryable, which turns a stray log statement into a searchable data exposure. Redact or hash sensitive values before they reach the logger, and treat field additions with the same care you'd give any change that ships user data.
Final thoughts
Structured logging turns each log event into a record you can query by field, and once every service agrees on names, types, and trace context, those records connect to the traces and metrics around them. The OpenTelemetry log data model gives you that shared shape, and the semantic conventions give you the shared vocabulary. Watch for the field-type mismatches and mixed-format streams that quietly drop data, since those are what bite most teams after the migration looks done.
If you're ready to implement, our guide to structured logging walks through framework configuration and legacy log migration step by step, and the per-library guides for structlog, slog, Serilog, and Pino cover the specifics.
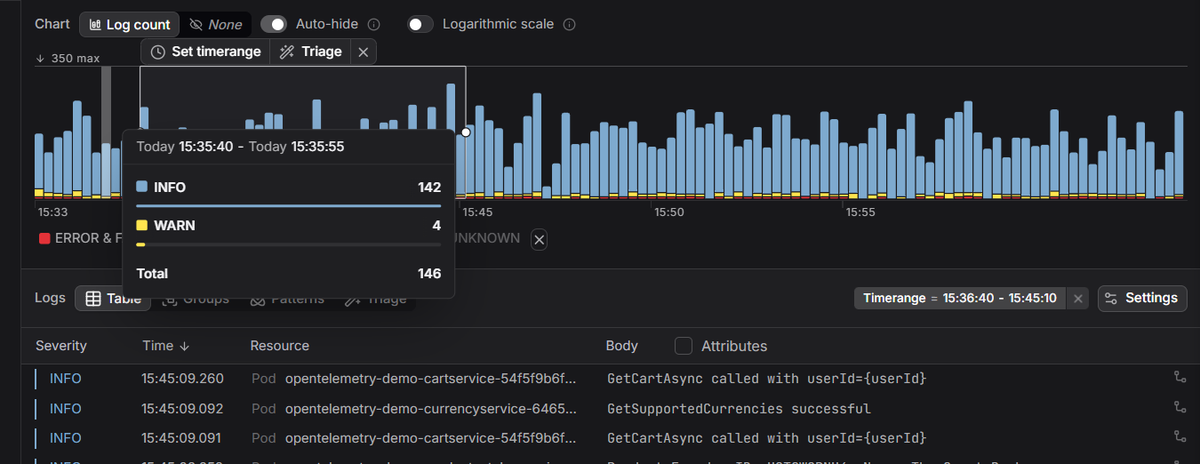
Dash0 is OpenTelemetry-native, so it ingests structured logs over the OpenTelemetry Protocol (OTLP) and links them to traces through the same trace context, with log management, distributed tracing, and metrics in one place. You can filter logs by any attribute, jump from an error straight to its trace, and spot field or severity inconsistencies across services from a single view.
 Start a free trial to see your logs, traces, and metrics correlated in one place. No credit card required.