
Last updated: October 1, 2026
Get Live Insights
Live Insights surfaces active problems in your environment before you need to look for them. The Agent0 landing page at app.dash0.com/agent0 surfaces what is actively going wrong in your environment, refreshed every 60 seconds, grouped per service.
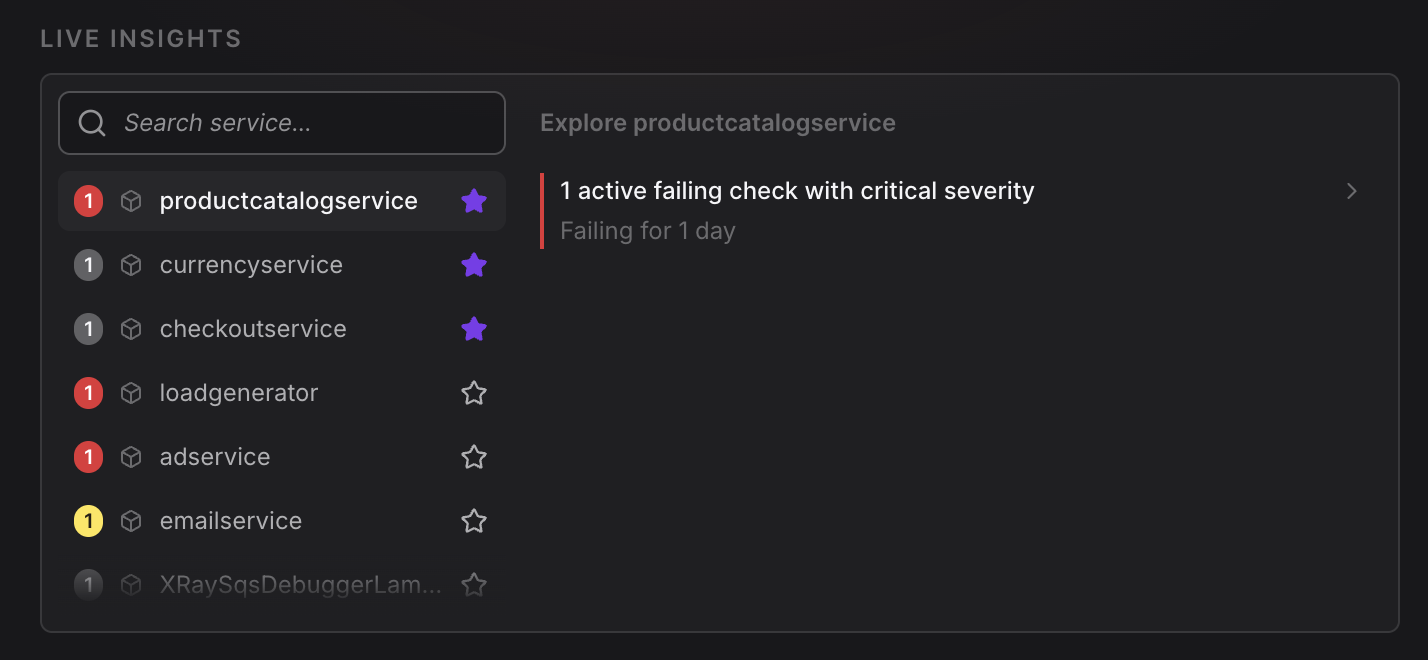
Each Live Insight entry includes the affected service, the signal that triggered it, a severity rating (critical / warning / info), and a template prompt for one-click investigation.
Signal Categories
Live Insights monitors and surfaces the following types of issues:
- Failing checks — Services with active failing checks, ordered by severity.
- Elevated error rates — Services whose error rate has spiked relative to their baseline.
- Elevated latency — Services whose p95 latency has spiked relative to their baseline.
- Pod saturation — Services with pods under memory or CPU pressure.
- Recent deployments — Services deployed in the last 30 minutes, with a comparison prompt to check for regressions.
- Slow database calls — Services with database operations that have gotten significantly slower.
- Services with issues but no alerts — Services with elevated errors or latency that have no active alert coverage, with a prompt to generate calibrated check rules.
Severity Bands
Severity is computed by comparing the current value to a 24-hour baseline:
- Critical — At least 5× the baseline ratio, or absolute thresholds breached.
- Warning — At least 2× the baseline ratio.
- Info — Below the warning threshold but worth surfacing.
The baseline is calculated over the previous 24 hours for each service. Services with insufficient historical data may not appear in Live Insights until enough baseline data is collected.
One-Click Investigation
Each Live Insight entry comes with a template prompt scoped to the identified issue. Click the prompt to start an investigation in Chat, where Agent0 will analyze the issue across logs, traces, metrics, and related signals.
How Live Insights Works
Live Insights continuously monitors your telemetry data and applies statistical analysis to detect anomalies. The system:
- Evaluates every 60 seconds — Fresh insights based on the latest telemetry.
- Groups by service — All issues for a service appear together for easier triage.
- Prioritizes by severity — Critical issues appear first, followed by warnings and info-level insights.
- Provides context — Each insight includes the specific metric, threshold, and current value.
If a service doesn't appear in Live Insights, it may be because no telemetry is being received, no signals are above the severity thresholds, or the service has very low volume where individual incidents don't exceed the baseline ratio. See Live Insights Not Showing Services for troubleshooting.
Further Reading
- About Chat — Overview of Agent0 Chat features
- Investigation & Analysis — Perform multi-signal root cause analysis