
Last updated: August 18, 2026
Measure Productivity
The Productivity tab connects spend to engineering output. It is where the question "is this actually making us faster?" gets a data point.
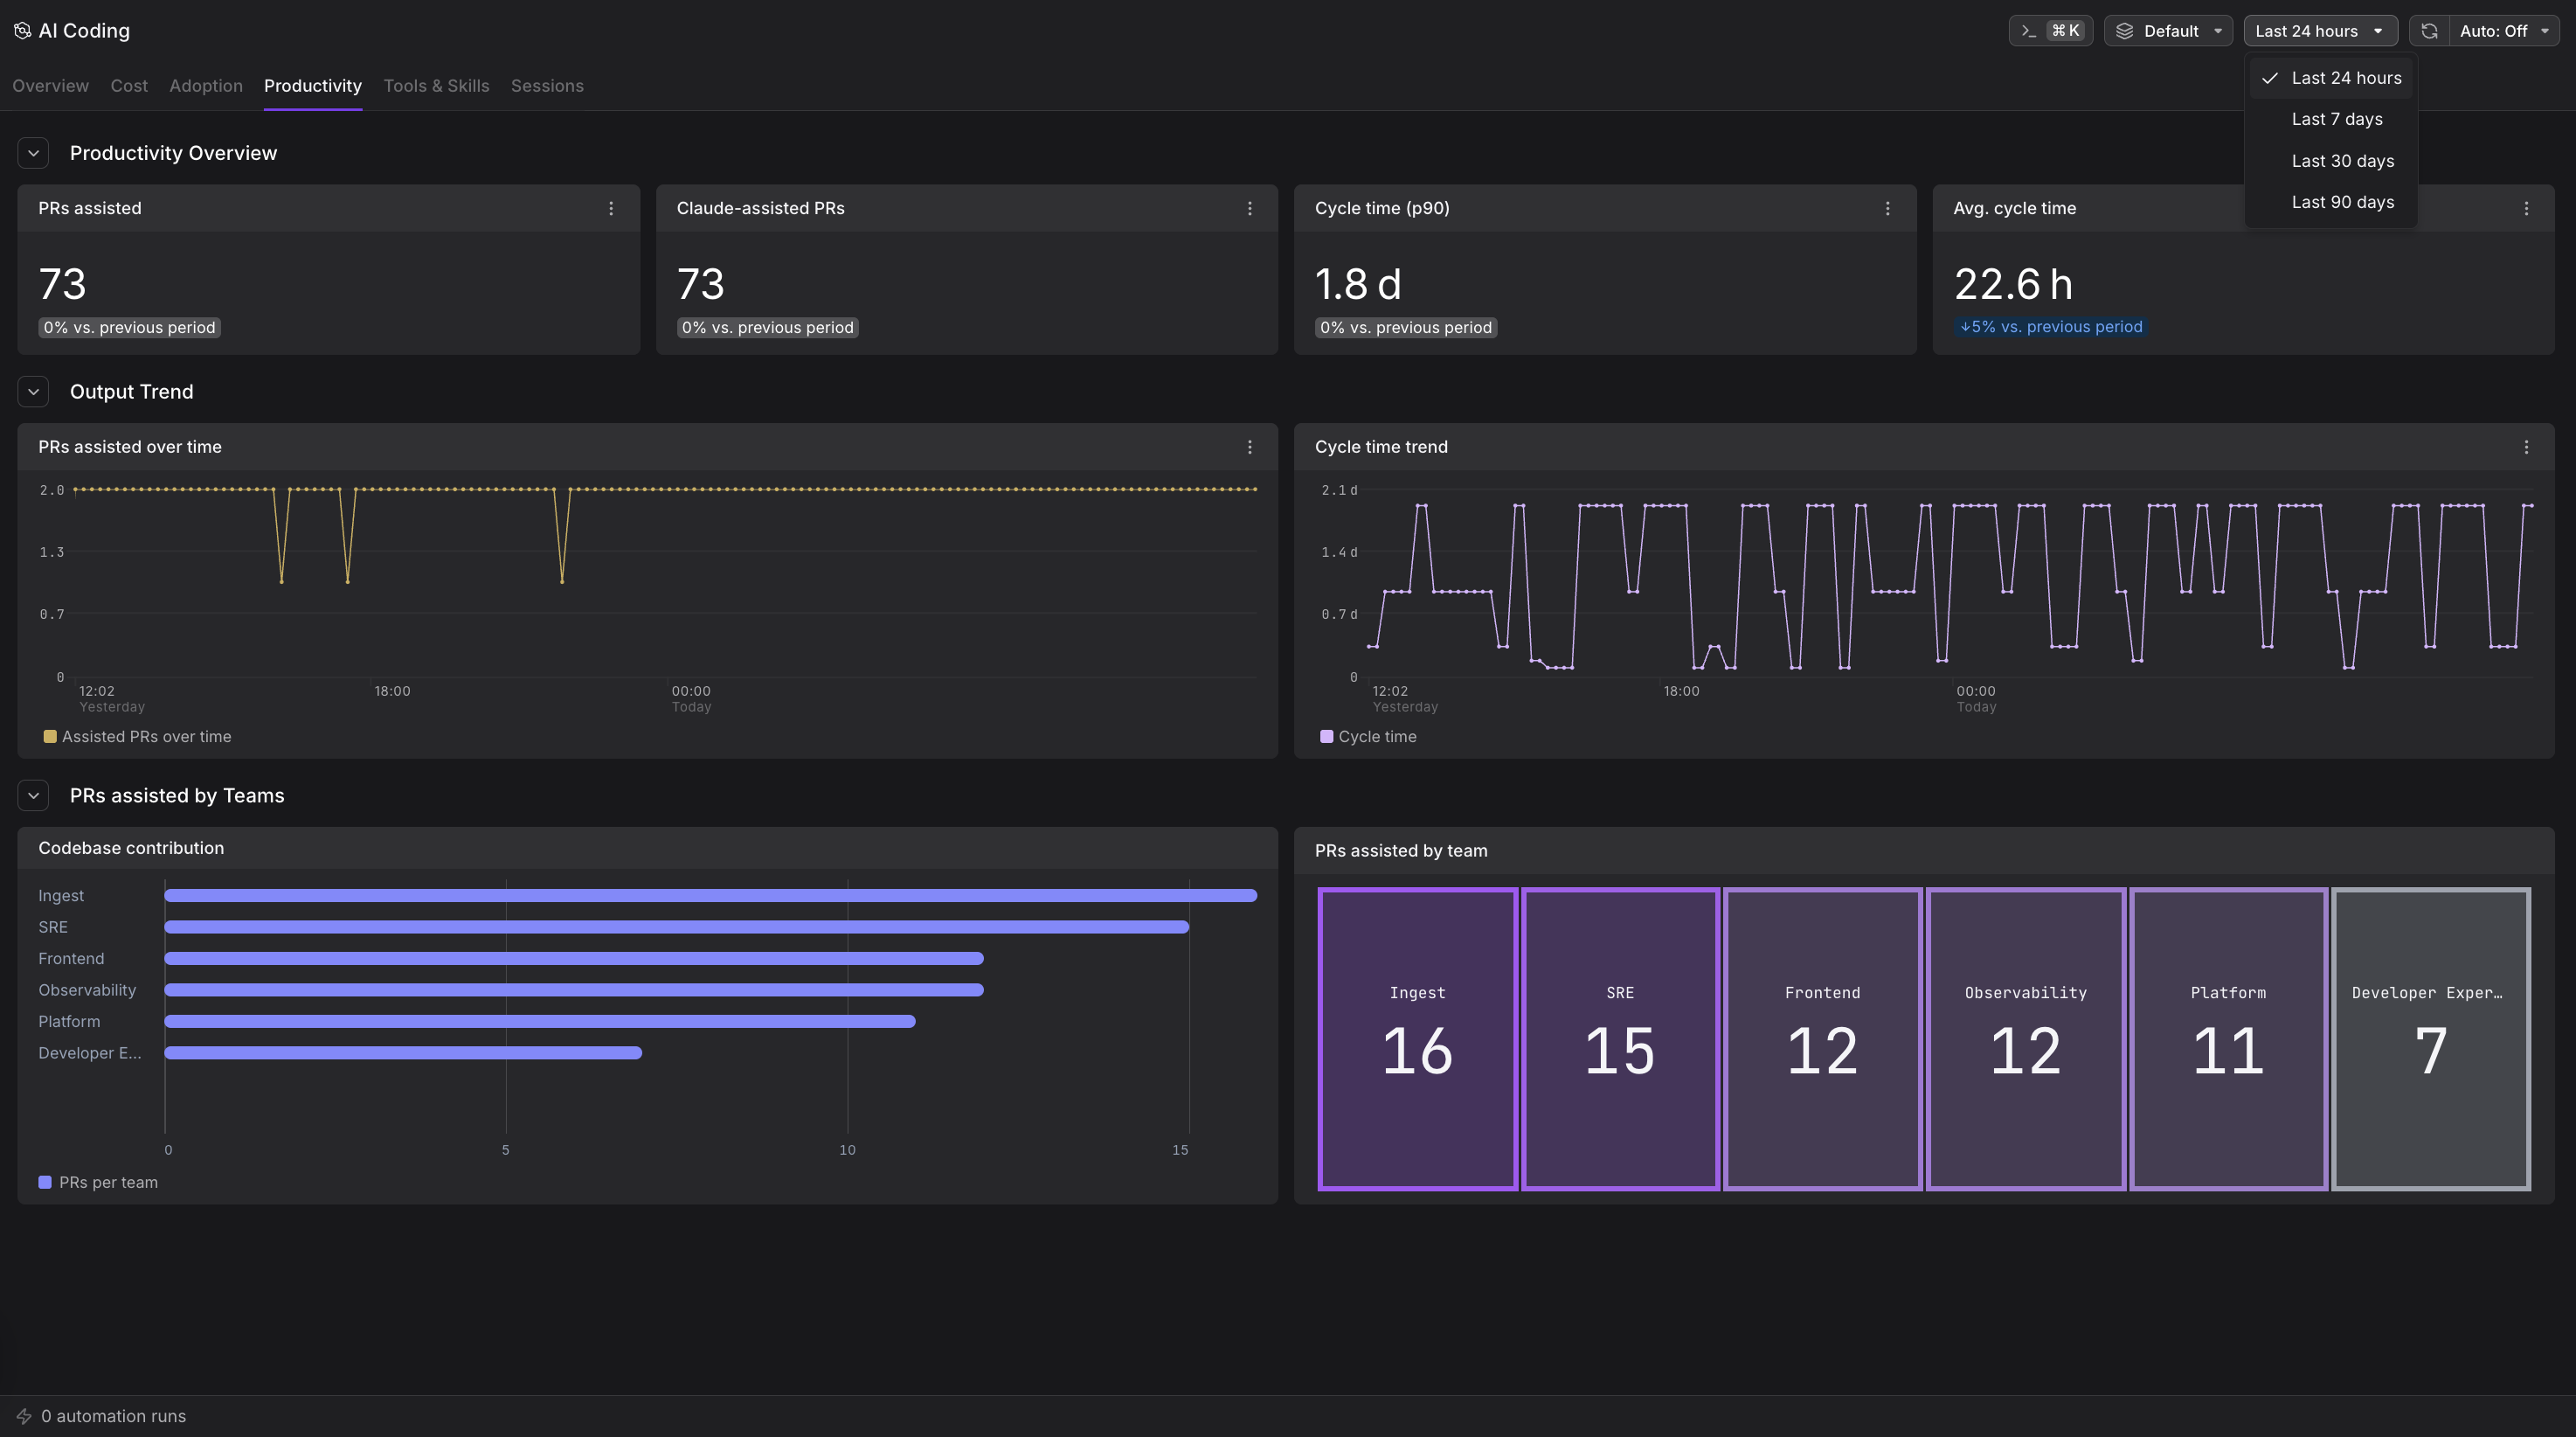
What Measure Productivity Shows
- Productivity overview: PRs assisted, Claude-assisted PRs, cycle time (p90), and average cycle time, each against the previous period.
- Output trend: PRs assisted per interval and the cycle time trend.
- Codebase contribution: Assisted pull requests per team.
- PRs assisted by team: Contribution sized by team.
To compare models on throughput per dollar, read the cycle time here against Top models by cost on the Cost tab: a model that takes more prompts but costs far less per token, and reaches the same cycle time, is the better economic choice, while one that is cheaper per token but doubles cycle time is not.
The Productivity pillar depends on the GitHub integration that links agent sessions to branch and pull-request lifecycle events. Until GitHub is connected and enough merged pull requests are attributed, this tab shows a prompt to connect, and cycle time can read as zero or an outlier value.
How to Use Measure Productivity
Measure the payoff. Cycle time from session to merged PR is the metric that closes the loop on AI coding spend. If cycle time improves while PR volume stays constant or increases, the investment is paying off. If cycle time stays flat or worsens, dig into whether sessions are producing useful code or churning without progress.
Compare models on velocity, not just cost. A frontier model that costs more per token may deliver faster cycle times. A cheaper model that takes more prompts and extends cycle time is not actually cheaper. Read cost on the Cost tab alongside cycle time here to understand throughput per dollar.
See which teams ship faster. The PRs assisted by team breakdown shows which parts of your organization are using AI coding to move work forward. Teams with high PR counts and low cycle times have found effective patterns. Teams with low output may need training or different workflows.
Track trends over time. The cycle time trend shows whether your organization is getting faster at shipping AI-assisted work. Improving trends indicate that developers are learning to work effectively with agents. Flat or worsening trends suggest that adoption is not translating to velocity gains.
Further Reading
- Track Cost: See what you spend on AI coding and which models cost most.
- Track Adoption: Understand who uses AI coding and how broadly it has spread.
- Explore Sessions: Drill into individual sessions to understand what ships and what stalls.