
Last updated: August 18, 2026
Explore Sessions
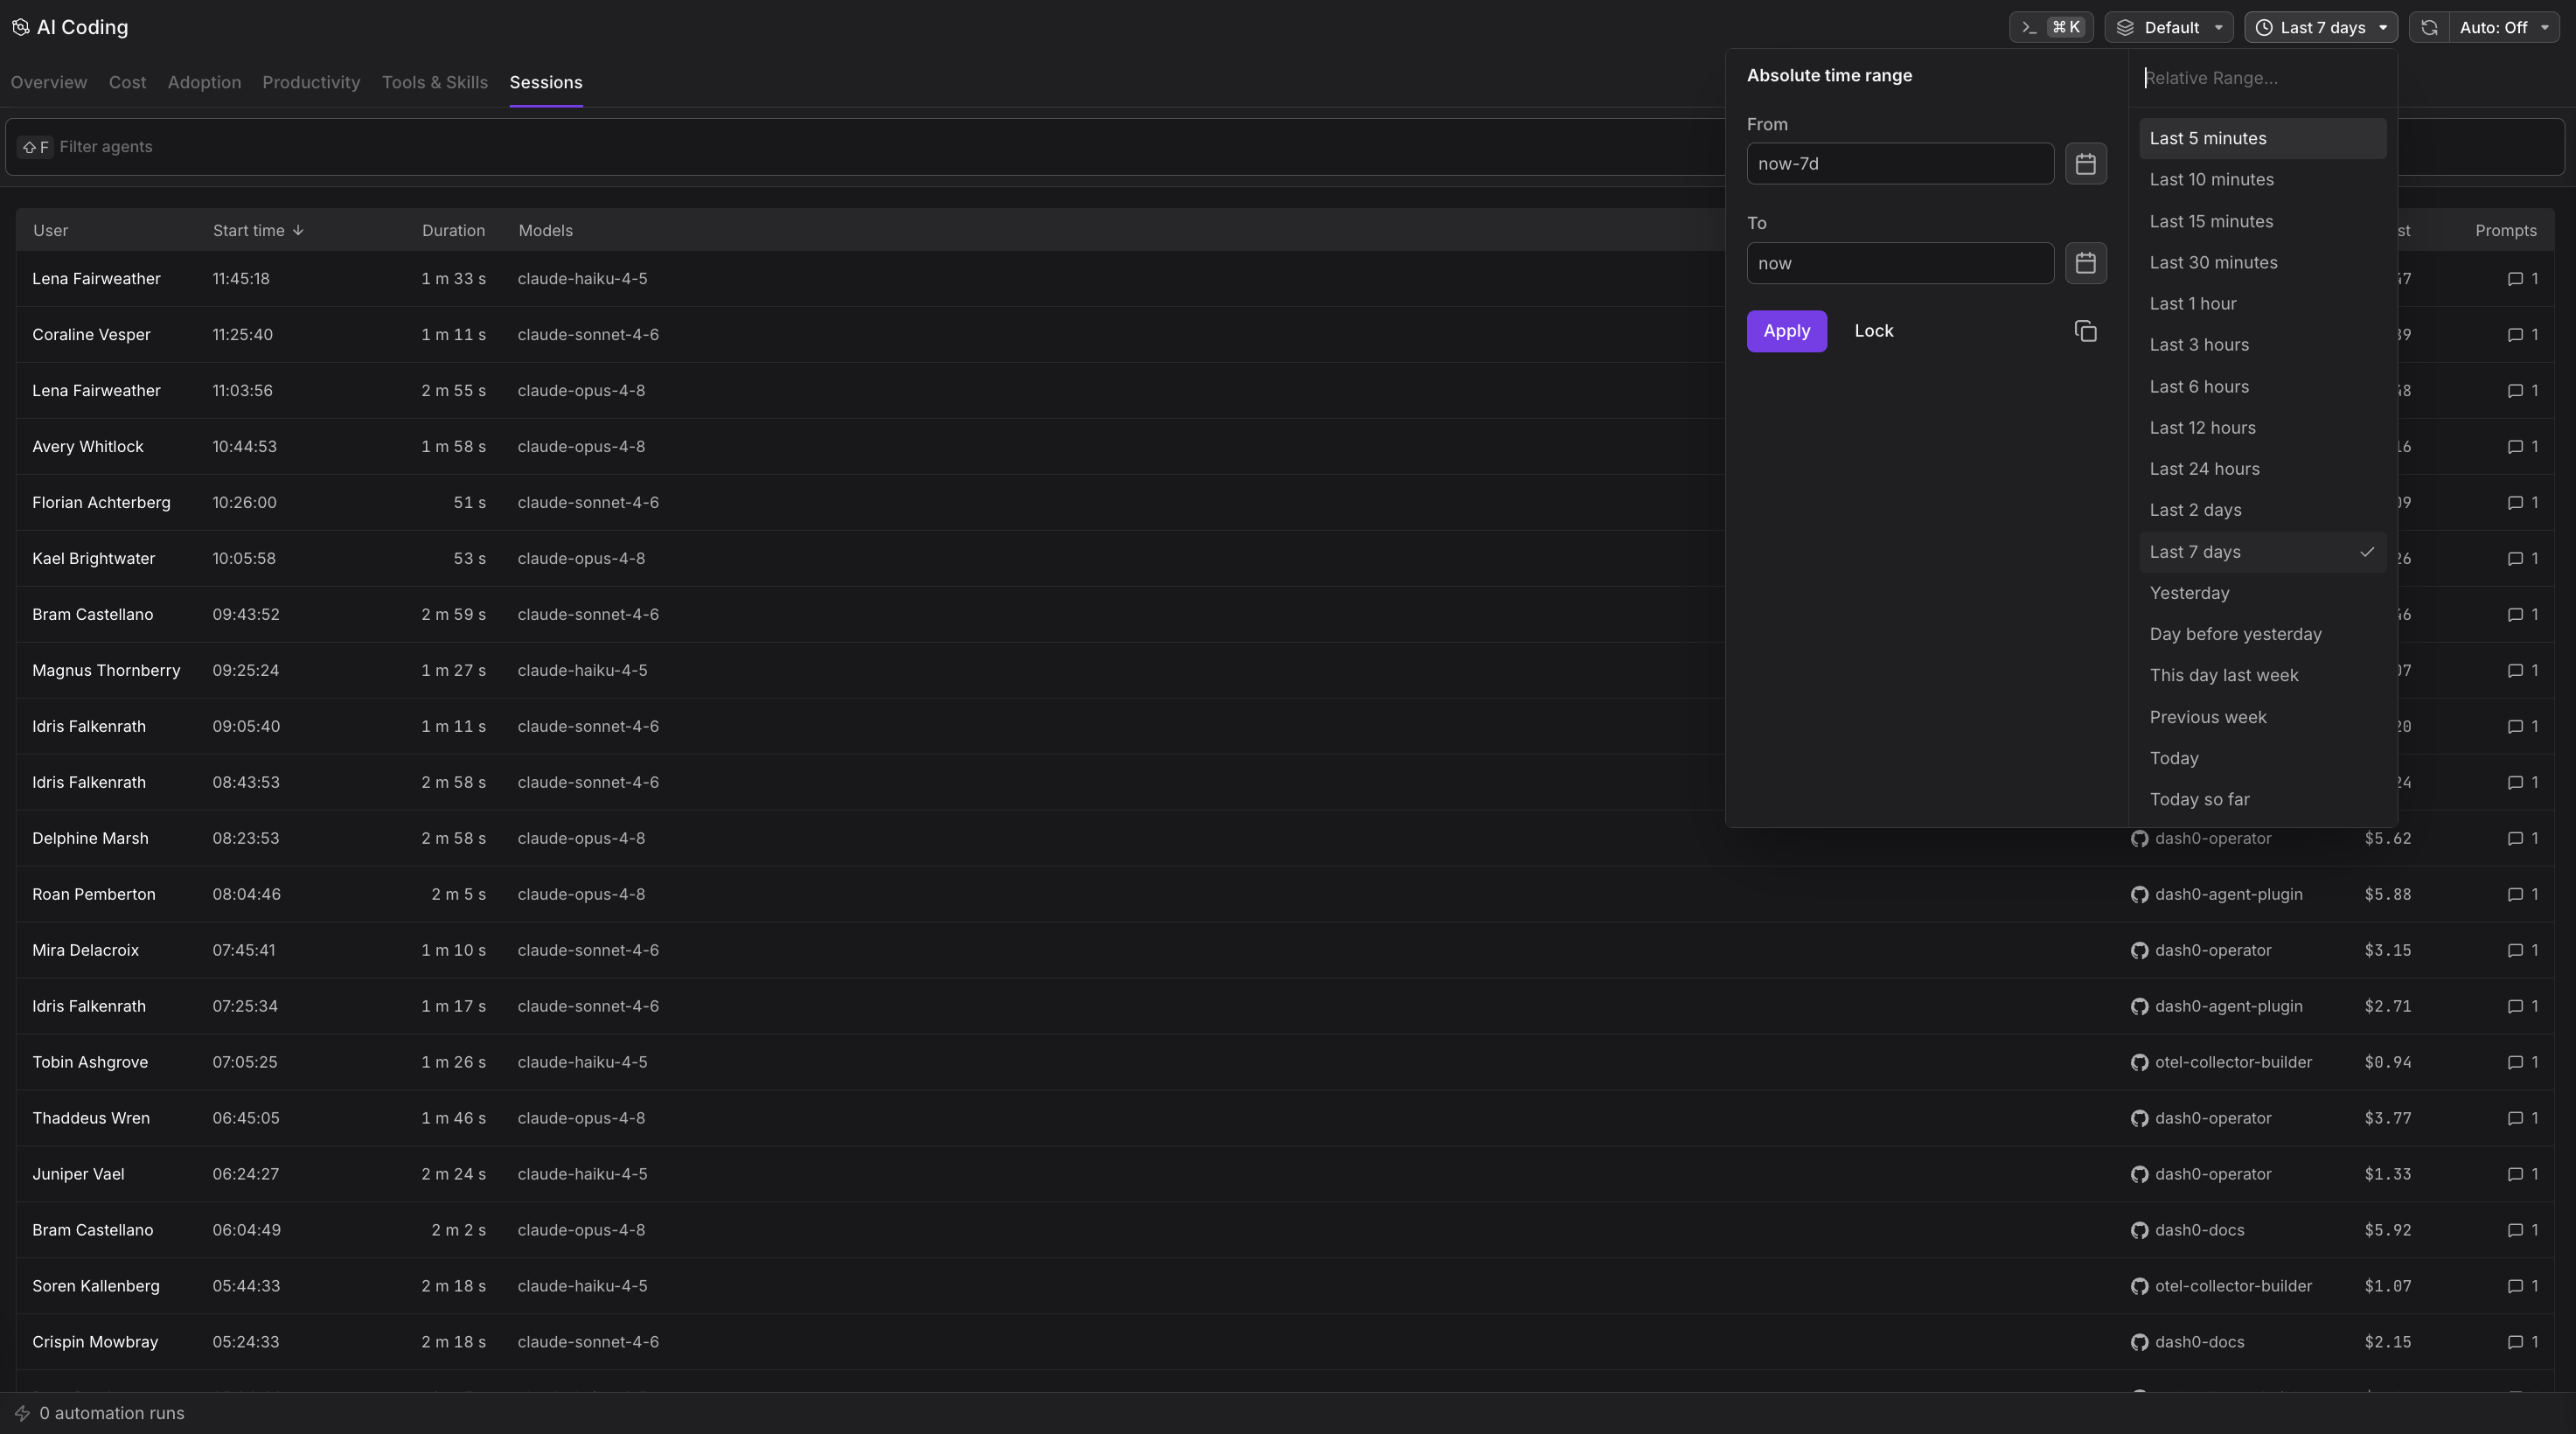
The Sessions tab lists individual agent runs. Each row shows the user, repository, start time, duration, the models used, cost, and prompt count.
What Explore Sessions Shows
The sessions list displays every AI coding session with sortable columns:
- User: The developer who ran the session
- Repository: The codebase worked on
- Start time: When the session began
- Duration: How long the session ran
- Models: Which AI models were used
- Cost: Token spend for the session
- Prompt count: Number of user prompts
Ongoing sessions are marked as such. Use the filter box to narrow the list, sort by any column to surface the most expensive or longest-running sessions, and click a row to open its detail panel.
Session Detail Panel
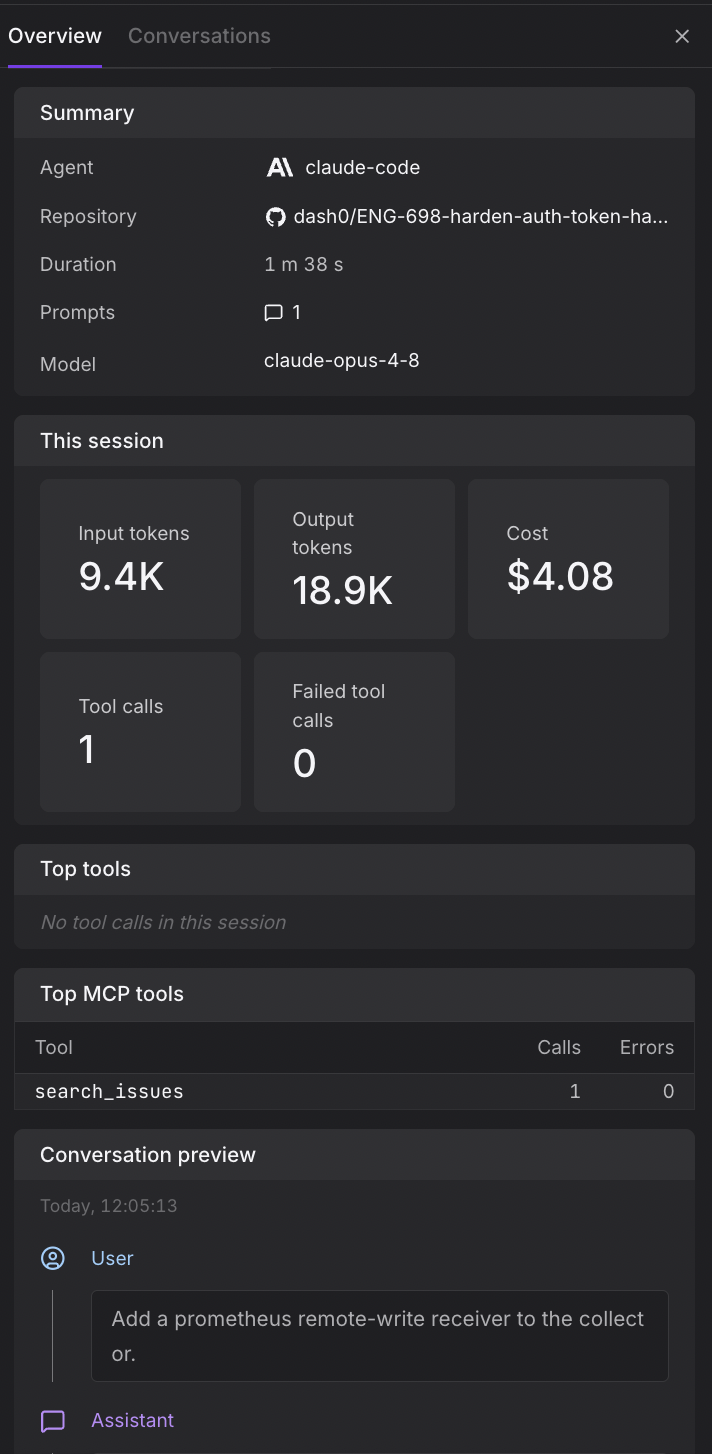
The detail panel breaks a single session down into:
- Summary: The agent, repository, total duration, prompt count, and model. The agent field names the agent or subagent that ran, for example
Explore. - This session: Input and output tokens, cost, total tool calls, and failed tool calls.
- Top tools and Top MCP tools: The tools called most in the session, with their call and error counts.
- Conversation preview: The user prompts and agent responses, including the tools and subagent runs invoked along the way. Open the full conversation to read the complete exchange.
This is where you go to understand a single number from another tab, for example why one session was unusually expensive or why a user's tool calls failed.
How to Use Explore Sessions
Find expensive sessions. Sort by cost to surface the sessions that consumed the most tokens. High-cost sessions may indicate complex work, inefficient prompting, or runaway tool calls. Drill into the detail panel to see where tokens were spent.
Investigate failed tool calls. The detail panel shows failed tool calls. Common causes include permission errors, missing files, or misconfigured MCP servers. Use this to identify patterns and fix the underlying issues.
Learn from power users. Filter by user to see sessions from developers who use AI coding most effectively. Review their conversation flow and tool usage to identify patterns worth spreading.
Track session duration. Long sessions may indicate deep work or inefficient iteration. Compare duration against cost and prompt count to understand whether the session was productive or spinning.
Further Reading
- Track Cost: See aggregate spend across all sessions.
- Analyze Tools & Skills: Understand which tools are called across sessions.
- Troubleshoot AI Coding Insights: Solutions for session and telemetry issues.