Simply "replacing CloudWatch" does have some caveats we should clear upfront. For a start, CloudWatch is not one product. It is a bundle of roughly a dozen services sharing a console, and each is a separate migration decision. Teams that frame the move as "replace CloudWatch" usually discover halfway through that they cannot. AWS service metrics for EC2, RDS, ELB, Lambda, and seventy-odd others are vended into CloudWatch by the platform itself. You can copy them out, but you cannot make them originate somewhere else. Whatever you pick, CloudWatch stays in the picture as the source of truth for AWS resource health, and your new tool is a consumer of it.
That shapes the economics in a way vendor pricing pages skip. Getting AWS metrics into a third-party platform means either API polling, which adds GetMetricData charges and roughly ten minutes of latency, or a CloudWatch metric stream into Amazon Data Firehose, which bills per metric update plus Firehose ingestion plus data transfer out. Logs travel the same route, through a subscription filter. Your third-party bill is never your whole bill. There is an AWS-side tax on the pipe, and it scales with how much you move.
The query model is the second underestimated cost. CloudWatch now has two metric stores with two query languages: classic metrics with Metrics Insights, and OTel metrics with PromQL. Logs use Logs Insights QL, with OpenSearch PPL (Piped Processing Language) and SQL as alternatives. Traces live in X-Ray with its own filter syntax. Consolidating onto a third-party platform can reduce that count or quietly increase it, depending on whether the platform stores each signal in a separate backend behind a shared dashboard layer.
Then there is the class of failure CloudWatch cannot see at all. When a Lambda function times out or exhausts its memory, the runtime kills the process before any trace is emitted. CloudWatch logs the failure and that is usually all you get: no duration, no trigger source, no context. Teams running event-driven architectures on SQS, SNS, EventBridge, and Kinesis hit a related wall, where a message crossing a broker looks like two unrelated traces unless something propagates context across the hop. If most of your incidents live in that gap, better dashboards will not help.
Finally, portability. OpenTelemetry solves the instrumentation half honestly: point your OTLP exporter elsewhere and your application code does not change. It does not solve dashboards, alert rules, saved queries, role-based access control (RBAC), retention policy, ingest pipelines, or the investigation habits your team has built. Every platform below creates switching cost, including the OTel-native ones. The honest question is how much, and in which layer.
This article will cover some of the options out there. We'll evaluate each tool against these criteria:
- AWS-native discovery: what you see about your AWS estate before instrumenting anything
- Ingest path: how AWS telemetry reaches the tool, and what AWS charges for the pipe
- Signal coverage: metrics, logs, traces, real-user monitoring, synthetics, profiling
- Query model: how many query languages your team has to hold in their heads
- Cardinality behavior: what happens to cost and performance when you add labels
- Cost model: which dimensions the bill meters, and what each one incentivizes
- Portability: what survives if you leave, and what you rebuild from scratch
Cardinality and portability resist compression into table cells, so the table covers the first five and the entries handle all seven.
At a glance
The numbering groups tools by approach, commercial platforms first, then self-hosted. It is not a ranking.
| Tool | AWS discovery | Ingest path | Signals | Query language | Cost model |
|---|---|---|---|---|---|
| Datadog | 900+ integrations, tag inheritance | API polling or metric streams via Firehose | Metrics, logs, traces, RUM, synthetics, profiling, security | Proprietary query builder and DQL (Datadog Query Language) | Per host, per GB, per million indexed events, per custom metric |
| Dash0 | CloudFormation account integration, Lambda catalog | OTLP native; CloudWatch metrics and logs via Firehose | Metrics, logs, traces, web events, synthetics, profiling | PromQL across all signals | Per million signals; no per-seat or per-host observability fee |
| New Relic | AWS integration via polling or metric streams | Polling, metric streams, OTLP | Metrics, logs, traces, RUM, synthetics, profiling | NRQL | Per GB ingested, plus per full-platform user seat |
| Grafana Cloud | CloudWatch data source and AWS integrations | Alloy agent, remote write, OTLP | Metrics, logs, traces, profiles, RUM, k6 | PromQL, LogQL, TraceQL | Per 1,000 active series, per GB per signal, per user, plus platform fee |
| Honeycomb | None for AWS resources; CloudWatch integration for logs | OTLP; Refinery for sampling | Events and traces, plus time-series metrics | Honeycomb query builder | Per million events and per million metric data points, tiered |
| Self-hosted Prometheus, Grafana, Jaeger, OpenSearch | CloudWatch exporter | Remote write, OTLP, exporters | Metrics, logs, traces | PromQL, LogQL or Lucene, Jaeger search | Infrastructure plus engineering time; no license |
1. Datadog
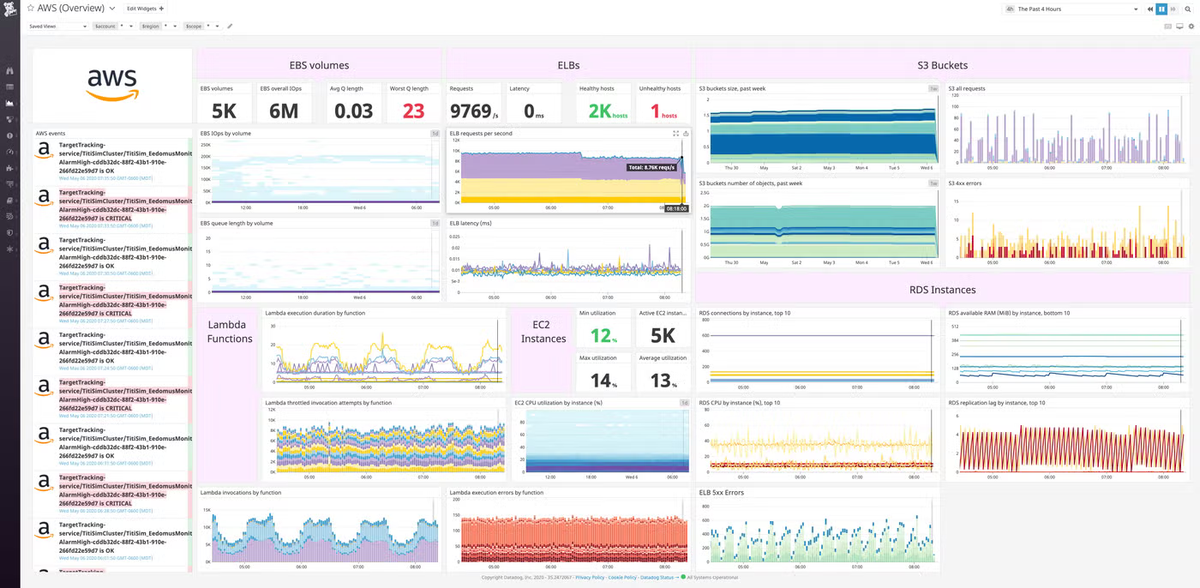
Datadog is the default answer when a team decides CloudWatch is not powerful enough rather than too expensive. Its AWS integration is the most comprehensive here: 900-plus integrations, automatic tag inheritance from AWS resources, deep ECS, EKS, and Lambda coverage, and ingestion through either API polling or a CloudWatch metric stream. The product surface extends past observability into security, CI (continuous integration) visibility, database monitoring, and network performance.
What's good
- Breadth nothing else here matches. If a technology exists in your stack, there is a Datadog integration with a maintained dashboard and default monitors. For teams whose real problem is that nobody has time to build observability, that pre-built coverage is worth money.
- Metric streams cut AWS latency meaningfully. Datadog supports OpenTelemetry 1.0 output from CloudWatch metric streams, dropping AWS metric latency from roughly ten minutes to two or three with no additional Datadog charge. Datadog is explicit that this shifts cost onto your CloudWatch and Firehose bills.
- Mature Lambda and container tooling. The Lambda extension, container monitoring, and service maps are well-trodden paths with a large body of community knowledge behind them, which matters at 2am when you need someone who hit the same thing.
The catch
The architecture is proprietary at the storage and query layer. Datadog accepts OpenTelemetry data and is OTel-compatible, but not OTel-native: telemetry is translated into Datadog's internal model on ingest, and dashboards, monitors, notebooks, and saved queries are expressed in Datadog's own languages. Your instrumentation stays portable if you used OTel to produce it. Nothing else does. There is also a structural tension worth naming plainly, in that Datadog's revenue scales with the volume you send and index, so the vendor has no commercial reason to help you send less.
The billing mechanics produce specific surprises. Host counting is hourly on a high-water-mark basis: Datadog meters hosts each hour, drops the top 1%, and bills the month at the peak of the remaining 99%, so a five-day autoscaling spike sets your bill for the full month. In Kubernetes the billing unit is the node, and an agent misconfigured as a sidecar rather than a DaemonSet can count every pod as a host. APM cannot be bought alone, since every APM host also requires a Pro or Enterprise infrastructure license.
Pricing model
Infrastructure Monitoring is billed per host per month, cheaper on an annual commitment than on demand, with Enterprise priced above Pro. APM is billed per host annual, layered on top of that infrastructure license. Logs bill twice, a per-GB charge to ingest then a per-million-events charge to index at 15-day retention, with longer retention multiplying the index cost. Custom metrics are allotted per host, 100 on Pro and 200 on Enterprise, and every Prometheus or OpenTelemetry series counts against that. Each APM host includes 150 GB of ingested spans and 1 million indexed spans, then bills per million beyond it.
The interaction that matters for AWS teams is between per-host pricing and cloud-native architecture. Per-host billing penalizes horizontal scaling and container churn, the exact deployment pattern AWS spends its marketing budget encouraging. The custom metrics allotment penalizes Kubernetes labels specifically, because label combinations become series and series become custom metrics. The ingest-then-index split pushes you to index less, which means the logs you need during an incident may be the ones you chose not to make searchable. Annual commitments run well below on-demand rates, so the model rewards accurate capacity forecasting in an environment designed to be elastic.
The verdict
Choose Datadog when integration breadth is the constraint and budget is not, when you want security monitoring and CI visibility from one vendor, or when your team is small enough that pre-built dashboards genuinely substitute for platform engineering. Go in with ingestion controls, exclusion filters, and span sampling configured from day one rather than after the first overage. Look elsewhere if your infrastructure is highly elastic, if your metrics carry rich Kubernetes labels, or if you need the option to leave without rebuilding every dashboard and alert. Teams evaluating that exit path can see the mechanics of one such migration in Migrating from Datadog to OpenTelemetry and Dash0.
2. Dash0
Dash0 is an OpenTelemetry-native observability platform. It ingests OTLP without converting telemetry into a proprietary format, queries every signal with PromQL, and stores dashboards in Perses, a CNCF standard. For AWS specifically, it absorbed Lumigo's serverless instrumentation through an acquisition in February 2026, and added continuous profiling by acquiring Polar Signals in August 2026.
What's good
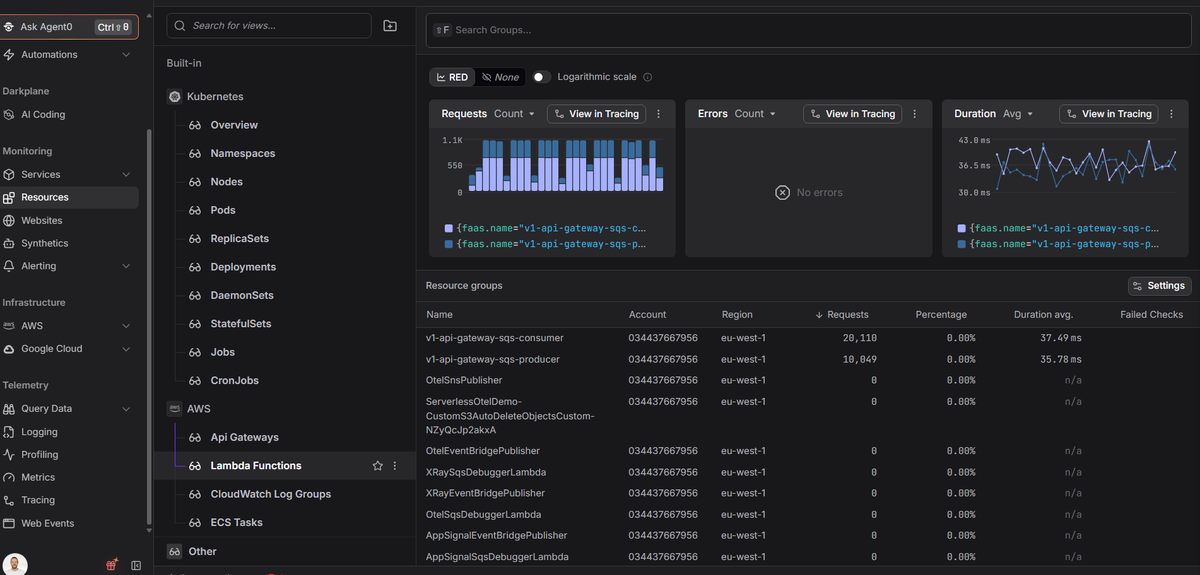
- AWS account integration before any instrumentation. Setup runs through CloudFormation in under five minutes with no credentials stored on Dash0's side. Every Lambda function across every region appears with invocation counts, error rates, duration, and cold starts pulled from CloudWatch.
- Visibility into invocations that never finish. The Lambda extension uses the Lambda Telemetry API to detect timeouts and out-of-memory kills and generate a synthetic trace with duration, trigger source, and context. Trace context propagates across SQS, SNS, EventBridge, and Kinesis, so a publish-and-trigger pair renders as one connected trace carrying event source and batch record count.
- PromQL across metrics, logs, and traces. One query language instead of four, with Prometheus alert rules importable and Alertmanager forwarding supported. Synthetic metrics derive counts and percentiles from raw spans and logs on demand, unbilled.
The catch
Runtime coverage has some gaps. The Kubernetes operator auto-instruments Java, Node.js, .NET, Python, and Ruby, with Python and Ruby opt-in via Helm, and the Lambda extension covers Python, Node.js, and Java. Go gets neither, and because Go binaries are typically libc-free, even the operator's Kubernetes resource attribute auto-detection does not apply. So a Go-heavy estate means wiring up OpenTelemetry SDKs.
Payload capture deserves scrutiny before you enable it. The extension captures the full triggering event plus request parameters and response bodies for downstream AWS calls. Sensitive values are masked by default with configurable rules per payload type, which is the right default, but rule-based redaction misses creatively named fields. Dash0 is SOC 2 Type II certified with a published trust center and no self-hosted option yet, so residency rules forbidding third-party storage of payloads are blocking rather than configurable.
Pricing model
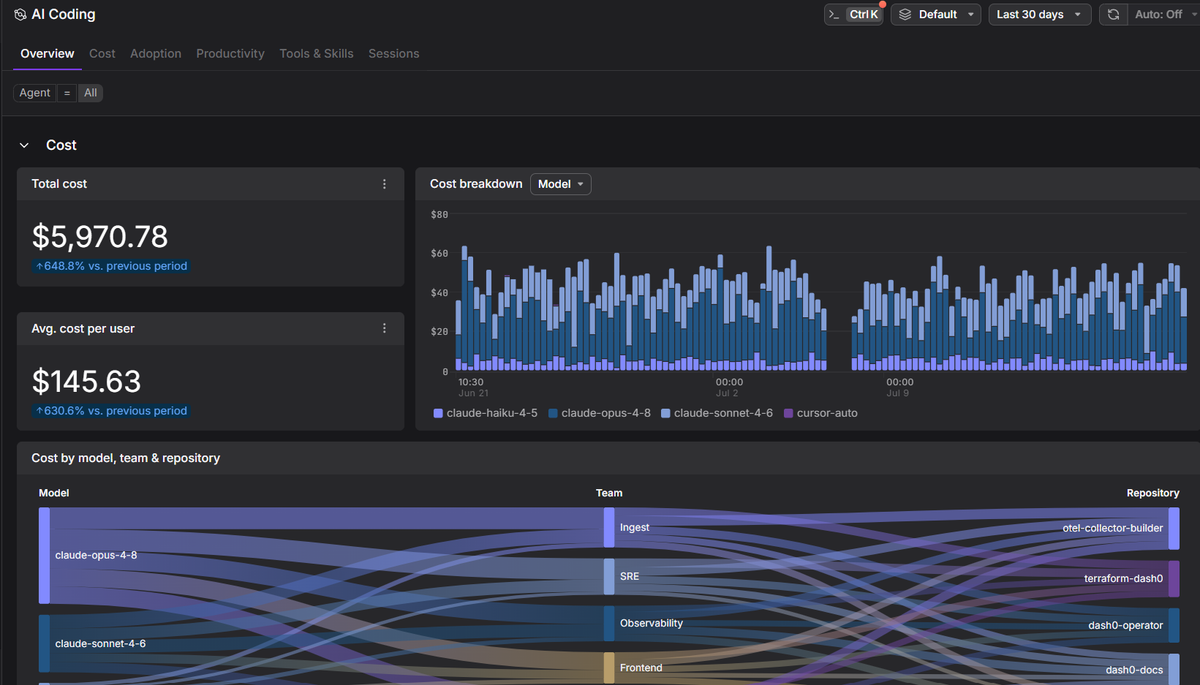
Published rates bill per million metric data points with 13-month retention, per million spans, span events, log records, or web events with 30-day retention (extensions negotiable), and per thousand synthetic API check runs. There is no per-seat charge, no per-host charge, and no base platform fee for observability. Agent0 is billed on task-based credits, and AI Coding Insights is priced per user, so one adjacent product does carry a seat fee even though the core platform does not.
Counting signals rather than bytes changes what the model rewards. A verbose error log with a full stack trace costs the same as a one-line health check, and adding a resource attribute creates no new billing dimension, so the Kubernetes and Lambda context attributes that make resource-scoped investigation possible are not a cost decision. What it does charge for is frequency and chattiness: high-cardinality metrics scraped every 15 seconds generate billions of data points fast, and spans and logs cost triple the metric rate, so trace-heavy architectures should model span volume specifically. Cost controls are budget caps, spam filters, and a cost forecast, with usage attributable by service, team, or cluster. Dash0 is on AWS Marketplace and can count against committed AWS spend.
The verdict
Dash0 fits AWS teams standardizing on OpenTelemetry who want per-signal pricing without seat or host meters, and who run Lambda or event-driven architecture where the failures CloudWatch cannot see are the ones costing them sleep. It is the wrong choice if you run mostly Go, need self-hosting, or want incident management in the same product. If you feel like testing it yourself, Sign up for a free Dash0 account with 14 days of unlimited access.
3. New Relic
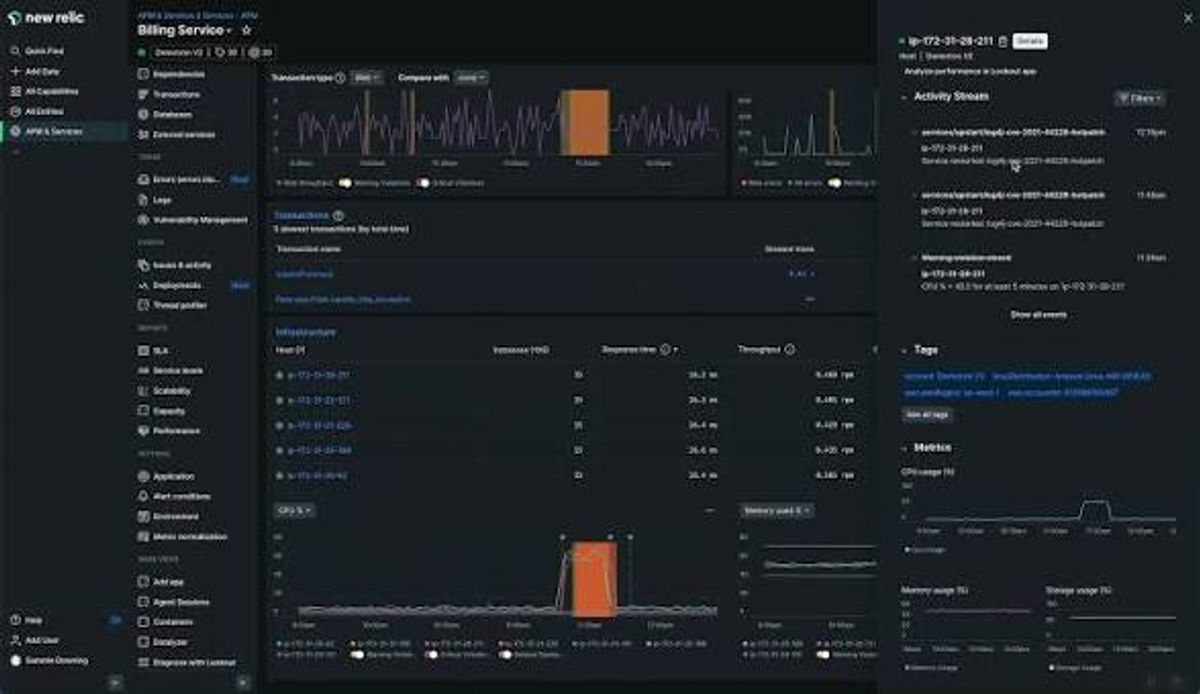
New Relic rebuilt its pricing in 2020 around two numbers, data ingested and users with full access, and that structure still distinguishes it. The platform covers APM, infrastructure, logs, distributed tracing, browser and mobile RUM, synthetics, and vulnerability management, all landing in one database queried with NRQL. Its AWS integration supports both polling and CloudWatch metric streams, and it accepts OTLP.
What's good
- One store, one query language. Every signal lands in NRDB and NRQL queries all of it, so pivoting from an alert to an APM trace to the surrounding log lines happens without changing languages or leaving the query bar. For teams tired of holding four syntaxes in their heads, that is the strongest argument here.
- Elastic infrastructure does not multiply the bill. Because pricing meters data rather than hosts, a cluster autoscaling from 50 to 500 pods costs only what those pods emit. Against per-host models, that is a materially better fit for the patterns AWS pushes.
- The free tier is unusually generous. 100 GB of ingest per month plus one full-platform user and unlimited basic users, permanently, with no credit card. For evaluating against real production telemetry rather than a demo app, nothing else here makes that as easy.
The catch
The seat model is where teams get hurt, structurally rather than incidentally. Full-platform access is required for APM, infrastructure, and synthetics, so the engineers who most need the platform carry the highest per-user rate. Standard caps at five full-platform users, and the sixth engineer forces a move to Pro, where the same seat count costs several times more than it did on Standard, the sharpest cliff in the pricing structure. Organizations end up rationing access to their observability platform, and rationing access during a multi-engineer incident is the wrong constraint to have.
Per-GB metering also penalizes byte-heavy telemetry directly. A verbose microservice can generate 150 to 300 GB per month alone, and the default agent configuration forwards everything unless you filter it, so richly attributed OpenTelemetry spans cost more than sparse ones. Retention is eight days by default on Standard, and 30, 60, or 90-day retention requires Data Plus at a premium on every gigabyte. Advanced Compute adds a third meter billed per compute capacity unit, and at least one publicly reported case involved enabling JVM-level telemetry and seeing a much larger bill than expected from unanticipated custom event charges.
Pricing model
Two axes: data ingest and user seats. Ingest bills per GB above a 100 GB monthly free allowance, at a higher per-GB rate on Data Plus than on the Original Data option, so confirm current rates directly. Full-platform users are priced per seat up to five on Standard, or per user annually on Pro with no cap. Core users are priced separately and basic users are free and unlimited.
Which axis dominates depends on your shape. A data-heavy, people-light team does well; a large engineering organization with moderate telemetry pays mostly for seats. The seat line is the more predictable of the two, which makes the data axis the usual source of overruns. Because the meter is bytes, the model incentivizes reducing log verbosity and trimming attributes rather than reducing signal count, and it makes the marginal cost of giving another engineer full access high enough to deliberate over.
The verdict
New Relic makes sense for teams with high host churn and moderate data volume, teams that want one query language across every signal, and anyone who wants to evaluate seriously on a free tier before committing. It is also the reasonable pick if NRQL's SQL-like shape suits your team better than PromQL. Avoid it if your engineering organization is large enough that seat licensing dominates the bill, if your log volume is heavy, or if you need everyone on call to have full platform access without a per-head calculation.
4. Grafana Cloud
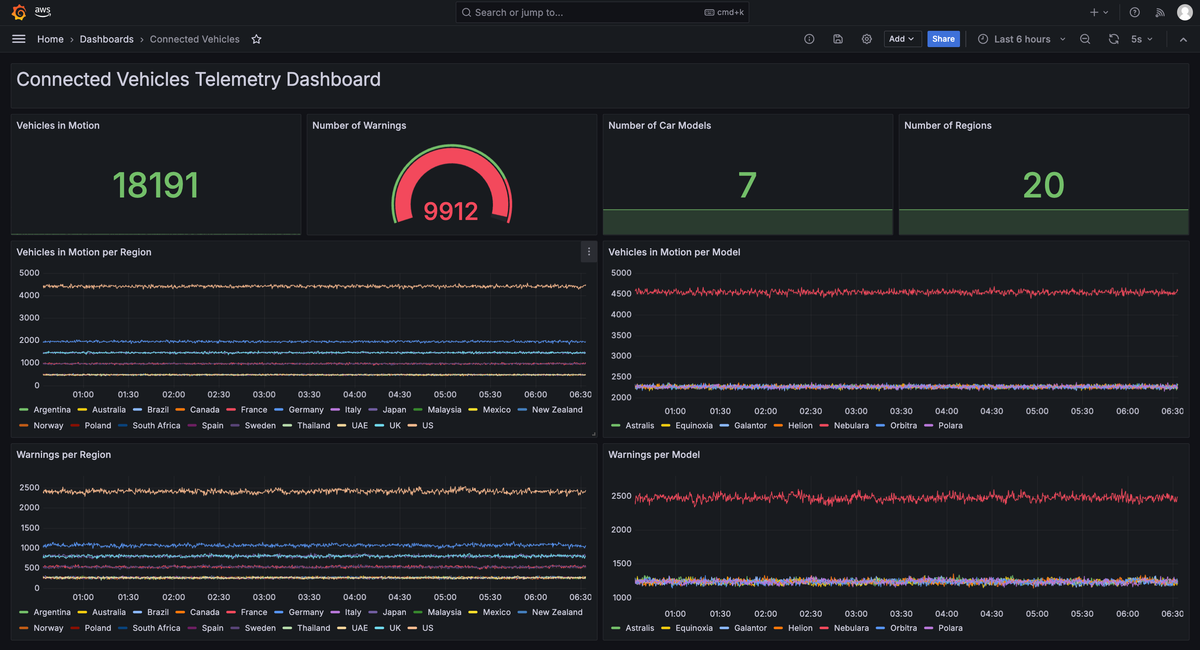
Grafana Cloud is the managed version of the stack most engineers have already touched. Four open-source backends sit behind the dashboard layer, Mimir for metrics, Loki for logs, Tempo for traces, and Pyroscope for profiles, plus k6 for load testing and a frontend observability product. It connects to CloudWatch as a data source, offers AWS integrations, and accepts OTLP, remote write, and its own Alloy agent.
What's good
- A genuine exit path. The core stack is open source and self-hosting it is a supported outcome rather than a threat. Dashboards and PromQL queries transfer between Grafana Cloud and a self-managed installation without rewriting, a stronger portability story than most proprietary platforms can offer.
- The most generous free tier for Prometheus-shaped workloads. 10,000 active metric series, 50 GB each of logs, traces, and profiles, and three users at 14-day retention, permanently. Small EKS clusters fit inside that comfortably.
- Adaptive Telemetry actively reduces what you pay for. Grafana Labs positions its adaptive metrics and logs features as identifying and dropping unused telemetry, claiming 35% to 50% reductions. A vendor shipping features whose purpose is lowering your bill is worth noting, given the incentive structure elsewhere on this list.
The catch
The multi-backend architecture is the trade-off behind the price. Each signal lives in a purpose-built store with its own query language, PromQL for metrics, LogQL for logs, TraceQL for traces. The dashboard unifies presentation, not querying, so pivoting from a metric anomaly to the logs behind it means changing language and mental model, and correlation is something you construct rather than something the data model gives you. Loki's index-on-labels design also makes queries on non-indexed fields slower than teams arriving from Elasticsearch expect.
Active-series billing makes cardinality the dominant cost variable, and Kubernetes generates cardinality by default. A cluster with 50 pods carrying namespace, deployment, container, and pod-name labels can produce 100,000 or more billable series from standard exporters alone, so one well-intentioned label can move the bill by an order of magnitude on identical infrastructure. The tier structure also has a cliff: Pro is a modest monthly platform fee plus usage, Enterprise requires a large annual spend commitment, and there is nothing between. Grafana Cloud has since added host-hour billing for Kubernetes Monitoring and Application Observability, so nodes now feed a host meter and a telemetry meter simultaneously.
Pricing model
Five usage meters plus a platform fee and per-user charges. Grafana publishes current rates at grafana.com/pricing: metrics bill per 1,000 billable series per month, at a lower rate for low resolution than high resolution; logs, traces, and profiles each bill on a three-part per-GB structure, a charge to process, a charge to write, and a charge per GB-month to retain; visualization users beyond a small included count bill per user; and a monthly Pro platform fee extends metrics retention to 13 months. Metrics bill on the 95th percentile of usage, excluding the top 5% of spikes.
Series-based metric pricing rewards label discipline and punishes label sprawl, a defensible choice that places the burden on teams whose infrastructure generates labels automatically. The three-part per-GB structure makes retention a separate decision from ingestion, more granular than most and also more to model. The per-user visualization charge reintroduces the access-rationing problem, though far less severely than seat-based competitors. Predictability is good if you know your active series count and can hold it steady, and poor during the kind of deployment that changes label sets.
The verdict
Grafana Cloud fits teams already fluent in the Grafana ecosystem, teams that want a credible self-hosting fallback, and Prometheus-shaped metrics workloads where cardinality is under active management. The free tier makes it the cheapest serious way to start. It is a weaker fit when cross-signal correlation is central to how you debug, when your Kubernetes labels are numerous and outside your control, or when you need enterprise support without a steep annual commitment.
5. Honeycomb
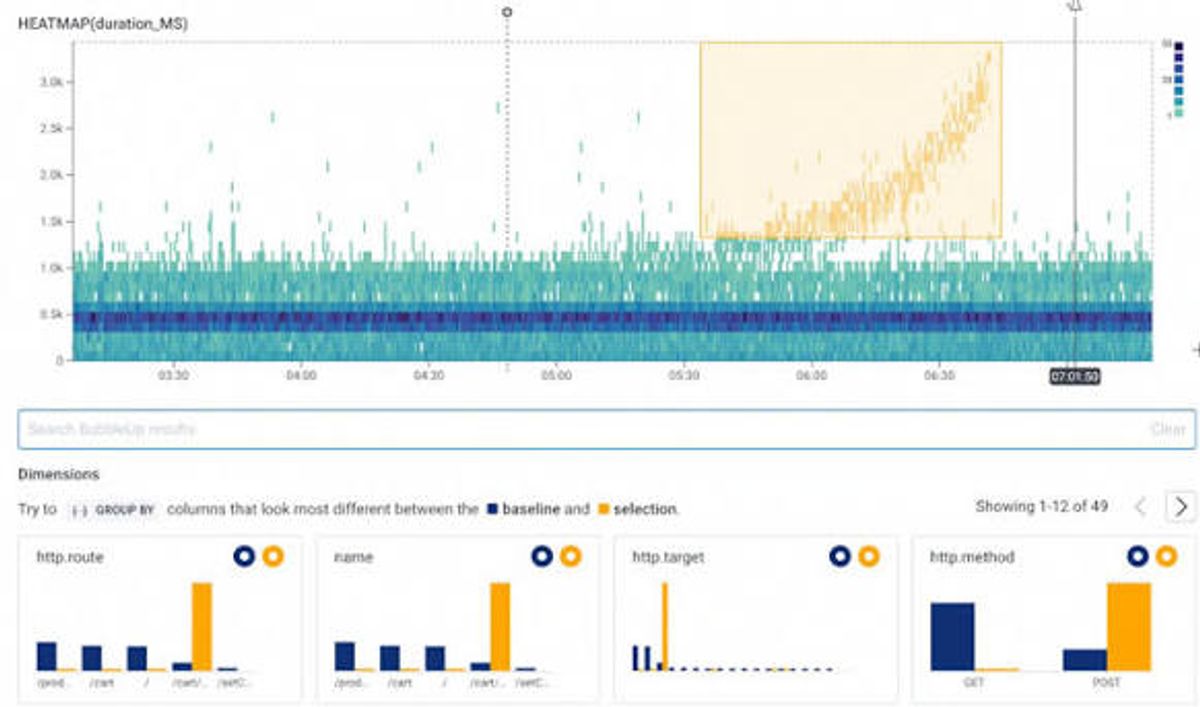
Honeycomb built its product on a different premise: that debugging distributed systems is exploratory work over wide, high-cardinality events rather than dashboard-watching over pre-aggregated metrics. You send structured events, slice them by any dimension, view distributions as heatmaps, and use BubbleUp to surface which attribute values distinguish slow requests from fast ones. Time-series metrics became generally available in March 2026, so it is no longer traces-only.
What's good
- High cardinality is the design assumption, not an exception. Attributes like
user_idandlambda_request_idare what the query model expects, and there is no series explosion penalty because events are not pre-aggregated. For debugging "why is it slow for this one customer," nothing else here is architecturally better suited. - Trace-aware querying rather than span-by-span inspection. You can find traces based on conditions in root, parent, or child spans instead of inspecting each span individually, which changes how fast you find the pattern in an event-driven flow.
- Refinery makes sampling a first-class control. Because cost tracks event volume, Honeycomb ships a tail-sampling proxy you run yourself, so you decide what to keep based on the full trace rather than a head-based coin flip. Teams that configure it well keep error and high-latency traces at 100% while sampling successes aggressively.
The catch
The investigation model has a genuine learning curve. Honeycomb works best when engineers explore distributions and arbitrary breakdowns rather than reading fixed dashboards, and teams arriving from conventional APM screens frequently need to change how they work before they see value, a training cost landing on people who are already busy. There is also no traditional log product: logs become structured events, which is philosophically coherent and operationally jarring if your team's reflex is grep across raw lines. AWS resource discovery is absent too, so Honeycomb will not show you your RDS fleet or EC2 health without you building it.
The bigger change is price. From July 1, 2026, Honeycomb's Pro per-event rate rose substantially, with tiers moving from three to four and topping out at 750 million events per month rather than 1.5 billion. Legacy customers who commit annually during the grace period keep old pricing at a modest markup for up to a year, then move to current rates. Any cost model built before mid-2026 needs redoing. Honeycomb also warns that repeated overages on Free and Pro can lead to throttling if you do not reduce usage or upgrade.
Pricing model
Two meters, events per month and metric data points per month, both tiered. Free covers 20 million events and 100 million metric data points. Pro starts at a base tier of 50 million events and 250 million data points, scaling up to 750 million events and 3.75 billion data points at the per-million-event rate. Enterprise starts from a base allowance of 10 billion events per year. Burst protection allows spikes to twice your daily target without counting against the monthly plan.
Counting events rather than bytes means attribute richness is free, the same helpful property as signal-count pricing and one that matters enormously for a product whose value proposition is wide events. What it charges for is trace depth and span count, so deep call chains and chatty microservice topologies drive cost directly. Sampling strategy becomes a first-order cost decision rather than an optimization, arguably honest and definitely more work. Moving metrics telemetry out of events and into the time-series product changes which tier fits you, so model the two meters together rather than accepting automatic migration.
The verdict
Honeycomb is right for teams whose hardest problems are anomalous behavior in distributed systems, who have engineers willing to learn an exploratory workflow, and who will actually invest in sampling configuration. It rewards that investment more than any other tool here. It is wrong if you need AWS resource inventory, conventional log search, or a platform your whole organization can use without training, and the 2026 repricing means anyone evaluating on older figures should start the modeling over.
6. Self-hosted Prometheus, Grafana, Jaeger, and OpenSearch
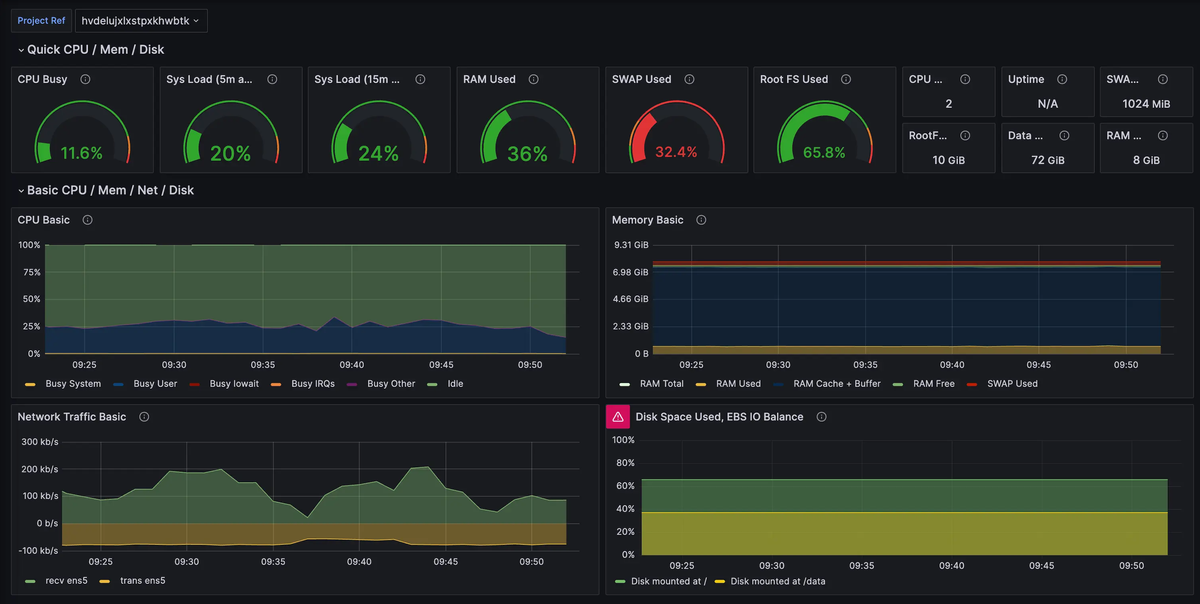
The assemble-it-yourself option deserves a serious entry rather than a footnote. Prometheus handles metrics with PromQL, Grafana handles visualization, Jaeger handles traces, and OpenSearch or Loki handles logs. For long-term metric storage you add Thanos, Mimir, or VictoriaMetrics. A Prometheus CloudWatch exporter pulls AWS vended metrics in, and everything speaks OTLP or has a receiver that does.
What's good
- No license, no meter, no vendor conversation. Cost is EC2, EBS, S3, and engineering time. At high telemetry volume the economics can invert dramatically against managed services, because you pay for compute and storage rather than for samples or events. Teams with substantial volume and existing platform capability often find this is not close.
- Complete control over retention, cardinality, and data location. You decide how long traces live, how many labels a metric carries, and which account or region holds the data. For regulated workloads and data sovereignty requirements, this is frequently the only option that clears the bar.
- Skills and configuration transfer anywhere. PromQL, Prometheus alert rules, and Grafana dashboards are the closest thing observability has to a portable standard, and this stack is where they originate. Nothing you build here is stranded.
The catch
You are now operating a distributed database, or several. Prometheus alone is straightforward until it is not: single-node retention limits push you toward Thanos, Mimir, or VictoriaMetrics, each adding components, object storage, compaction behavior, and its own failure modes. OpenSearch cluster management is a specialty, and Jaeger needs a storage backend and a sampling strategy. The 3am failure you are debugging may now be in your observability stack rather than your application, and when your metrics pipeline is down you have no metrics about your metrics pipeline.
Correlation is something you build. There is no shared data model across Prometheus, Jaeger, and OpenSearch, so pivoting from a metric to a trace to a log requires exemplars, consistent resource attributes, and dashboard links you wire up and maintain, with each signal keeping its own query language. Teams that succeed here usually have someone whose actual job is the observability platform, and if you do not have that person the honest cost is hiring them. The cost accounting gets misrepresented in both directions too: vendors quote engineering time at a rate that makes self-hosting look absurd, while advocates quote infrastructure cost and omit the platform engineer.
Pricing model
There is no software meter. Prometheus, Jaeger, OpenSearch, Thanos, and VictoriaMetrics are all open source, so your bill is EC2 or EKS compute, EBS or S3 storage, cross-AZ and egress transfer, and salary. Because cost is fixed infrastructure rather than variable consumption, the model has the opposite incentive shape to everything else here: adding another label, attribute, or log line costs nothing marginal until you hit a capacity boundary and provision more.
That property is genuinely valuable and it is also the trap. Without a meter creating feedback, cardinality grows unchecked until a query times out or a node falls over, and the correction arrives as an incident rather than an invoice. Teams running this well impose their own limits through relabel configs, recording rules, and retention tiers, the same discipline the metered platforms charge you to enforce. Predictability is excellent for the infrastructure line and poor for the engineering line, because labor cost is lumpy and shows up as migrations, upgrades, and outages.
The verdict
Run this yourself if you have high telemetry volume, a platform team with capacity, and requirements around data location or retention that managed services cannot meet. At sufficient scale the economics are not a close call. Do not run it if observability would be a side project for engineers with other deliverables, because a half-maintained observability stack is worse than a managed one you complain about. Our Prometheus alternatives guide covers the storage-backend decisions in more depth.
Which tool fits your situation
You need breadth across security, CI, and databases from one vendor, and integration coverage is the bottleneck. Datadog, with ingestion controls configured before you onboard rather than after the first invoice.
Your engineering organization is large and your telemetry volume is modest. New Relic's per-GB model handles host churn well, but run the seat arithmetic first, because the Standard-to-Pro cliff at the sixth full-platform user is steep enough to change the answer.
Your team already lives in Grafana and you want a real self-hosting fallback. Grafana Cloud, provided you can keep active series under control. The free tier is the cheapest honest evaluation available.
Your hardest incidents are anomalies in distributed behavior and your engineers will learn a new workflow. Honeycomb, budgeting time for Refinery configuration and remodeling costs against the July 2026 rates rather than older figures.
You run Lambda and event-driven AWS architecture, and the failures that hurt are timeouts, out-of-memory kills, and traces that break at the broker. Dash0, if your runtimes are Java, Node.js, .NET, or Python and SaaS-only storage is acceptable. If you run mostly Go, or need on-premises deployment, another option fits better.
You have real volume and a platform team. Self-host. The arithmetic at scale usually favors you, and the skills transfer.
Final thoughts
These six options represent three distinct bets. The broad commercial platforms bet that integration coverage and product surface justify per-host and per-seat meters. The consumption-priced platforms bet that metering telemetry volume directly, without host or seat multipliers, produces a bill teams can forecast. Self-hosting bets that at sufficient scale, engineering time is cheaper than any vendor's margin.
What no option here resolves is the gap between what AWS emits and what your application knows. AWS gives you resource health without instrumentation and nothing about a request's path through your services. Your instrumentation gives you the path and knows nothing about the RDS instance underneath. Closing that gap needs one data model carrying both, which is where OpenTelemetry semantic conventions and resource attributes do the work, and where the backend choice determines whether that context survives ingestion or gets flattened into a proprietary shape. Dash0's position is narrow and specific: OTLP in without translation, PromQL over every signal, Perses dashboards that export, and per-signal pricing that does not charge extra for the attributes making correlation possible. Whether that is the right trade depends on the criteria at the top of this article, particularly if you run Go or need self-hosting, where it clearly is not.
Whatever you pick, model the AWS-side cost of the pipe alongside the vendor's rate card. Metric streams, Firehose, subscription filters, and egress are real line items vendor pricing pages do not show you, and they are the most common reason a migration lands over budget.
Sign up for a free Dash0 account with 14 days of unlimited access.