
Prometheus is the de facto standard for cloud-native metrics, and for good reason. It’s a CNCF grad, has a massive community, and its data model and query language, PromQL, are brilliant. But if you’re reading this, you also know the pain. Scaling Prometheus isn’t a walk in the park.
Once you move beyond a handful of clusters, you’re suddenly wrestling with federation, remote-write, and a whole zoo of external components like Thanos or Cortex just to get long-term storage and a global view.
The operational overhead balloons. You spend more time managing your monitoring stack than monitoring your applications. High-cardinality metrics can bring it to its knees, and you’re stuck with just one piece of the puzzle—metrics. What about logs and traces? That’s on you to figure out.
You’re not alone in feeling this friction. Teams everywhere are looking for Prometheus alternatives that keep the good parts (hello, PromQL) but ditch the operational baggage and data silos.
This is your guide to the best options out there, from managed services that build on Prometheus’s strengths to unified platforms that do it all.
1. Dash0

Dash0 is an OpenTelemetry-native observability platform built for teams that love Prometheus but are tired of running it. It’s designed from the ground up to solve the exact scaling, cost, and complexity problems that plague self-hosted setups. It unifies metrics, logs, and traces into a single, cohesive system with one query language for everything, without the vendor lock-in that defines the legacy players.
What’s good
- Zero lock-in by design. Dash0 is built on open standards. It’s OpenTelemetry-native, uses PromQL for querying all signals, and its dashboards are built on the open-source Perses project. You can instrument once with OpenTelemetry and point your data to any compatible backend. If you leave, you can take your dashboards and alerts with you.
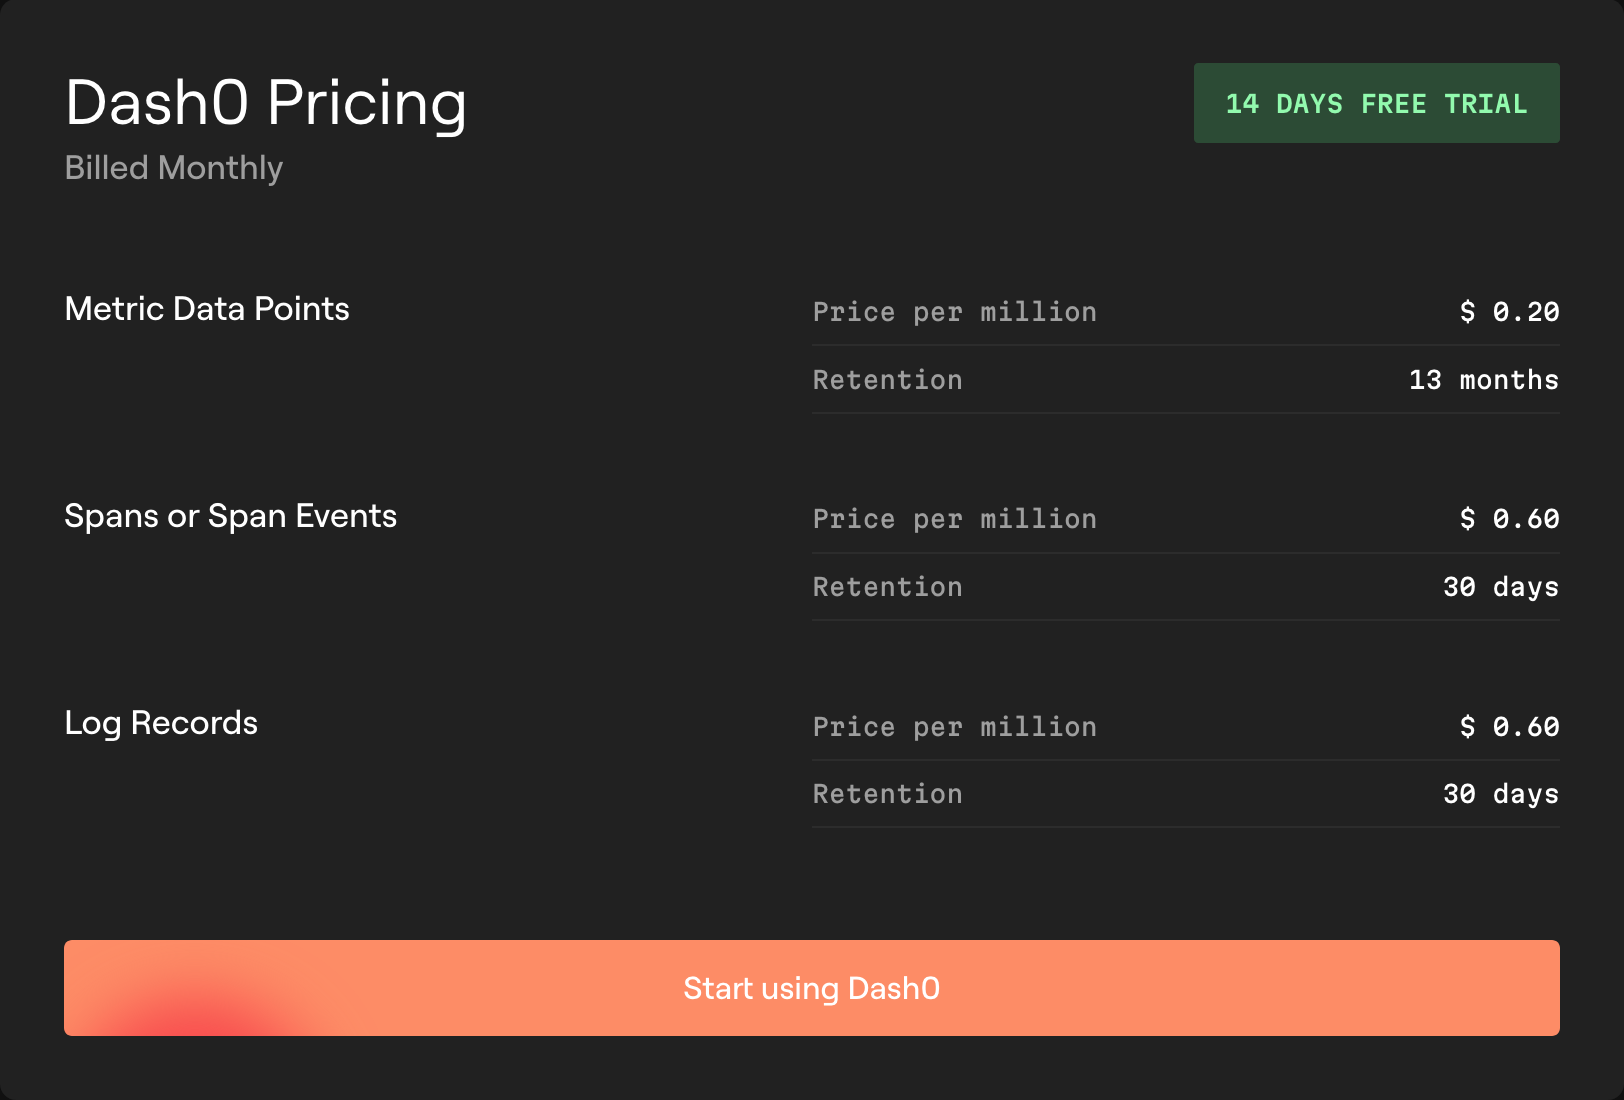
- Transparent, predictable pricing. The pricing model is dead simple: you pay per million logs, spans, or metric data points you send. That’s it. There are no surprise fees for users, queries, ingestion volume, or cardinality. You can finally send rich metadata without worrying about a ballooning bill.
- One query language for everything. You don’t need to learn three different query languages for your three signals. Dash0 lets you use the PromQL you already know to query metrics, logs, and traces. This drastically reduces the learning curve and makes it easier to correlate data across your entire system.
The catch
Dash0 isn't just a managed Prometheus-as-a-service. While you can absolutely use it as a simple, scalable backend for your existing Prometheus servers via remote-write, you'd be using only a fraction of its capability.
The real value comes from unifying metrics, logs, and traces. This means that to get the most out of Dash0, you'll want to embrace OpenTelemetry instrumentation in your applications to see the rich context between your signals. Otherwise, you might be paying for a V8 engine and only ever using two cylinders.
The verdict
Dash0 is the top choice for cloud-native teams looking for a true Prometheus alternative that solves the core problems of scale and operational overhead without trapping them in a proprietary ecosystem. If you want to keep using PromQL, embrace OpenTelemetry, and get predictable costs for a fully unified platform, this is it.
2. Grafana Cloud (Mimir)

Grafana Cloud is the managed offering from the makers of the ubiquitous Grafana visualization tool. Its metrics backend is powered by Grafana Mimir, the open-source, horizontally scalable time-series database that evolved from Cortex. It’s a natural upgrade path for teams already deep in the Grafana ecosystem.
What’s good
- It’s a managed Prometheus experience. You get the power of a massively scalable Prometheus-compatible backend (Mimir) without having to operate it yourself. It handles ingestion, storage, and querying at a scale that would be a nightmare to self-host.
- Deeply integrated with Grafana. If your team lives in Grafana, the integration is seamless. You can easily manage your metrics, logs, and traces (via Loki and Tempo) from a familiar interface.
- Strong Prometheus compatibility. It supports PromQL and the Prometheus remote-write protocol, making it a straightforward drop-in replacement for your existing Prometheus setup’s storage and query layer.
The catch
While it starts with a generous free tier, Grafana Cloud’s pricing can get complicated and expensive, fast. Costs are calculated based on multiple dimensions, including active time series, ingested log/trace volume, and per-user fees. High-cardinality metrics can drive your bill up unexpectedly. Also, while it offers logs (Loki) and traces (Tempo), they can sometimes feel like three separate products loosely stitched together in one UI rather than a truly unified platform.
The verdict
Grafana Cloud is a solid choice for organizations already committed to the Grafana ecosystem that want to offload the operational burden of scaling Prometheus. It’s one of the strongest Prometheus alternatives if you want a managed version of the OSS stack, but keep a very close eye on your usage to avoid bill shock.
3. Datadog

Datadog is an all-in-one SaaS platform that offers a massive suite of tools covering everything from infrastructure monitoring and APM to log management, security, and more. It’s known for its polished UI and extensive library of integrations.
What’s good
- It’s a true all-in-one platform. Datadog’s biggest strength is its breadth. You can get monitoring for practically anything in your stack, all under one roof, providing a single pane of glass for many teams.
- Polished user experience. The dashboards are slick, the APM traces are detailed, and the platform is generally easy for developers to jump into and start exploring data.
- Powerful APM. Its application performance monitoring capabilities are a major draw, providing deep insights into application code, database queries, and distributed traces.
The catch
Two words: cost and lock-in. Datadog is notoriously expensive, with a complex pricing model that has over a dozen billing dimensions (per-host, per-GB ingested, custom metrics, APM hosts, etc.).
It’s incredibly difficult to predict your costs, and many companies find themselves locked in due to the reliance on Datadog’s proprietary agent and data formats. Migrating off Datadog often means re-instrumenting your entire application stack.
The verdict
Datadog is a feature-rich platform that can provide a ton of value if you have a massive budget and are willing to go all-in on their proprietary ecosystem. However, teams are actively seeking alternatives precisely because the cost is so difficult to control and the vendor lock-in is so severe.
4. New Relic

New Relic is another long-standing player in the observability space, best known for pioneering the APM market. It has since evolved into a broader platform, consolidating its products and shifting to a more predictable pricing model based on data and users.
What’s good
- Best-in-class APM. Application Performance Monitoring is still New Relic’s core strength. It provides incredibly deep, code-level insights into how your applications are performing.
- Simplified pricing model. New Relic moved to a more consolidated pricing structure (per GB ingested and per user) which can be easier to understand than the labyrinth of SKUs offered by some competitors.
- Focus on OpenTelemetry. They have made significant strides in embracing OpenTelemetry, providing a path for customers to use open standards for instrumentation.
The catch
While New Relic has embraced OTel, its platform was originally built on proprietary agents, and that DNA is still present. It can also be quite expensive, especially if you have a lot of data or a large team of engineers who need access.
The verdict
New Relic is a strong contender, especially for engineering teams that are application-centric. If your main goal is deep APM insight and you like the data-plus-user pricing model, it’s worth evaluating. It’s a capable platform, but it’s still a premium-priced product.
5. Chronosphere

Chronosphere was founded by the creators of M3, Uber’s open-source metrics engine, and it’s built to solve one problem better than anyone else: observability at an absolutely massive scale. It’s an enterprise-grade platform focused on controlling high-cardinality data and managing costs.
What’s good
- Handles high cardinality with ease. This is its main selling point. Chronosphere’s control plane allows you to aggregate, transform, and drop metrics at ingest time, taming high-cardinality data that would crush other systems.
- Prometheus compatible. It’s fully compatible with PromQL and the Prometheus ecosystem, making it a viable (though very different) alternative.
- Cost control. The entire platform is built around giving you the tools to understand and control your data growth, ensuring you only pay for the metrics that provide value.
The catch
Chronosphere is a complex and very expensive tool aimed squarely at large enterprises with massive scale problems. It’s not something a startup or mid-sized company would typically adopt. The setup and configuration require significant expertise to get the most out of its advanced data-shaping capabilities. It’s a power tool, with a power tool’s price tag and learning curve.
The verdict
If you’re a large enterprise on the scale of a DoorDash or an Uber and your number one problem is out-of-control metrics cardinality, Chronosphere might be the only tool for the job. For everyone else, it’s complete overkill.
6. VictoriaMetrics

VictoriaMetrics is a fast, resource-efficient, and scalable open-source time-series database and a popular Prometheus alternative. It can be used as a drop-in replacement for Prometheus’s local storage, offering better performance and long-term storage capabilities. It’s available as open source, or as a managed service.
What’s good
- High performance. It’s written in Go and optimized for speed, often outperforming Prometheus and other TSDBs in benchmarks for data ingestion and querying.
- Resource efficient. It requires less RAM and CPU than many alternatives for the same workload, making it a cost-effective choice for self-hosting.
- Prometheus compatibility. It supports the Prometheus remote-write protocol and PromQL, making integration with an existing Prometheus/Grafana setup very easy.
The catch
VictoriaMetrics is primarily a time-series database—a component, not a full observability platform. While it excels at metrics and offers a logs product, you’re on your own for traces, visualization, and alerting. While there is a managed offering, many users go the self-hosted route, which means you’re still managing a piece of the observability puzzle, albeit a very performant one.
The verdict
VictoriaMetrics is an excellent choice if your main problem is the performance and scaling of your Prometheus storage backend. It’s a fantastic, high-performance engine. However, it doesn’t solve the broader challenge of operational overhead or the need for a unified platform with logs and traces.
7. Thanos

Thanos is a popular open-source project that extends Prometheus with capabilities for long-term storage and a global query view across multiple clusters. It’s not a replacement for Prometheus, but rather a set of components that work with it to create a scalable and durable metrics system.
What’s good
- Solves long-term storage. Thanos allows you to use cheap object storage (like S3 or GCS) for virtually unlimited and cost-effective retention of your metrics.
- Global query view. The Thanos Querier component lets you run a single PromQL query across multiple Prometheus instances, providing a unified view of your entire infrastructure.
- It’s open source. As a CNCF project, it has a strong community and allows you to build a highly available metrics system without vendor lock-in.
The catch
The operational overhead is significant. A full Thanos deployment involves multiple moving parts: Sidecar, Querier, Store Gateway, Compactor, and Ruler. You have to deploy, manage, and upgrade all of them. You’re essentially trading the limitations of a single Prometheus server for the complexity of a distributed system that you own.
The verdict
Thanos is a powerful way to scale a self-hosted Prometheus setup. If you have the engineering resources to manage a complex distributed system and want to avoid a commercial vendor, it’s the standard choice. But it’s an operational commitment, not a solution to reduce your workload.
8. AWS CloudWatch

Amazon CloudWatch is the native monitoring and observability service for AWS. It collects logs, metrics, and traces from your AWS resources and applications running on the platform. It’s the default choice for anyone running on AWS.
What’s good
- Deep AWS integration. It automatically collects data from nearly every AWS service out of the box. The integration with IAM, EC2, Lambda, and others is seamless.
- Pay-as-you-go. There are no upfront commitments; you pay for what you use, which is attractive for getting started.
The catch
CloudWatch gets very expensive very quickly, especially with custom metrics, high-resolution alarms, or large log volumes. The UI is widely considered clunky and difficult to navigate. Querying and correlating data between logs, metrics, and traces is a fragmented experience, and its PromQL support is a more recent addition that still shows its seams. It creates strong vendor lock-in to the AWS ecosystem.
The verdict
You’ll almost certainly use CloudWatch for something if you’re on AWS, like basic resource metrics or billing alarms. However, very few teams choose it as their primary, day-to-day observability platform due to its cost, usability issues, and fragmented nature.
9. Cortex

Cortex is the CNCF-graduated, open-source project that paved the way for horizontally scalable, multi-tenant, long-term storage for Prometheus. It was one of the original answers to the question, "How do we run Prometheus at massive scale?" and its architecture influenced many of the solutions that followed.
What's good
- It's open source and battle-tested. As a CNCF graduated project, it has been vetted and used in production at very large scales. You're not beholden to a vendor.
- Designed for scale. Its microservices-based architecture is built from the ground up for horizontal scalability, allowing you to scale ingestion and query components independently.
- Multi-tenancy. It has strong support for isolating data and queries for different teams or customers, which is a key feature missing from vanilla Prometheus.
The catch
The operational complexity is staggering. Cortex is not a single binary; it's a collection of a dozen different microservices (ingesters, distributors, queriers, rulers, etc.) that you have to configure, deploy, and manage. It's a full-time job to keep a Cortex cluster happy. Furthermore, the open-source community's momentum has largely shifted to Grafana Mimir, which was forked from Cortex and is generally considered easier to operate.
The verdict
Cortex is a historically important project, but in 2025, it's a tough sell for new deployments. Unless you have a pre-existing investment and deep expertise in running it, you're almost always better off choosing its successor, Mimir, for a self-hosted solution. It solves the Prometheus scaling problem by handing you a new, even more complex distributed system to manage.
10. Better Stack

Better Stack is a relatively newer player that aims to unify logging, monitoring, and incident management into a single, easy-to-use platform. It's built on a foundation of popular open-source tools, using ClickHouse for logs and offering a clean, developer-friendly interface.
What's good
- Simplicity and ease of use. Better Stack's main selling point is its clean UI and straightforward setup. It combines observability with operational tools like status pages and on-call alerting, which is a compelling package for smaller teams.
- Fast log management. By using a ClickHouse backend, its log search and aggregation capabilities are impressively fast.
- Predictable pricing. The pricing models are generally seen as more transparent and affordable than the enterprise giants, which is attractive for startups and SMBs.
The catch
It's not a metrics-first platform. While it can ingest Prometheus metrics, it doesn't have the deep, native PromQL integration or the rich feature set for time-series analysis that you'd find in a more direct Prometheus alternative.
It's more of a log management and incident response tool that also does metrics, rather than a dedicated, high-powered time-series platform. It may not meet the needs of SREs with complex, metrics-heavy use cases.
Final thoughts
Prometheus is a fantastic tool that changed the monitoring game. But as systems grow, the cost of managing it yourself in time, effort, and complexity often outweighs its benefits. The market for Prometheus alternatives has exploded to fill this gap.
You can opt for a managed version of the open-source stack with something like Grafana Cloud, or go all-in on an enterprise beast like Datadog if you have the budget. But for most cloud-native teams, the sweet spot is a platform that honors the spirit of Prometheus while providing a modern, unified experience with predictable costs.
That’s where a solution like Dash0 shines. It’s built on the foundation of OpenTelemetry and open standards, giving you the best of both worlds: a powerful, managed platform that eliminates operational toil without locking you into a proprietary ecosystem.
Dash0 offers a full-featured, 14-day free trial with no limits. Try it today to see how a truly OpenTelemetry-native platform feels.

