Sentry and Datadog show up in the same buying conversations, but they started at opposite ends of the stack. Sentry began as an exception logger for Django apps and still thinks about production from the point of view of the developer who wrote the broken line. Datadog began as infrastructure monitoring for ops teams and kept adding products until it covered almost everything that runs in production.
So "Sentry vs Datadog" is rarely a like-for-like choice. You're deciding between a tool that is excellent at one question (what broke in my code, and who should fix it?) and a platform that wants to answer every question about production, one SKU at a time.
This guide compares the two on error monitoring, application performance monitoring (APM), telemetry breadth, developer workflows, OpenTelemetry support, and pricing, with a worked cost example built from each vendor's published rates. It ends with the point where a lot of teams stop being happy with either answer.
The short answer
Pick Sentry if your main problem is application errors and the people fixing them are the developers who wrote the code. Pick Datadog if you need infrastructure, logs, traces, and user monitoring in one account, and you have the budget and discipline to manage a per-product bill. Plenty of teams run both. That works, but it gives you two sources of truth for the same incident.
| Sentry | Datadog | |
|---|---|---|
| Built for | Application developers | Ops, SRE, and platform teams |
| Core unit | The issue (a group of similar errors) | The host, the metric, the service |
| Strongest at | Error grouping, stack traces, release health, session replay | Infrastructure metrics, APM, log management at scale |
| Infrastructure monitoring | No | Yes, 1,000+ integrations |
| Pricing model | Plan fee plus metered events per data category | Per host, plus per-GB and per-event add-ons per product |
| Entry price | Free Developer plan; Team from $26/month | Free up to 5 hosts; Infrastructure Pro from $15/host/month |
| OpenTelemetry | OTLP traces and logs (open beta), no OTLP metrics | OTLP for all signals, mapped onto Datadog's data model |
| AI debugging | Seer, $40 per active contributor/month | Bits AI, billed in committed AI credits |
Prices are list prices with annual billing, taken from Sentry's pricing page, Sentry's pricing docs, and Datadog's pricing page.
What each tool was built to do
Sentry's design center is the application exception. When your code throws, the SDK captures the stack trace, local variables, breadcrumbs (the events leading up to the failure), and the release version. Sentry then groups similar events into an issue that someone can own, assign, and resolve. Everything added since, including tracing, profiling, session replay, logs, and uptime checks, hangs off that issue view. Traces exist to explain errors. Replays exist to show what the user did right before one.
Datadog's design center is the host. It started by collecting infrastructure metrics through an agent, then added APM, logs, real user monitoring (RUM), synthetics, security, CI visibility, and AI products. Today its pricing page lists products across observability, security, digital experience, software delivery, and service management. Error Tracking is one product among dozens, fed by data you already send to APM, RUM, or Log Management.
That difference shapes the rest of this comparison. In Sentry, you start from a bug and pull in context. In Datadog, you start from a symptom (a latency spike, a saturated node, a noisy log pattern) and drill down until you reach the code.
Error monitoring: Sentry's home turf
For code-level errors, Sentry is still the tool to beat. The parts you touch every day are mature: grouping you can tune with fingerprint rules, source maps for minified JavaScript, debug symbols for native and mobile crashes, suspect commits that point at the change most likely to have caused an issue, and release health that tracks crash-free sessions per version. When an issue you resolved comes back, Sentry marks it as a regression and ties it to the release that reintroduced it.
Session Replay is the part I'd miss most if I moved away. A recording of the 30 seconds before a frontend error saves more time than any stack trace, because so many frontend bugs turn out to be "the user did something nobody expected."
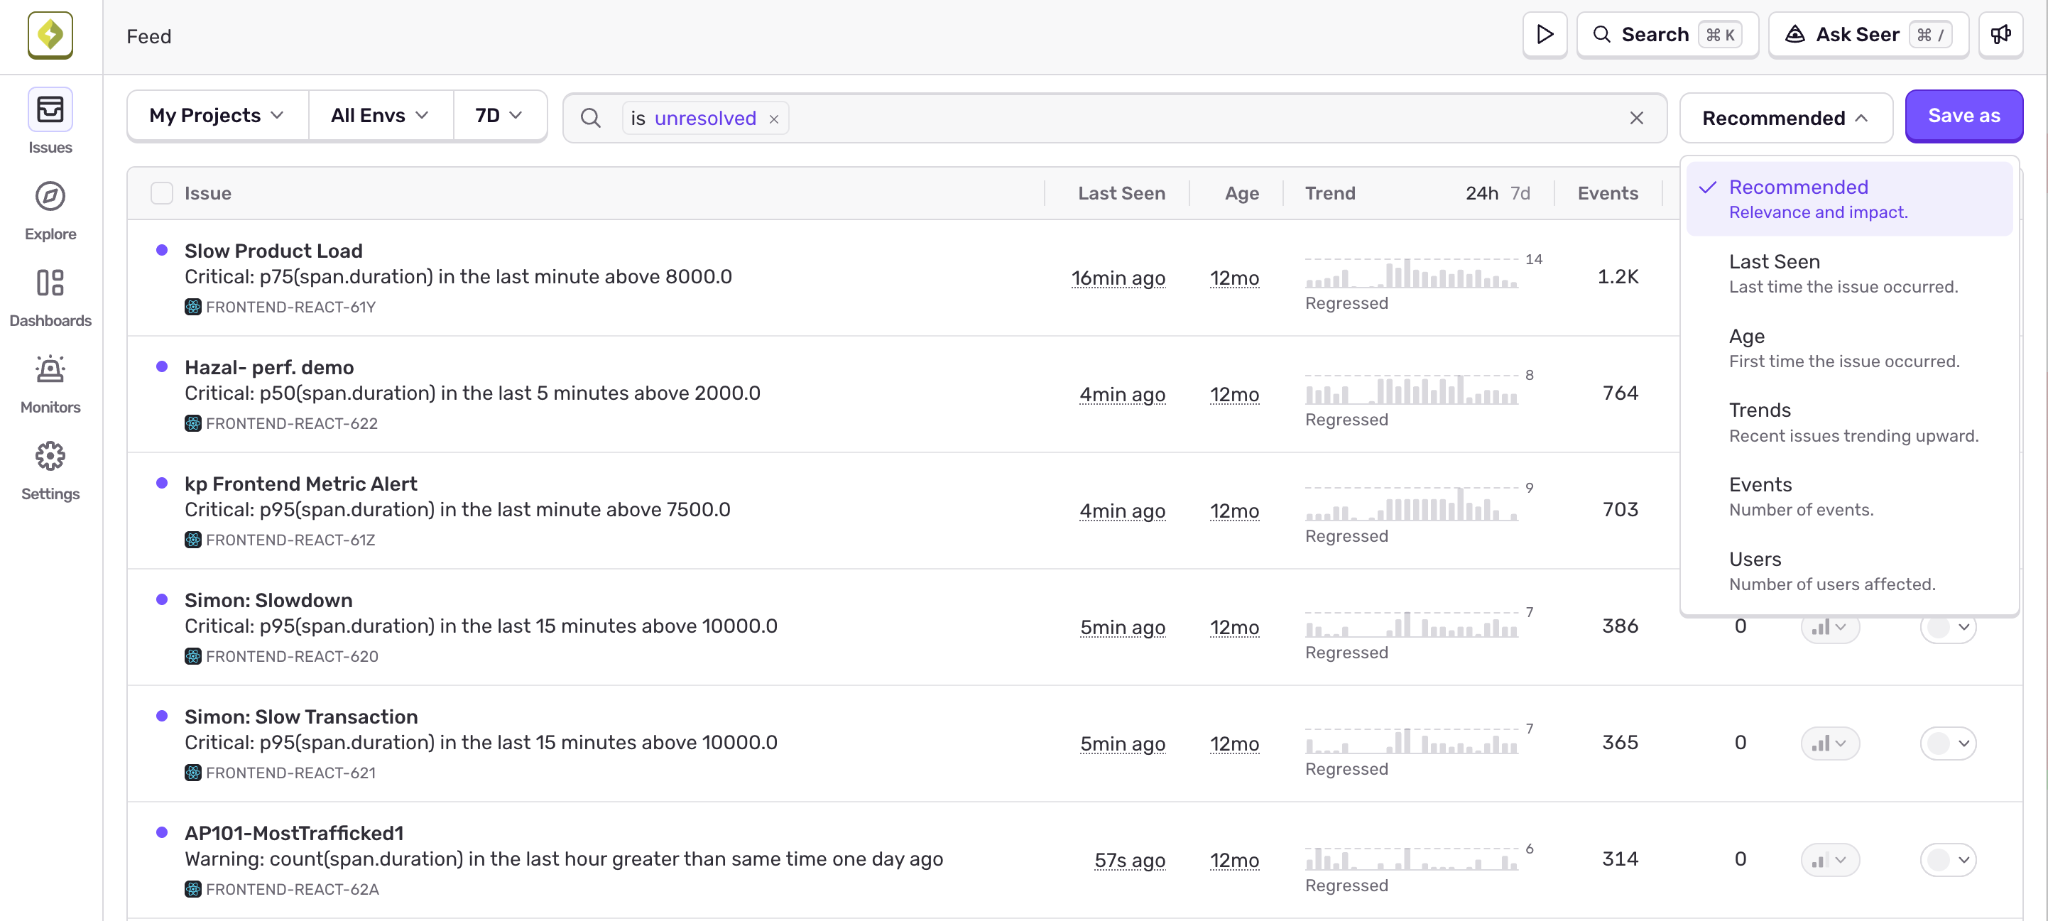
Seer is Sentry's AI debugging agent. It runs root cause analysis on issues, proposes code fixes, opens pull requests, and reviews PRs to catch bugs before they merge (Seer docs). It costs $40 per active contributor per month, where an active contributor is anyone who opens two or more PRs to a Seer-enabled repository (pricing). For a team of 25 engineers that's $1,000 a month on top of your plan, so trial it against your real backlog before you commit.
Datadog Error Tracking groups errors by computing a fingerprint from attributes such as error type, message, and stack trace, and it shows issues from RUM, logs, and APM in a single Error Tracking Explorer. That consolidation is its real advantage. A backend exception, the trace it belongs to, the host it ran on, and the logs around it are one click apart. Rules, daily rate limits, and dynamic sampling stop one runaway issue from burning through your error budget (docs).
Where Datadog trails is depth on the developer side. Mobile crash symbolication, release health, and the "who broke this" workflow feel more finished in Sentry, which has spent more than 15 years on this one problem. If errors are your primary signal, Sentry wins this section without much debate.
Application performance monitoring and tracing
Both tools do distributed tracing. They meter and store it very differently, and that changes how you end up using it.
Sentry bills tracing per span. Paid plans include 5M spans a month, then charge from $0.0000016 per span on Team reserved volume, or twice that on Business (pricing). Tracing is tightly bound to errors and frontend performance: transaction summaries, web vitals, slow database queries, and a trace view that jumps from a failed span to the matching issue. For most application teams that's enough. It's lighter on service-level analytics across dozens of backend services and on long-term RED metrics (rate, errors, duration).
Datadog APM is host-based (how Datadog distributed tracing works). It costs $31 per APM host per month with Infrastructure Monitoring attached, or $36 standalone, billed annually (pricing). Each APM host includes 150 GB of ingested spans and 1 million indexed spans a month. Ingested spans are searchable for 15 minutes. Indexed spans are the ones you keep, 15 days by default (APM billing). Extra indexed spans start at $1.27 per million with 7-day retention and rise to $1.70 at 15 days (price list). RED metrics are computed from 100% of traffic regardless of sampling, which is one of the better design decisions in the product. Continuous profiling comes with APM Enterprise at $40 per host, or standalone from $19 per profiled host.
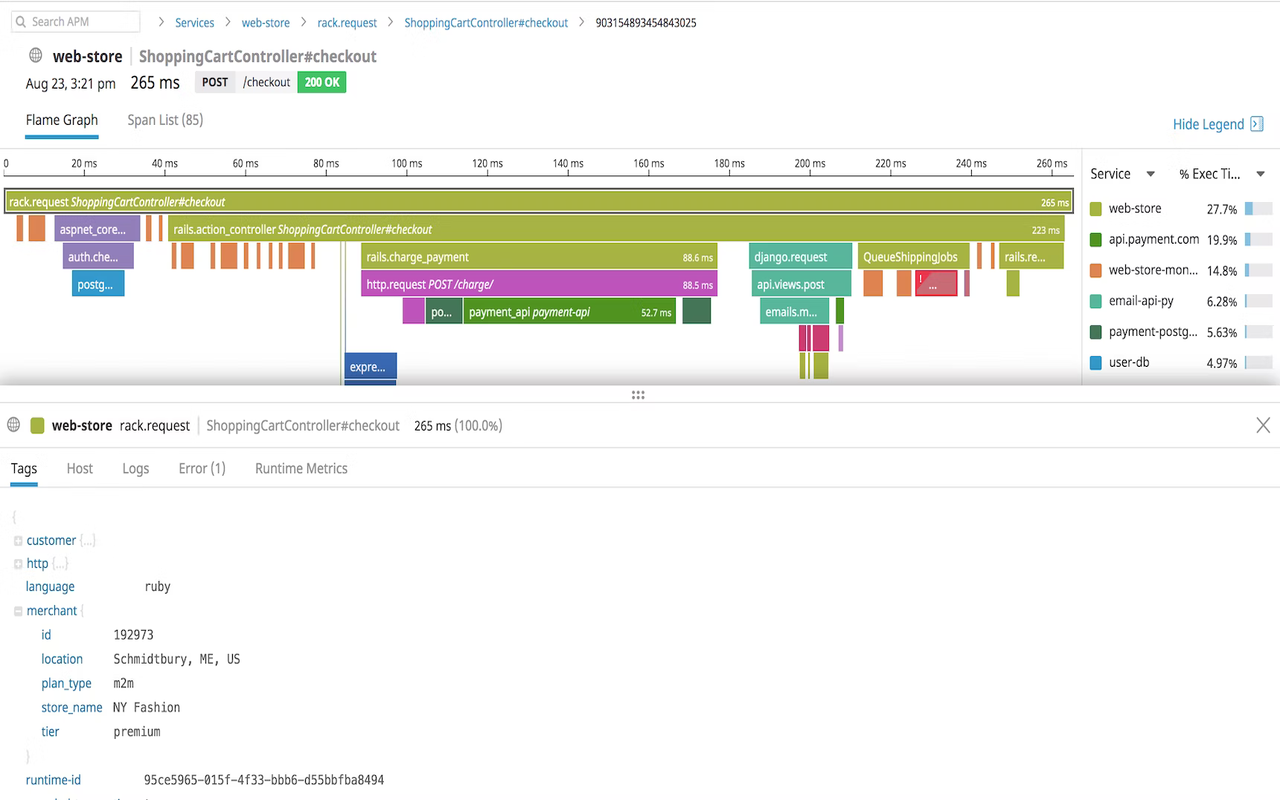
The trade-off is visibility versus cost control. Datadog's 15-minute live window catches people out: if a trace wasn't indexed, you can't find it an hour later during the postmortem. Sentry keeps every span you pay for, so at high throughput you'll sample aggressively to keep the span bill sane.
Telemetry breadth
This is where the comparison gets lopsided.
Sentry covers application-level signals: errors, spans, session replays, logs, application metrics, profiles, cron monitors, and uptime monitors. Logs and application metrics are recent additions, each with 5 GB included and $0.50 per GB after that, paid from your pay-as-you-go budget (pricing). They're useful for attaching context to an issue. They aren't a replacement for a log platform that takes everything from your clusters, load balancers, and managed databases.
What Sentry doesn't do is infrastructure. There's no host agent, no Kubernetes node or pod metrics, no cloud metric integrations for services like RDS or SQS, and no network monitoring. If a node runs out of memory and your pods get OOM-killed, Sentry may show you the errors that follow. It won't show you the node.
Datadog covers all of that and then some: infrastructure metrics with 15-month retention on the Pro plan, container and Kubernetes monitoring, database monitoring, network monitoring, log management with Standard and Flex storage tiers, RUM and session replay, synthetic API and browser tests, plus a long list of security and CI products (pricing). If breadth is the requirement, Datadog is the obvious answer. The catch is that each of those is a separate SKU with its own meter, and they compound. If you want a refresher on how the signals fit together, see logs vs metrics vs traces.
Developer workflows
Sentry is built around the developer's loop. You install an SDK, set a DSN, upload source maps from CI, and errors appear within minutes with the commit and author attached. Ownership rules and code owners route issues to the right team. Integrations with GitHub, GitLab, Jira, Slack, and Linear close the loop, so an issue can become a ticket and a merged PR can resolve the issue. Every paid plan includes unlimited users, which matters when you want every engineer looking at their own errors, not just whoever is on call.
Datadog's workflow starts from the platform side. You deploy the Datadog Agent (or the DDOT Collector, Datadog's distribution of the OpenTelemetry Collector), enable APM tracers per language, and connect your cloud accounts. From there, work happens in dashboards, monitors, notebooks, and incidents, with a Software Catalog for service ownership and Bits AI for investigations and code fixes. It's powerful. It also assumes someone owns the platform, because tag hygiene, index filters, and retention settings decide both how useful the data is and how big the bill gets.
The adoption pattern follows from that: developers adopt Sentry on their own and keep using it. Datadog usually gets adopted by a platform team and then pushed toward developers, with mixed results.
OpenTelemetry support
If you instrument with OpenTelemetry (OTel), or plan to, both vendors will take your data. What they do with it differs.
Sentry ingests OTLP traces and logs, either straight from an OTel SDK or through the OpenTelemetry Collector. The feature is in open beta, and Sentry doesn't accept OTLP metrics at all (OTLP docs). Sentry also supports running its own SDK alongside OTel, with the two sharing trace context (Sentry on OpenTelemetry). That works, but it means two SDKs per service, and Sentry's error workflows are built around data from its own SDK.
Datadog accepts OTLP for all three signals, through OTLP ingest in the Datadog Agent, an OpenTelemetry Collector with the Datadog exporter, or direct intake endpoints for serverless and managed platforms. Once the data lands, it's translated into Datadog's model. OTLP metrics are mapped onto Datadog metric types, and a single OTLP metric can become several Datadog metrics (OTLP metric types). Spans are mapped onto Datadog's "service-entry span" concept, which the docs themselves describe as unique to Datadog and which needs an opt-in setting to derive from OTel's SpanKind (mapping docs).
So Datadog is OTel-compatible, but not OTel-native. The distinction sounds academic until you try to query by semantic convention attributes like http.request.method or k8s.pod.name, or move your data somewhere else, and have to reason about a vendor naming layer sitting on top. Dash0 has a longer write-up on the difference between being OpenTelemetry-native and integrating OpenTelemetry.
Pricing: two meters that measure different things
Sentry charges a plan fee and then meters each data category separately. Team is $26 a month and Business is $80 a month on annual billing, and both include 50K errors, 5M spans, 50 replays, 5 GB of logs, and 5 GB of application metrics (plans, pricing docs). Beyond that, you buy reserved volume in advance or set a pay-as-you-go (PAYG) budget. Business buys you features like SAML SSO and advanced quota management, and it also roughly triples the per-error rate at the first tier ($0.00089 vs $0.00029 reserved).
Datadog charges per product. Infrastructure Pro is $15 per host, APM adds $31 per host, log ingestion is $0.10 per GB, and standard indexing is $1.70 per million log events at 15-day retention (pricing). Error Tracking is included for errors that arrive through APM traces and RUM events. Errors from logs, or from the standalone backend product, are billed by volume.
Here's what a mid-sized setup costs on each at list price. The workload is 20 hosts, 2M errors, 100M spans, and 50 GB of logs a month. Sentry numbers use reserved rates. Datadog assumes about 1 KB per log event and no more than the included 20M indexed spans.
| Monthly cost | Sentry Team | Sentry Business | Datadog |
|---|---|---|---|
| Base plan | $26 | $80 | No platform fee |
| Errors (2M) | $309.50 | $694.50 | Included with APM |
| Traces (100M spans) | $152 | $304 | $620 (20 APM hosts) |
| Logs (50 GB) | $22.50 | $22.50 | $90 ($5 ingest + $85 indexing) |
| Infrastructure (20 hosts) | Not available | Not available | $300 |
| Total | ~$510 | ~$1,101 | ~$1,010 |
The totals look close, but they buy different things. The Sentry bill gets you excellent error workflows and no infrastructure visibility. The Datadog bill gets you infrastructure and APM, with error tracking that's good but less developer-focused. Neither includes session replay, RUM, synthetics, or AI debugging, all of which are extra on both.
The surprises are different too. On Sentry, once your reserved volume and PAYG budget run out, new data is dropped and you lose monitoring for the rest of the billing cycle (pricing, quota management). A bad release that throws millions of errors can blind you right when you need visibility. On Datadog, the data keeps flowing and the bill absorbs it. Hosts are billed on the high-water mark of hourly usage after the top 1% of hours is dropped (billing docs), containers beyond the 5 per host allotment cost $0.002 per container per hour, and custom metrics beyond 100 per host are billed on top. Sentry fails closed on budget. Datadog fails open on cost. Pick the failure mode you can live with.
Running both
A common split is Datadog for infrastructure, APM, and logs, owned by the platform team, and Sentry for errors and replays, owned by product engineers. It's a reasonable arrangement, and it's where a lot of mid-sized companies land.
The real costs go beyond the two invoices. You instrument each service twice, with a Datadog tracer and a Sentry SDK. You pay for tracing in both places unless you switch it off in one. And during an incident, the error lives in one tool while the trace, host, and logs live in another, so someone ends up copying a trace ID between browser tabs at 3 a.m. Alerting splits as well: Sentry pages on new issues, Datadog pages on monitors, and the same outage fires both.
If you go this route, decide which tool owns which alert, turn off tracing in one of them, and standardize on W3C Trace Context propagation so a trace ID means the same thing in both.
When teams outgrow single-purpose tooling
Sentry rarely fails on features. Teams outgrow it when their questions change. These are the signs I'd watch for:
- Incidents increasingly start outside your own code, in a saturated connection pool, a slow downstream API, or a noisy neighbor on a Kubernetes node.
- You need logs from things you can't put an SDK in, like ingress controllers, managed databases, or Kubernetes events.
- Error volume passes a few million events a month and the per-error meter starts to dominate the bill.
- Platform engineers want service-level objectives (SLOs) and metric-based alerting, and Sentry isn't where they work.
- You've standardized on OpenTelemetry and want a backend that treats metrics, logs, and traces as equals instead of hanging them off errors.
The usual next step is Datadog, and for many organizations that's a defensible call. It's broad, mature, and well supported. The structural problem is the business model. Datadog earns more when you send more data across more SKUs, so it has little reason to help you send less. Teams tend to find this out the first time a cluster autoscaler doubles the host count, or a debug log level ships to production.
The other path is an OpenTelemetry-native backend. You instrument once with OTel, keep semantic conventions intact end to end, and choose where the data goes. Your instrumentation stays portable, and your costs track the telemetry you send rather than how many hosts you run or how many products you've switched on. If you're weighing backends, Dash0's guide on what makes a good OpenTelemetry backend lays out the criteria.
Final thoughts
Sentry and Datadog are both credible tools, and the right choice depends on the question you ask most often. If it's "what broke in my code, and who should fix it?", Sentry answers faster and for less money, especially below a few million errors a month. If it's "what's happening across my whole production environment?", Datadog answers that, provided you budget for the meters and have someone to manage them.
Where both come up short is the space in between: connecting an application error to the infrastructure and dependency signals around it, on open standards, without paying for the same trace twice. That's the gap Dash0 was built for. Dash0 is OpenTelemetry-native, so logs, metrics, traces, and web events arrive with semantic conventions intact and correlate on shared resource attributes instead of vendor tags, and synthetic checks run on the same platform. You query with PromQL, dashboards are Perses, and the Dash0 operator for Kubernetes handles instrumentation on your clusters.
Pricing is consumption-based, with no base subscription fee: a flat ingest rate for everything you send, metered by SignalControl, and an index rate, which drops as volume grows, for only the signals you keep (cost control docs). SignalControl Edge runs spam filtering, signal-to-metrics conversion, and tail sampling inside your own network, so you cut egress as well as ingest and storage costs.
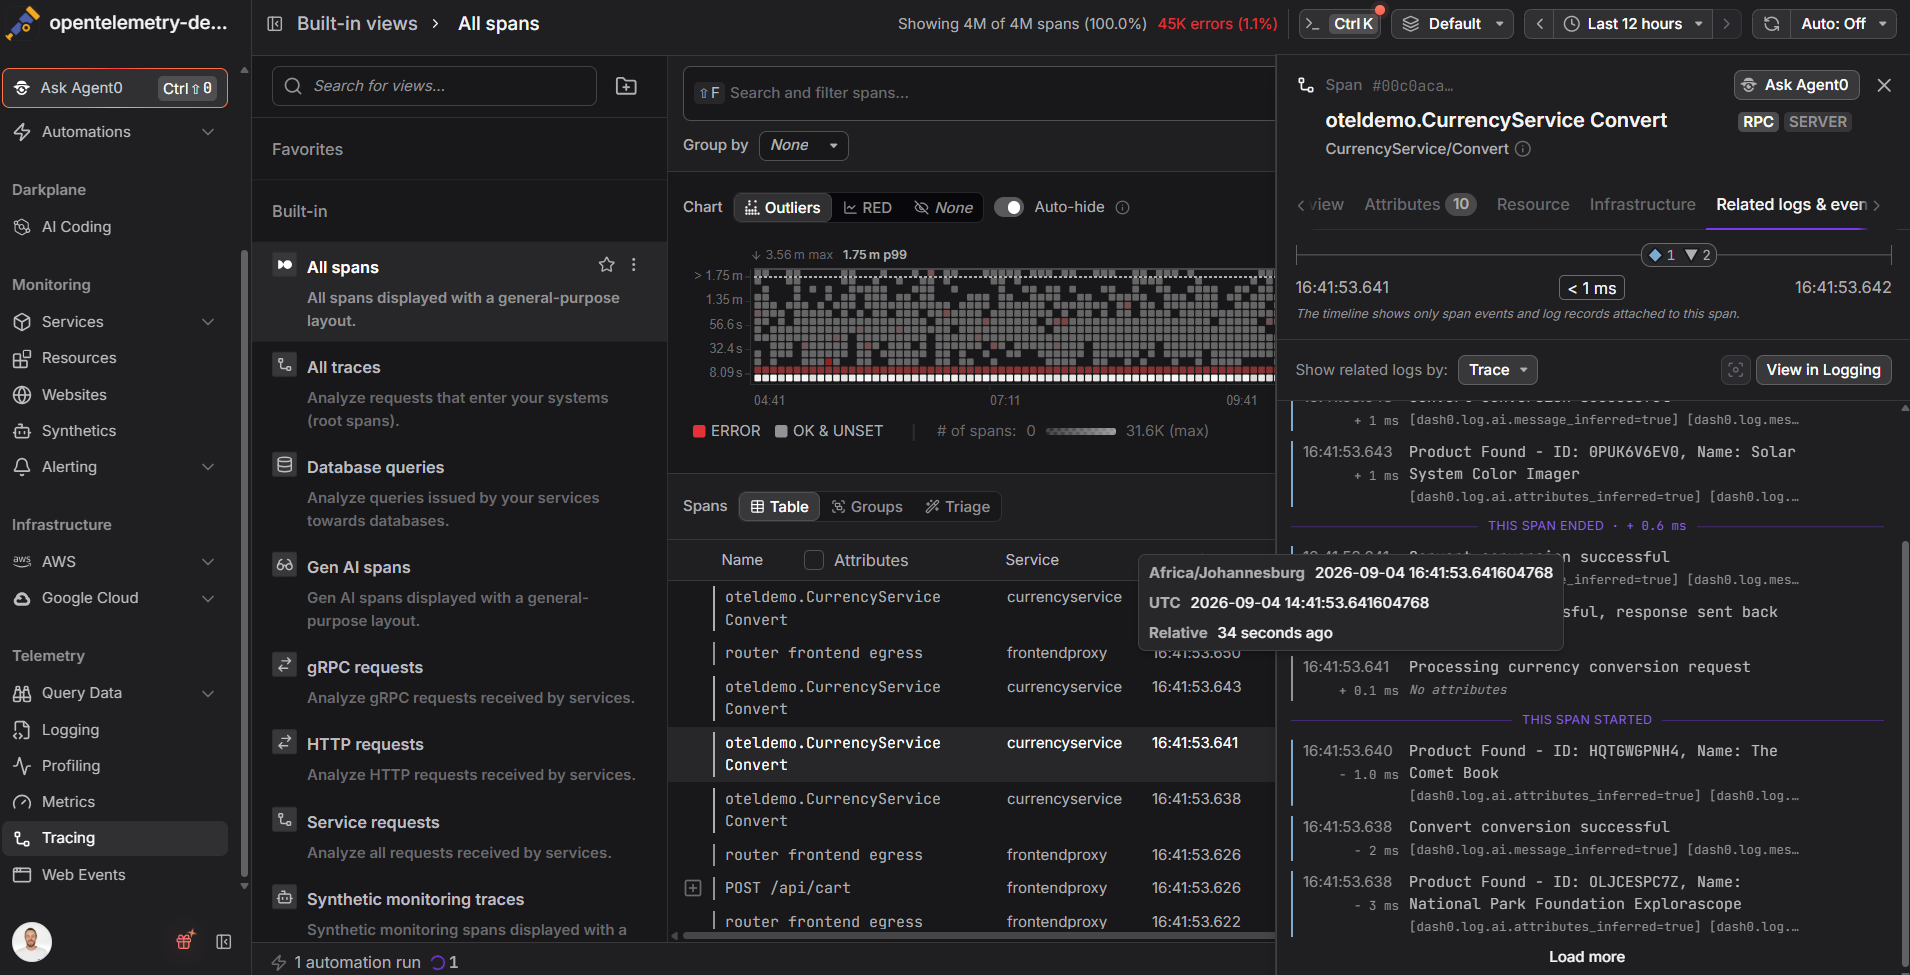
On top of that data runs Agent0, Dash0's autonomous production AI. It scans your environment continuously, answers plain-language questions across your telemetry and code with citations you can check, and correlates logs, metrics, and traces during an investigation (Agent0 guide). It also generates dashboards, alerts, runbooks, and pull requests, and validates each one against your live data before creating it. You can ask it directly, or let Automations trigger it on a failed check, a pull request, or a schedule.
Autonomy is progressive. At first, Agent0 proposes and you approve. Once you trust it on a service, it acts and you review afterward. Full autonomy comes last, and only for the services and workflows you choose. Code fixes arrive as pull requests your team reviews and merges.
If you're currently on Datadog and want to see what a move looks like, read Migrating from Datadog to OpenTelemetry and Dash0. If you're still choosing, start by instrumenting one service with OpenTelemetry. Whatever backend you pick next, that work carries over.