If you are searching for AppDynamics alternatives in 2026, the product you bought is probably not the product on the roadmap anymore. AppDynamics is now Splunk AppDynamics, the engineering team sits inside Splunk, and Splunk Observability Cloud replaced the Cisco Observability Platform after the AppDynamics development team moved into Splunk. In June 2026 Splunk described Observability Cloud as one unified platform with the best of AppDynamics SaaS built in, while positioning AppDynamics itself as the right choice for self-managed, air-gapped or heavily regulated environments. Nobody is turning your controller off. But if you run containers, autoscaling groups and polyglot services, the center of gravity has moved to a different product with a different agent, a different data model and a different bill.
That lands on top of the reasons teams were already shopping. Per-core licensing does awkward things when a Kubernetes deployment scales from six pods to sixty at 9am. The Java and .NET agents that made AppDynamics excellent on three-tier applications need a JVM restart and a controller-side configuration model that feels heavy next to a Helm chart. Business transactions, the capability AppDynamics does better than almost anyone, only exist inside AppDynamics. And renewal quotes have a habit of arriving with an enterprise agreement attached to them.
Choosing a replacement is harder than it looks because the differences that matter are not on any feature matrix. Every vendor here claims full-stack observability, AI root cause analysis and OpenTelemetry support. The real questions are who owns your instrumentation after the migration, what unit your bill scales on, whether the tool can still see the hybrid estate you cannot refactor, and how much of your investment survives the next vendor change. Some of these tools reduce your exposure to that question, none of them eliminate it, and this comparison covers the seven best AppDynamics alternatives worth a shortlist slot, ordered from the path of least resistance (staying inside the Splunk portfolio) through commercial replacements to open source. Each one gets assessed against the same criteria, with a pricing model analysis rather than a headline price, and an honest account of what breaks when you leave AppDynamics behind.
Why migrating off AppDynamics costs more than the license
AppDynamics organizes the world around business transactions: a named entry point traced through tiers and nodes, tied to health rules and, with Business iQ, to revenue and conversion data. OpenTelemetry organizes the world around services, spans and resource attributes. Those models overlap, they do not map one to one. A migration that only re-points telemetry ends up with technically correct traces that nobody recognizes, and a set of dashboards that answer questions the business stopped asking.
The agent footprint is the second surprise. A mature AppDynamics deployment is rarely just APM agents. There is a Machine Agent for hosts, a Network Agent, database collectors, browser and mobile RUM, and analytics on top. Replacing that with OpenTelemetry means a Collector with host metrics receivers, Prometheus scraping, log collection, and separate decisions about database and network visibility. The good news is that this is now boring, well documented work. The bad news is that it is several weeks of it, and it is invisible to anyone outside the platform team.
Retention and licensing mechanics matter more here than in a greenfield evaluation. AppDynamics licensing has two generations, an older agent-based model and the infrastructure-based model that meters CPU cores, and licenses bought before February 23, 2021 most likely sit in the agent-based model, where each agent is licensed and metered individually. Transaction analytics events land in an Events Service where retention defaults to 8 days, with 30, 60 or 90 days configurable through the admin page. Teams that assumed years of business transaction history are usually working with weeks of it.
Then there is the part of the estate that cannot move. Cisco's own comparison of the two platforms lists AppDynamics as supporting self-hosted deployment while Observability Cloud does not, and rates AppDynamics as having limited OpenTelemetry and limited Kubernetes support against Observability Cloud's native support for both (Cisco Live session PSOOBS-1904). That asymmetry is the whole decision for a lot of enterprises: the cloud-native half of your estate wants an OTel-native platform, and the air-gapped half wants something that installs on your own hardware. Very few products do both well, which is why the honest answer for some readers is a split.
We evaluate each tool against these criteria:
- Migration path off proprietary agents: what re-instrumentation actually involves, and whether dashboards and alerts can be translated or must be rebuilt
- Hybrid and legacy coverage: on-premises deployment, air-gapped operation, older .NET and Java runtimes, VMs and bare metal
- Kubernetes and autoscaling fit: how the tool discovers workloads and how ephemeral capacity affects the meter
- Instrumentation portability: OTel-native, OTel-compatible, or proprietary, and what stays portable when you leave
- Query and dashboard portability: open query languages and dashboard formats versus proprietary ones
- Signal correlation: whether logs, metrics and traces share a data model or sit in separate stores
- Cost model: the billing dimensions, what behavior they encourage, and how predictable the bill is
- Overhead, sampling and security: agent cost at runtime, sampling defaults, and the compliance posture around captured data
How the best AppDynamics alternatives compare
| Tool | Instrumentation | Deployment | Query surface | Kubernetes and autoscaling | Cost model | Portability on exit |
|---|---|---|---|---|---|---|
| Splunk Observability Cloud | OTel Collector (Splunk distribution), OTLP native | SaaS only | SignalFlow, plus SPL against Splunk logs | Native, with pooled per-host container allocations | Per host/month bundles, plus per-session RUM and per-instance database monitoring | Instrumentation portable, dashboards and detectors proprietary |
| Dynatrace | OneAgent (proprietary) with OTLP ingest alongside | SaaS and Managed (self-hosted) | DQL on Grail | Automatic pod discovery, separate per-pod meter | Consumption rate card, memory-GiB-hour for full-stack hosts plus per-GiB logs | OneAgent instrumentation not portable, OTel data is |
| Dash0 | OpenTelemetry only, operator auto-instrumentation for Java, Node.js, .NET, Python, plus Ruby (opt-in) | SaaS, EU or US region | PromQL across all signals, Perses dashboards | Kubernetes operator, resource-centric model | Per million spans, metric data points, log records and web events, plus Agent0 credits | Instrumentation, PromQL and Perses dashboards portable |
| Datadog | Datadog Agent and tracers, OTLP via DDOT or direct intake | SaaS only | Datadog query language and notebooks | Strong, but per-host meters follow autoscaling | Per product, mostly per host, plus per-GB logs, indexed spans and custom metrics | Agent instrumentation proprietary, OTel path portable |
| New Relic | Agents plus native OTLP ingest | SaaS only | NRQL | Unlimited hosts and agents, ingest is the meter | Per GB ingested plus per-seat user tiers, plus compute units for advanced features | Instrumentation portable via OTLP, NRQL assets are not |
| Grafana Cloud and the LGTM stack | OTel and Prometheus | SaaS or self-hosted, AGPLv3 components | PromQL, LogQL, TraceQL | Strong, Prometheus-shaped | Per active metric series, per GB for logs and traces, per active user, or your own infrastructure | Queries and dashboards portable to a self-hosted stack |
| SigNoz | OpenTelemetry only | Self-hosted (MIT core) or cloud | ClickHouse SQL, query builder, PromQL | Helm chart, ClickHouse is yours to run | Free self-hosted plus infrastructure cost, or per GB on cloud | Instrumentation portable, dashboards are SigNoz JSON |
Pricing sources are linked in each entry. All rates were checked in August 2026 and vendors change them, so treat the models as durable and the numbers as perishable.
1. Splunk Observability Cloud
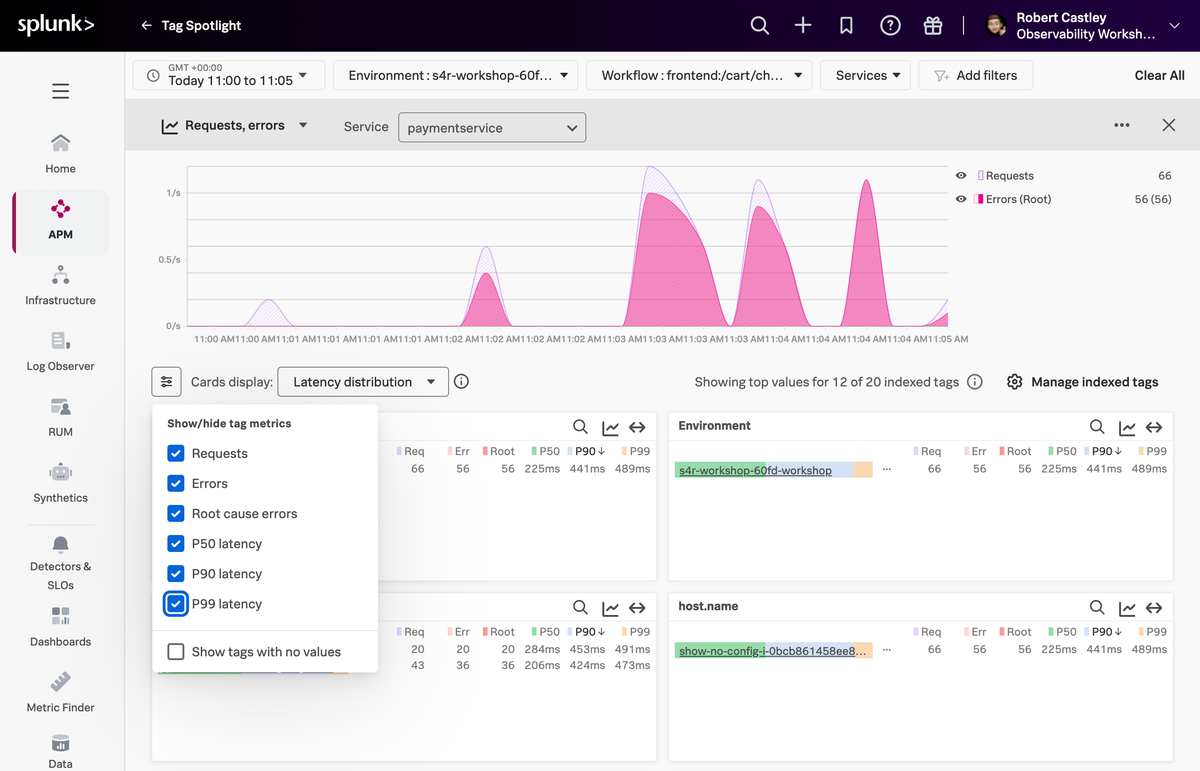
The first alternative to evaluate is the one your account team will propose. Splunk Observability Cloud is the former SignalFx product, now the strategic home for cloud-native application and infrastructure monitoring inside Cisco. It ingests OpenTelemetry natively through the Splunk distribution of the Collector, streams metrics for real-time alerting, and connects to log data you already have in Splunk through Log Observer Connect. Splunk has also shipped migration tooling: a translation tool that shows custom metrics, dashboards and alerts as they exist in AppDynamics next to their Observability Cloud equivalents, with both environments running side by side.
What's good
- The migration is a product, not a project. Nobody else can offer you dashboard translation, contract consolidation and side-by-side running with your existing controller. If your AppDynamics spend sits inside a Cisco enterprise agreement, the commercial path here is shorter than any technical evaluation.
- Streaming architecture for alerting. SignalFlow evaluates metrics as they arrive rather than on a query schedule, which is well suited to detecting fast-moving problems in autoscaled infrastructure. Splunk has been doing this since before OTel existed.
- An unusually usable free tier. Observability Cloud is free for up to 15 hosts with all features included, which is enough to run a real proof of concept against your own workloads rather than a demo environment.
The catch
The split you are being asked to accept is that cloud-native workloads live in Observability Cloud and everything self-managed stays in AppDynamics. Splunk is explicit that Observability Cloud runs in the cloud while AppDynamics is the on-premises option. For a hybrid environment that means two products, two agents and two mental models, held together by integrations rather than a single data model. The promise is convergence. The current state is coexistence.
Container accounting deserves attention before you sign. the Commercial edition allocates 10 containers per host and Enterprise 20, pooled across your hosts, with extra capacity bought a la carte per container or by adding host licenses. Dense Kubernetes nodes running thirty or forty pods will exceed that allocation, and the overflow is a second line item most estimates miss.
Logs are the other structural gap. Observability Cloud does not store your logs, it connects to Splunk. If you are not already a Splunk Cloud or Splunk Enterprise customer, full log search means buying a second product with a completely different pricing model based on Splunk Virtual Compute units or ingest volume.
Pricing model
Observability Cloud bills per host per month in bundles: infrastructure only, application plus infrastructure, or end-to-end that adds RUM and synthetics, with database monitoring and application security billed separately per instance or per host. host counts are averaged: Splunk counts unique hosts reporting each hour, then averages those hourly measurements across the billing month, and APM hosts are counted per minute then averaged. That averaging is materially friendlier to autoscaling than a high-water-mark count, and it is the one pricing detail I would put in front of a finance team.
The model still charges on infrastructure topology, which means it does not care how useful your telemetry is, only how many things emit it. Rich OTel attributes are free, an idle host is not. Combined with Splunk platform pricing for logs, total cost of ownership depends on a second contract you have to model separately. Current rates and definitions are on Splunk's observability pricing FAQ.
The verdict
Pick Splunk Observability Cloud if you are a Cisco or Splunk shop with an enterprise agreement, an ITSI or Enterprise Security footprint, and a hybrid estate where AppDynamics needs to stay alive for the on-premises half anyway. The migration friction is lowest here and the consolidated support relationship is worth real money. Look elsewhere if your reason for leaving AppDynamics was vendor concentration, or if you want one product covering both halves of the estate rather than two that integrate.
2. Dynatrace
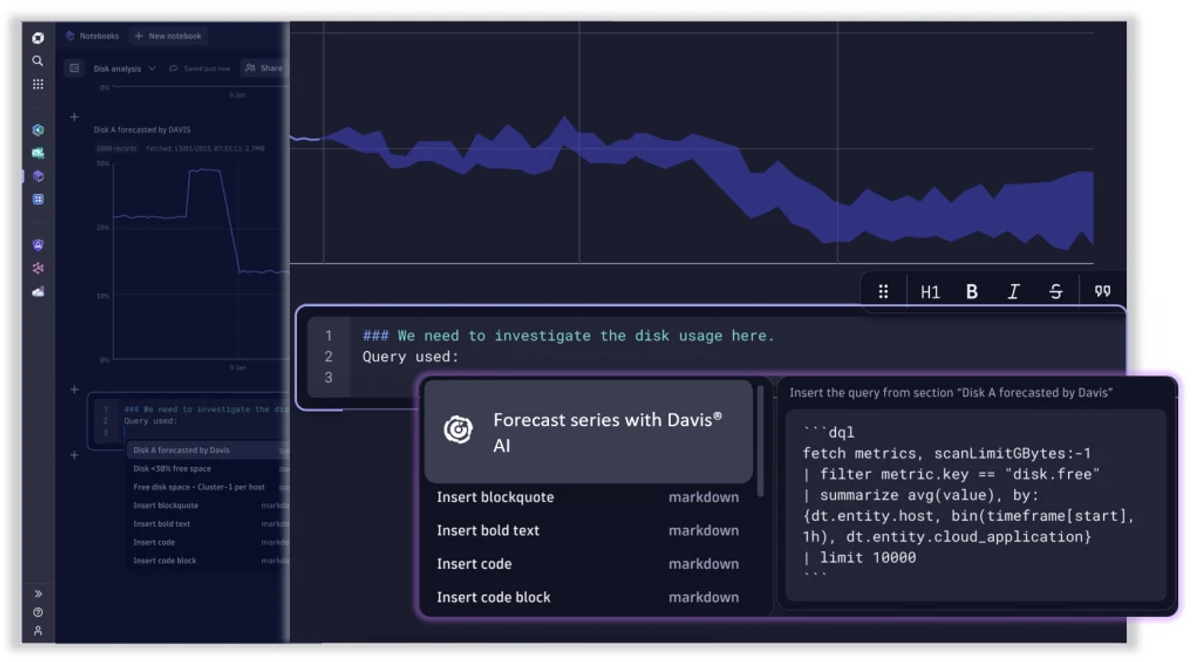
Dynatrace is the most direct replacement for what AppDynamics was bought to do. OneAgent installs once per host, discovers processes automatically, instruments supported runtimes without code changes, and feeds Smartscape topology and Davis root cause analysis. For a team that valued AppDynamics because it worked on applications nobody wants to touch, this is the closest thing to a like-for-like swap, including on-premises through Dynatrace Managed.
What's good
- Automatic beats configured. OneAgent's process discovery and dependency mapping requires less ongoing curation than AppDynamics tiers and nodes, and Davis produces a ranked problem rather than a wall of correlated alerts. On legacy Java and .NET, this is still the strongest automatic instrumentation on the market.
- Self-hosted is a first-class option. Dynatrace Managed runs in your own environment, which keeps regulated and air-gapped workloads in the same product as everything else. Splunk Observability Cloud cannot do this, and neither can most of the SaaS-only tools here.
- Grail unifies query, mostly. DQL queries logs, traces, metrics and events from one store with topology context attached, which is a real improvement over the separate silos Dynatrace shipped a few generations ago.
The catch
OneAgent is proprietary, and everything good about it depends on that. Dynatrace ingests OTLP and supports OpenTelemetry alongside its own instrumentation, but the automatic discovery, Davis analysis and Smartscape topology are built on Dynatrace's own data model. Migrating from AppDynamics agents to OneAgent trades one proprietary agent for another. Your instrumentation is exactly as portable in three years as it is today, which is to say not very.
The commercial process is heavier than the product suggests. Dynatrace sells through an annual Dynatrace Platform Subscription with a minimum commitment it does not publish, and support is priced as a percentage of annualized product fees with a floor reported around $25,000. Small deployments routinely get quoted numbers far above their metered consumption. If you are shopping because AppDynamics procurement was exhausting, this is not an escape from that.
Kubernetes pricing is a separate meter from host monitoring, and the memory-weighted host meter interacts badly with JVM-heavy workloads. A 32 GiB application server costs four times an 8 GiB one for identical traffic, and hosts smaller than the floor are billed at the floor.
Pricing model
Dynatrace bills consumption against a rate card. Full-stack host monitoring is priced per memory-GiB-hour, so your bill scales with allocated RAM rather than with hosts, cores or telemetry volume, with a minimum billed memory per host regardless of actual size. Infrastructure-only monitoring is a flat per-host-hour rate, Kubernetes platform monitoring is per pod-hour, logs are per GiB ingested plus a per-GiB-day retention charge, RUM is per session and synthetics are per action or request.
What this model rewards is deliberate placement: full-stack on the hosts that need code-level tracing, infrastructure-only everywhere else. What it punishes is memory-hungry runtimes and exploratory log retention, and the number of independent meters makes forecasting genuinely hard. Verify against the current rate card on Dynatrace's pricing page before modeling anything.
The verdict
Pick Dynatrace if your estate is heavy on legacy Java and .NET, you need self-hosted deployment for part of it, and your primary requirement is automatic instrumentation with high-quality root cause analysis on applications you cannot refactor. It is the best straight replacement for classic AppDynamics. Skip it if reducing lock-in and procurement complexity is why you started looking, because on both counts this is a lateral move.
3. Dash0
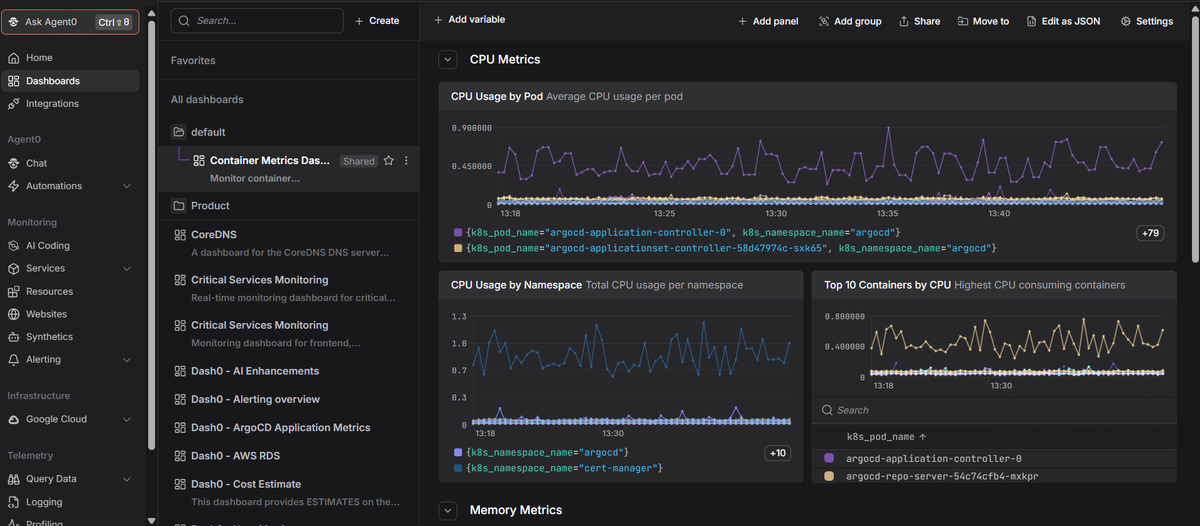
Dash0 is an OpenTelemetry-native platform, which in practice means there is no proprietary agent to install and no vendor SDK to adopt. Ingestion is OTLP, queries are PromQL across every signal, and dashboards are Perses-compatible. The Kubernetes operator installs a Collector, collects cluster and pod metrics, scrapes Prometheus endpoints including ServiceMonitor and PodMonitor CRDs, and automatically instruments Java, Node.js, .NET and Python workloads, with Ruby 3.3+ available as an opt-in. Dash0 also ships Agent0, its autonomous production AI, which investigates issues, drafts dashboards and alerts, and can open pull requests, billed as a separate consumption line.
What's good
- Instrumentation you keep. OTLP in, PromQL and Perses out. Prometheus alert rules and remote-write setups carry over, and existing OTel instrumentation works without a translation layer. If you leave, the collectors and SDKs stay where they are.
- One query language across signals. PromQL for metrics, logs and traces removes the context switch that separate query languages impose, and synthetic metrics compute counts and percentiles from raw spans and logs on demand, with no additional charge on telemetry already sent.
- Cost control that is visible before the invoice. Spam filters reject low-value telemetry before storage and billing, monthly budget limits and a cost forecast are built in, and usage is visible in real time rather than at month end.
The catch
There is no self-hosted or air-gapped deployment. Dash0 is SaaS with a choice of EU or US region, published SOC 2 Type II posture, RBAC, SSO and audit logs in its trust center. If the reason part of your estate is still on AppDynamics is that it must run inside your own network, Dash0 cannot serve that half at all, and no pricing advantage changes that. Check current certification coverage directly if you need HIPAA, FedRAMP or ISO 27001 attestations.
Operator auto-instrumentation covers Java, Node.js, .NET and Python, plus Ruby 3.3+ as an opt-in flag. Go and PHP are not in that list, so those services need manual OTel instrumentation or eBPF tooling. AppDynamics shops running PHP or the C++ SDK will find gaps. Python auto-instrumentation can also skip workloads with conflicting dependency versions, which surfaces as a warning rather than a failure and needs someone to notice it.
Retention is fixed rather than negotiable at the low end: spans, log records and web events are retained for 30 days, with metric data points and synthetic check runs at 13 months. Compliance requirements that demand a year of trace data will not be met. And the AppDynamics capability with no equivalent here is business transaction analytics tied to revenue: you can approximate it with span attributes and PromQL, but there is no Business iQ replacement waiting for you.
Agent0 introduces a second consumption dimension, priced per credit, that is harder to forecast than telemetry volume because it depends on how often your team asks it to work. Useful, but it is a variable line item alongside a variable line item.
The lock-in claim also deserves precision, and it applies here as much as anywhere. OTLP and PromQL keep your instrumentation and queries portable. Views, alert routing, notification channels, synthetic checks and the investigation habits your team builds do not travel, so switching cost drops rather than disappears.
Pricing model
Consumption-based on telemetry item counts: per million spans and span events, per million log records, per million web events, per million metric data points, and per thousand synthetic API check runs, with Agent0 credits billed separately. There are no per-seat fees, no base platform charge and no hidden fees, and the base subscription fee was removed in February 2025, so a month with no telemetry costs nothing. That no-seats principle extends to AI Coding Insights, the first capability in Dash0's Darkplane product: cost there is computed from coding-agent token usage rather than a per-user charge.
Counting items rather than gigabytes changes the incentive. Adding an attribute to a span does not create a new billing dimension, so richly attributed OTel data costs the same as sparse data, which is the opposite of per-GB pricing and of Datadog's custom metrics dimension. High-frequency metrics are the line to watch, because 15-second scrape intervals across many services generate data points fast. Volume still raises the bill, linearly, and the levers are sampling and filtering rather than stripping metadata. Rates are on the pricing page alongside the cost control mechanics.
The verdict
Pick Dash0 if your estate is Kubernetes-shaped, you have committed to OpenTelemetry or are willing to, you want the bill to track telemetry volume rather than infrastructure count, and per-seat pricing has been limiting who on your team can look at production. It fits the cloud-native half of an AppDynamics migration well. It is the wrong choice if you need on-premises deployment, if Go or PHP services dominate your stack, or if business transaction analytics is the feature you cannot lose.
Start a free trial if you want to test it against your own workloads.
4. Datadog
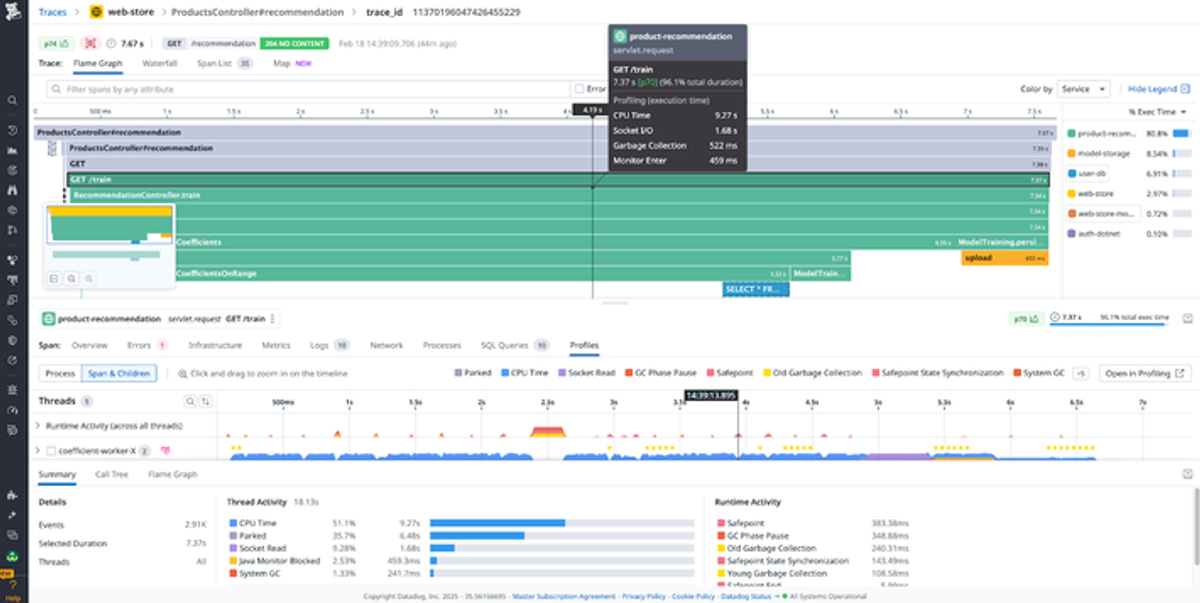
Datadog is where a large share of AppDynamics evaluations end up, mostly because it covers more surface area than anything else: infrastructure, APM, logs, RUM, synthetics, security, database monitoring, CI visibility and several hundred integrations that work on the first try. For teams whose actual complaint about AppDynamics was that it only understood applications, the breadth is the argument.
What's good
- Integration coverage nobody matches. Whatever runs in your estate, there is a maintained integration with a working dashboard. For a platform team replacing a decade of AppDynamics extensions, that catalog removes weeks of work.
- A real OpenTelemetry path. Datadog ships its own distribution of the OTel Collector and accepts OTLP directly through an intake endpoint with no Agent or Collector required. You can instrument with OTel and keep the instrumentation if you leave.
- Product depth per signal. Database Monitoring, Continuous Profiler and Data Streams Monitoring are individually good products, not checkboxes, and they share context with traces.
The catch
The pricing model is the catch, and it is structural rather than a matter of rates. Datadog bills per product on infrastructure topology plus separate meters for data. That means the same telemetry can be charged twice by different dimensions, and it means your bill tracks how many things you run rather than how much value you get. Per-host meters and autoscaling are a poor combination, because Datadog counts hosts hourly and bills near the peak rather than on a monthly average.
Custom metrics are where surprise bills come from, and OTel makes it worse, not better. Metrics arriving over OTLP land in the custom metrics dimension, and under metric name pricing every metric datapoint counts toward ingestion, with the free allowance covering datapoints up to five times your indexed volume and charges above that. A Kubernetes label added by a well-meaning engineer can multiply series counts across every service.
APM allotments are the second trap. Each APM host includes a fixed volume of ingested and indexed spans, and high-throughput services exceed it quickly, with overage billed per million spans. Sampling is the answer, and Datadog's sampling controls are good, but you are now tuning fidelity against price on a per-service basis rather than debugging.
Pricing model
Infrastructure is per host per month with tiered editions, APM is a separate per-host charge that requires the paired infrastructure plan, logs split into per-GB ingestion and per-million-events indexing with retention tiers, custom metrics bill beyond a per-host allotment, RUM bills per thousand sessions and synthetics per test batch. Annual commitments cost meaningfully less than on-demand.
The behavior this model produces is familiar to anyone who has run it: teams strip log verbosity, drop metric tags and index less, which reduces the bill and reduces debuggability at the same time. Datadog's own tools for this, including tiered log storage and metric indexing controls, work well and their existence tells you how much tuning the model demands. Rates are on Datadog's pricing page and the billing mechanics are documented in the custom metrics billing docs.
The verdict
Pick Datadog if you want one vendor for observability and adjacent products, you have the platform maturity to govern custom metrics and log indexing, and breadth of integration matters more than billing predictability. It is a credible, capable replacement and the fastest to get broad coverage from. Avoid it if your AppDynamics exit was driven by cost surprises, because you are swapping per-core surprises for per-host, per-metric and per-span ones.
5. New Relic
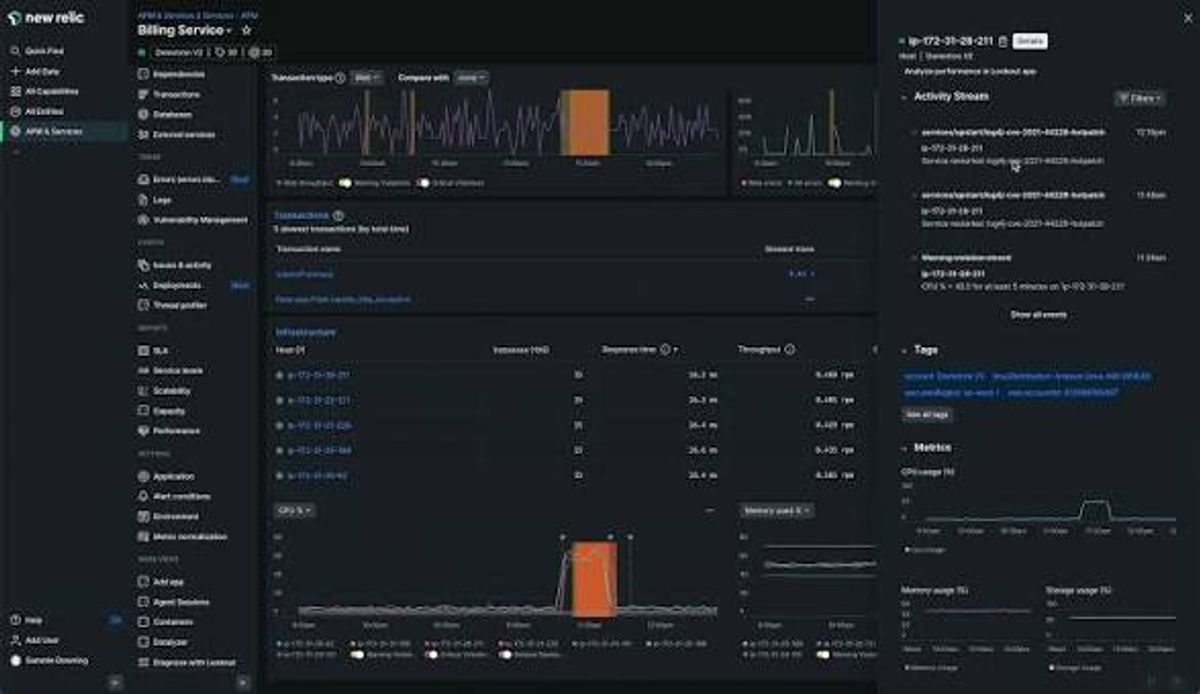
New Relic sits in an interesting position for AppDynamics refugees because it charges on nothing that AppDynamics charged on. Hosts, containers, agents and CPU cores are unlimited. You pay for data ingested and for the people who log in. It is also one of the more committed OTLP ingestion endpoints among the older vendors, treating OpenTelemetry data as a first-class input rather than a translation layer.
What's good
- Infrastructure count stops mattering. Autoscaling, dense Kubernetes nodes and short-lived containers do not move the bill directly. For teams whose per-core AppDynamics licensing punished elasticity, this alone reframes the conversation.
- NRQL is a genuinely good query language. One SQL-like language across metrics, events, logs and traces, with dashboards and alerts built from the same queries. It is proprietary, but it is coherent.
- A free tier you can run production on. 100 GB per month of ingest with one full platform user is enough for a small team to run real workloads, and the paid step up starts low.
The catch
Per-seat pricing is the part that catches teams out, and it is not a small line. Basic users are free but read-only, Core users cost a monthly fee, and Full Platform users, which you need for the full alerting and debugging workflow, cost hundreds per user per month on the higher editions. A fifteen-person engineering team can spend more on seats than on telemetry, which creates exactly the wrong incentive: rationing access to production data during incidents.
Ingest metering has its own edge. The free allowance is not generous once full-stack instrumentation is on, and a verbose logging change or an unsampled trace deployment moves the bill immediately. There is also a separate compute unit dimension for advanced features, which adds a third axis to forecast.
The AppDynamics-specific gap is business context. New Relic can reproduce transaction-level performance data, but there is no equivalent of Business iQ's revenue-linked analytics without building it yourself in NRQL and custom events. That work is doable and it is not free.
Pricing model
Two primary dimensions, ingest and users, with a third for advanced compute. Data is billed per GB above the free allowance, at a higher rate for the Data Plus option that extends retention and adds compliance certifications including HIPAA and FedRAMP Moderate eligibility. User seats are tiered by capability and edition.
Ingest-based pricing is well aligned with cloud-native estates because it decouples cost from infrastructure count, and it is honest about what drives storage cost. What it discourages is high-cardinality richness in logs and traces, since verbosity is the meter. What per-seat pricing discourages is broad access, and that trade-off is worth thinking about before you commit. Current rates are on New Relic's pricing page.
The verdict
Pick New Relic if you run elastic infrastructure with a relatively small group of people who need full platform access, you want OTLP ingestion into a mature platform, and regulated workloads need HIPAA or FedRAMP coverage from a SaaS vendor. Think carefully if your organization needs dozens of engineers in the tool during incidents, because seat costs will dominate everything else on the invoice.
6. Grafana Cloud and the LGTM stack
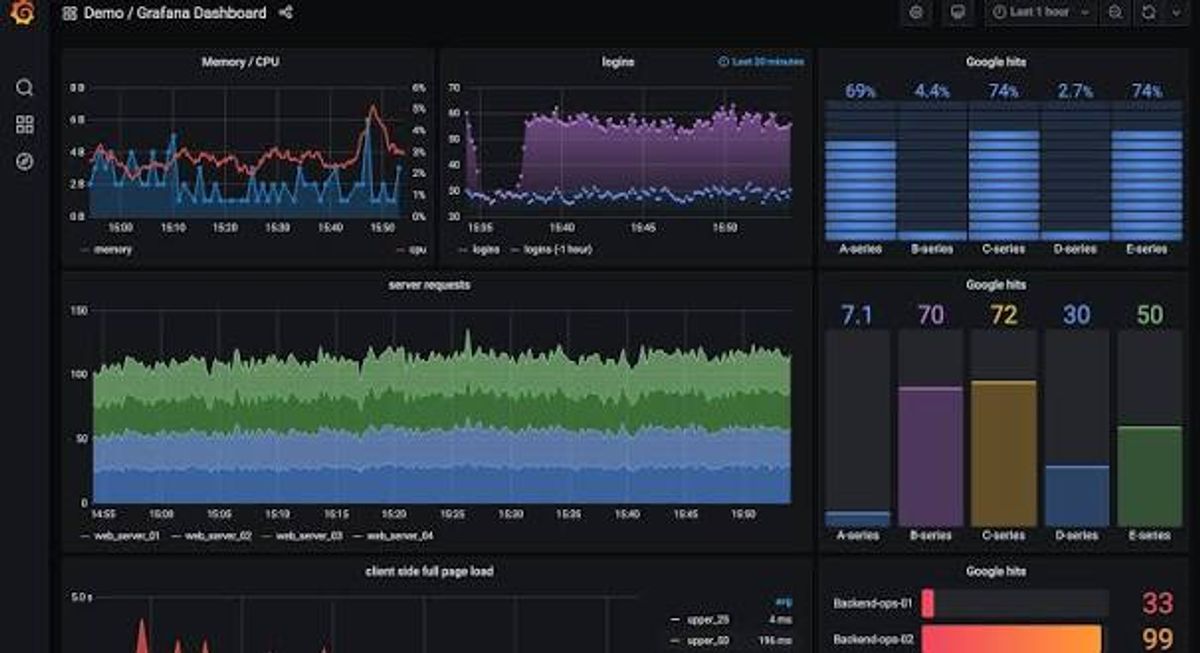
Grafana is the open-source answer, in two forms: run the stack yourself on your own infrastructure, or buy the managed version. The self-hosted route gives you Prometheus-compatible metrics, log and trace backends, and Grafana for visualization, all under open licenses. Many AppDynamics teams already run half of it for infrastructure metrics without calling it their observability platform.
What's good
- Your team already knows the query language. PromQL skills transfer directly, existing recording rules and alerts work, and dashboards built here survive a move between managed and self-hosted. That is the strongest portability story of any option in this comparison.
- The exit is credible. Because the backends are open source and the managed service runs the same components, moving from Grafana Cloud to self-hosted is an infrastructure project rather than a re-instrumentation project.
- A generous free tier. Roughly 10,000 metric series, 50 GB each of logs and traces, and a handful of users at no cost, with 14-day retention. Enough to evaluate seriously.
The catch
Separate backends per signal mean separate operational surfaces, separate query languages for logs and traces, and correlation that depends on your instrumentation being disciplined about resource attributes. Grafana has closed a lot of this gap, and it is still not the same experience as a single store with one query language. Coming from AppDynamics, where correlation was assumed, this feels like assembly.
Self-hosting is real work. Object storage layout, ingester scaling, compaction, retention policy and cardinality management become someone's job, and that someone needs to exist before you commit. Cardinality is the specific failure mode: a metrics backend that falls over at 3am because a label started containing pod IDs is a Grafana-shaped problem, not a vendor-shaped one.
Grafana Labs monetizes an open-source stack, which shapes where investment goes. The cost-optimization features that matter most at scale, the adaptive telemetry capabilities that aggregate unused series and drop rarely-queried log patterns, sit in higher commercial tiers with a five-figure annual floor. The tier that needs them most is often the tier that cannot buy them.
Pricing model
Grafana Cloud meters per active metric series, per GB for logs and traces with separate processing, write and retention components, and per active user for visualization, on top of a small platform fee. Self-hosted costs you compute, storage and engineering time instead.
The per-active-series meter makes cardinality a direct financial signal, which is either healthy discipline or a recurring argument with application teams, depending on your organization. Per-active-user pricing has the same access-rationing effect as elsewhere. The self-hosted path removes the license question entirely and replaces it with an infrastructure bill you control and an on-call rotation you own. Check current rates on Grafana Labs' pricing page.
The verdict
Pick the Grafana route if you have a platform team with capacity, a Prometheus-shaped stack already, and a strong preference for owning your data and your exit. Self-host if data residency or air-gapped operation is non-negotiable and you can staff it. Choose something managed and correlated instead if your team is small, because the total cost of an under-resourced self-hosted stack is measured in incident duration, not dollars.
7. SigNoz
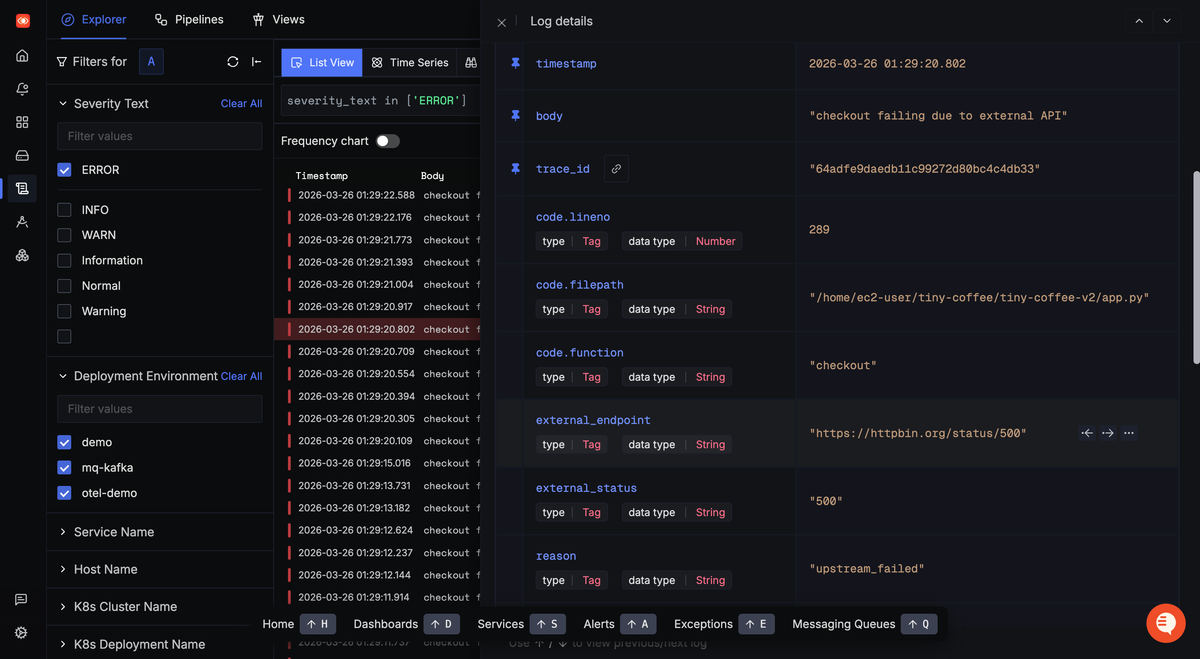
SigNoz is the closest thing to a single-product open-source replacement for AppDynamics: APM, traces, logs, metrics and exceptions in one UI, built on ClickHouse, with OpenTelemetry as the only ingestion path. The core is MIT licensed, with enterprise features under a separate license in the ee/ directory of the repository. You can run it yourself or buy the managed cloud version.
What's good
- One product, not four. Unlike assembling a stack, SigNoz gives you correlated signals in a single install. Teams migrating from a commercial APM tool recognize the shape of it immediately, which matters when you are asking AppDynamics users to change tools.
- ClickHouse handles awkward queries well. High-cardinality trace queries and full-text log search are fast, and SQL access to your telemetry is useful in ways a proprietary query language is not.
- OTel-only ingestion is a feature. There is no proprietary agent, so instrumentation you build here works with any other OTel backend later. That is the same portability argument the OTel-native SaaS vendors make, without the SaaS.
The catch
OTel-only ingestion is also the constraint. If parts of your estate cannot emit OpenTelemetry yet, and AppDynamics shops usually have some, there is no vendor agent to fall back on. That work moves onto your roadmap before SigNoz can see those services.
Running ClickHouse at production scale is the real cost. Retention policy, cluster sizing, compaction and schema migrations become your responsibility, and there is no fully open-source managed ClickHouse to hide behind. Community discussion around cluster coordination requirements is worth reading before you design the topology. A three-node cluster is cheap; the engineer who understands it at 3am is not.
The integration catalog is thinner than the commercial platforms, RUM coverage is limited compared to AppDynamics browser and mobile monitoring, and cloud region availability is narrower than the large vendors. Enterprise procurement teams will also have questions about the mixed license that a pure Apache 2.0 project would not raise.
Pricing model
Self-hosted is free software plus your infrastructure and engineering cost. The cloud offering bills per GB for logs and traces, per million samples for metrics, with a monthly base that includes some usage and an enterprise tier for dedicated or bring-your-own-cloud deployments.
Per-GB cloud pricing encourages the usual trimming of verbose telemetry, though at rates low enough that the pressure is milder than with the large vendors. Self-hosted has the most honest cost model of anything here, because you pay for the resources you consume and nothing else, and the least predictable one, because your bill includes engineering time nobody puts on a spreadsheet.
The verdict
Pick SigNoz if you want an open-source, self-hosted platform with a single correlated UI, you have already committed to OpenTelemetry, and you have or can hire ClickHouse competence. It is the strongest single-product open-source option for a team replacing commercial APM. Pass if your team is small, if you need broad out-of-the-box integrations immediately, or if part of your estate cannot emit OTel in the next two quarters.
Which tool fits your situation
If your estate is hybrid and part of it is air-gapped, keep Splunk AppDynamics for the self-managed half and add a second tool for cloud-native workloads, or consolidate on Dynatrace Managed, which is the only commercial option here that runs on your own hardware and handles both. A split is not a failure, and pretending one product covers both usually costs more than admitting it does not.
If your AppDynamics spend sits inside a Cisco enterprise agreement, evaluate Splunk Observability Cloud first and take the dashboard translation tooling seriously. The commercial and migration friction is lower than anything else, and the host-averaging behavior in its pricing is better suited to autoscaling than most per-host models.
If your requirement is automatic instrumentation on applications nobody will refactor, Dynatrace is the closest replacement and the honest recommendation, lock-in included. OneAgent on legacy Java and .NET still does things OTel auto-instrumentation does not.
If you are Kubernetes-first, committed to OpenTelemetry, and want everyone on the team able to look at production, Dash0 fits: no per-seat fees, per-signal billing that does not penalize rich attributes, PromQL across signals and a Kubernetes operator that gets you data in minutes. Its Kubernetes monitoring and distributed tracing coverage is where it earns its place, and its lack of a self-hosted option is where it loses deals.
If you want one vendor across observability and adjacent products, Datadog has the deepest catalog and the most product surface. Budget for governance of custom metrics and log indexing from day one, not after the first invoice shock.
If your infrastructure is elastic and only a handful of people need full access, New Relic's ingest-plus-seats model removes host counting from the equation entirely, and the Data Plus option covers HIPAA and FedRAMP Moderate eligibility.
If you have platform engineering capacity and want to own your data outright, self-host the Grafana stack or SigNoz. Grafana if you are Prometheus-shaped and want maximum query portability, SigNoz if you want one correlated product and can run ClickHouse.
If your evaluation shortlist also includes IBM Instana, which is a common comparison for AppDynamics shops with traditional applications, we cover it separately in 8 Best IBM Instana Alternatives.
Final thoughts
The seven options here represent four distinct bets. Staying inside the Splunk portfolio bets that consolidation and migration tooling beat technical fit. Dynatrace bets that automatic proprietary instrumentation is worth renewed lock-in, which for legacy-heavy estates is a defensible trade. Datadog and New Relic bet on breadth and maturity, priced on infrastructure topology and on ingest plus seats respectively. Grafana and SigNoz bet that you would rather own the operational burden than the vendor relationship.
The gap most AppDynamics migrations fall into sits between those bets: teams that have already moved to Kubernetes and OpenTelemetry, that want managed infrastructure without a proprietary agent, and that need the bill to track telemetry volume rather than core counts or seat counts. That is the specific space Dash0 occupies, with OTLP ingestion, PromQL across every signal, Perses-compatible dashboards and per-signal pricing with no seat fee on the observability side. It does not cover the air-gapped half of a hybrid estate, and if that half is your priority, one of the other options above is the better answer.
Sign up for a free Dash0 account with 14 days of unlimited access, no credit card required.
Frequently asked questions
Is AppDynamics being discontinued?
No. AppDynamics is now Splunk AppDynamics and Splunk continues to invest in it, positioning it for self-managed, air-gapped and heavily regulated environments while Splunk Observability Cloud takes cloud-native workloads. The practical consequence is that new cloud-native capability lands in a different product with a different agent, so hybrid estates end up running both.
What is the closest alternative to AppDynamics?
Dynatrace, for most definitions of close. It offers automatic instrumentation through a single proprietary agent, works well on legacy Java and .NET, provides AI-driven root cause analysis, and supports self-hosted deployment through Dynatrace Managed. The trade-off is that you are exchanging one proprietary agent for another.
Can I replace AppDynamics with an open-source tool?
Yes, with a platform team. SigNoz gives you a single correlated product on ClickHouse under a mixed MIT and enterprise license, and the Grafana stack gives you Prometheus-compatible metrics with the strongest query portability. Both require OpenTelemetry instrumentation and both move ClickHouse or object-storage operations onto your team.
How long does migrating off AppDynamics take?
Instrumentation is usually the fast part, often a few weeks with an operator or Collector rollout. Rebuilding dashboards, health rules and alert routing takes longer, and business transaction analytics has no direct equivalent outside AppDynamics. Plan to run both systems in parallel through at least one full release cycle.