

Instana earned its reputation on one thing: you dropped in the host agent, and a few minutes later you had a live dependency map, one-second metric granularity, and unsampled traces across every service, with almost no manual instrumentation. For teams drowning in microservices, that automation felt like magic. It still works well.
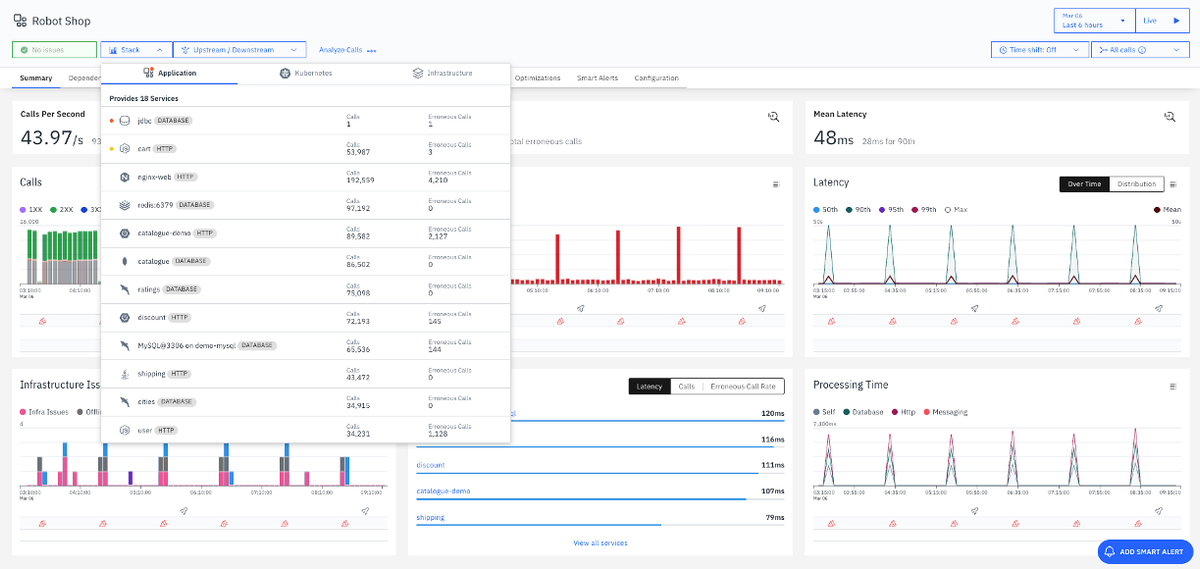 So why are you reading a list of alternatives? Usually one of three reasons. The bill grew. Instana's licensing is anchored to a per-host, per-Managed-Virtual-Server model, and in a containerized world where a single node can host dozens of short-lived workloads, host-shaped pricing tends to drift away from the value you get. The second reason is strategic: since the 2020 acquisition by IBM, Instana lives inside a large enterprise portfolio, and teams standardizing on OpenTelemetry want a backend that treats OTel as the primary data model rather than as an ingest path into a proprietary engine. The third is simpler. Your stack changed, you adopted OTel and Prometheus everywhere, and you want your observability tool to speak those standards natively.
Whatever brought you here, the hard part is that "APM and observability" is a crowded category where every vendor claims to do everything. The differences that matter are architectural, and they hide behind similar-looking feature grids. This guide compares eight platforms an Instana user would realistically shortlist, with a bias toward commercial products that can carry enterprise workloads. The focus is on the decisions you'll actually live with: how each tool instruments your code, what its bill scales on, how much of your setup is portable if you leave, and where its automated root cause analysis genuinely helps.
What makes replacing Instana hard
An Instana migration isn't just about adding a bunch of new features. Every platform here does metrics, logs, and traces. The real questions are structural, and they surface months after you sign.
The first is the instrumentation model. Instana's strength is its agent: proprietary auto-discovery and AutoTrace that captures full-fidelity traces with little configuration. That convenience is also the lock-in. When you move, you either re-instrument or you inherit a new vendor's agent and its own set of assumptions. Tools that are OpenTelemetry-native change this calculus, because your instrumentation lives in the OTel SDKs and Collector rather than in the vendor. Instana itself supports OpenTelemetry ingestion for all signals, but the automation that makes it Instana runs through its host agent, not through OTel. One platform on this list, Dash0, was founded by Instana's own co-founder specifically to build an OTel-native core rather than bolt OTel onto a proprietary agent.
The second is the cost model, and it's where budgets go to die. Per-host pricing punishes density. Per-GB ingest pricing punishes rich, high-cardinality telemetry, which is exactly the data you want during an incident. Per-user pricing quietly limits who on your team can even look at production. Persisted-data and consumption models shift the lever to volume. None of these is wrong, but each one incentivizes a different behavior, and you want the incentive to point toward good observability rather than against it.
The third is query and workflow portability. OpenTelemetry solves instrumentation and transport portability. It does not solve the rest. Your dashboards, alert rules, saved queries, investigation runbooks, and RBAC policies all create switching cost even on the most open platform. A tool that gives you PromQL across every signal and Perses-compatible dashboards keeps more of that portable than one with a bespoke query language per signal.
The fourth is automated root cause. This was Instana's headline, and it's genuinely useful. But "AI-powered RCA" means very different things across vendors. Some build it on a real-time topology graph. Some correlate after the fact over raw data. The quality depends almost entirely on whether the tool controls and normalizes the underlying data.
We'll evaluate each tool against these criteria:
- Instrumentation model: proprietary auto-agent, OTel-native, or OTel ingestion bolted onto a proprietary core
- Signal coverage: metrics, logs, traces, plus RUM, synthetics, and profiling where relevant
- Query language: one language across signals versus a separate language per backend
- Automated root cause: how topology and AI are used, and what they depend on
- Deployment: SaaS-only versus self-managed or on-prem options
- Cost model: the billing dimensions and how predictable the monthly bill is
- Lock-in profile: what stays portable when you leave, and what doesn't
The entries below are grouped from the established enterprise APM incumbents to the OpenTelemetry-native and open-standards platforms. They are not ranked.
How they compare
| Tool | Instrumentation | Signals | Query language | Deployment | Cost model | Lock-in profile |
|---|---|---|---|---|---|---|
| Dynatrace | OneAgent (proprietary), OTLP ingest | M, L, T, RUM, synthetics, profiling, security | DQL | SaaS, managed on-prem | Consumption per GiB-hour + capability units | High (OneAgent, Grail, DQL) |
| Datadog | Datadog Agent, OTLP ingest | M, L, T, RUM, synthetics, profiling, security | Proprietary + tag filters | SaaS only | Per-host + indexed spans + custom metrics + per-GB logs | High (agent, dashboards, monitors) |
| New Relic | Agents + OTLP ingest | M, L, T, RUM, synthetics, profiling | NRQL | SaaS only | Per-GB ingest + per-seat + compute (CCU) | Medium-high (NRQL, dashboards) |
| Splunk Observability Cloud | OTel Collector (Splunk distro), agents | M, T, RUM, synthetics; logs via Splunk platform | SignalFlow / SPL | SaaS only | Per-host tiers + separate log platform | High (SPL, separate log product) |
| Chronosphere | OTel-native ingest, Prometheus | M, L, T | PromQL + own UI | SaaS, private options | Persisted-data credits (quote-only) | Medium (open ingest, own control plane) |
| Grafana Cloud | OTel + Prometheus + agents | M, L, T, profiling, RUM, synthetics | PromQL, LogQL, TraceQL (per signal) | SaaS, self-managed OSS | Per active series + per-GB + per-user + platform fee | Medium (open backends, per-signal query) |
| Elastic Observability | EDOT (OTel distro), Elastic agents | M, L, T, RUM, synthetics, profiling | ES|QL, KQL, Lucene | SaaS, serverless, self-managed | Resource-based or serverless consumption (ECU) | Medium (OTel-native, Elastic query langs) |
| Dash0 | OTel-native (SDKs, Collector, operator) | M, L, T, RUM, synthetics | PromQL across signals | SaaS only | Per-signal (data points, spans, logs) | Low on instrumentation, medium on config |
M = metrics, L = logs, T = traces. Pricing models are summarized; see each entry for detail and sources.
1. Dynatrace
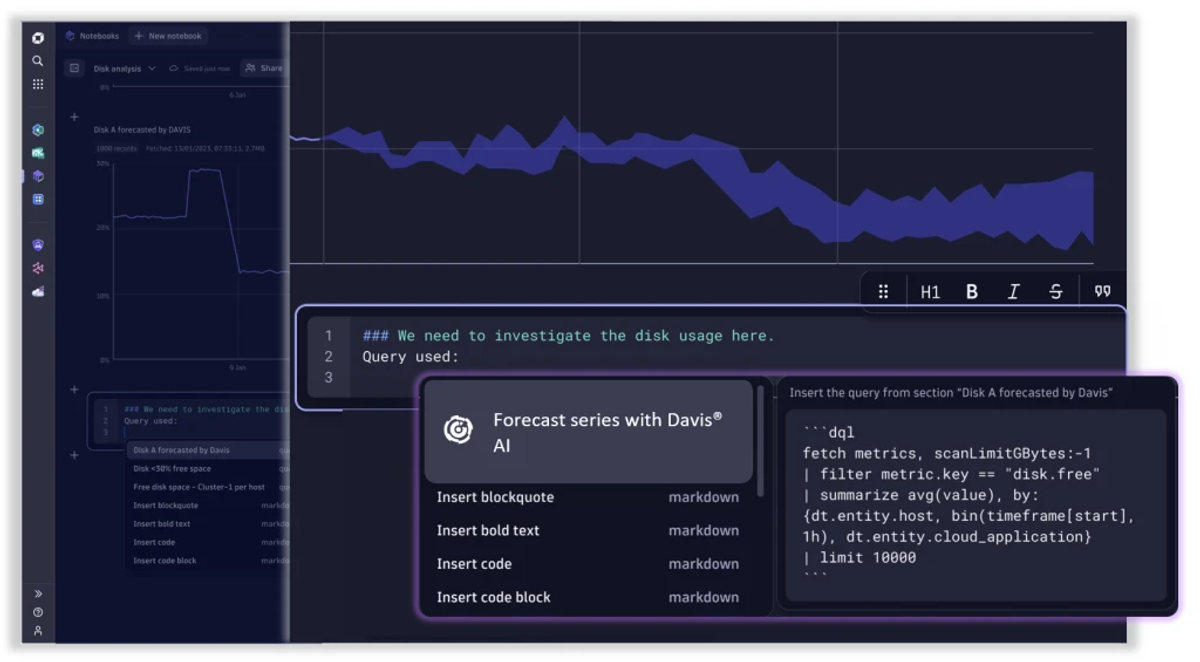
Dynatrace is the tool most Instana buyers cross-shop first, because the two share a philosophy. Both lean on a smart proprietary agent that auto-discovers your environment and feeds an AI engine. Dynatrace's OneAgent installs per host, builds the Smartscape topology of what depends on what, and pipes everything into Grail, a unified store for logs, metrics, traces, and events. Davis, its causal AI, sits on top of that topology to attribute root cause.
What's good
- Automated topology and causal RCA. Davis has been built on causal inference since 2018, and it works because Smartscape gives it a real dependency graph rather than loose correlations. For teams whose main pain is "something broke, tell me what and why," this is the strongest automated answer in the category.
- Full-stack depth from one agent. OneAgent covers infrastructure, application traces, code-level profiling, and Kubernetes without you wiring up separate collectors. In complex, fast-changing environments this is real operational leverage.
- Enterprise coverage and maturity. Broad integrations, mature RBAC, and managed on-prem options make it a fit for regulated, hybrid estates, which is squarely Instana's home turf too.
The catch
The power comes bound to the platform. OneAgent and DQL, Dynatrace's query language, are proprietary, so your investigation workflows and queries don't travel. Dynatrace ingests OpenTelemetry over OTLP, but the automation you're paying for is anchored to OneAgent, not to your OTel pipeline, which means an OTel-first team gets less of the platform's value.
Cost forecasting is the other recurring complaint. Billing runs across several consumption meters and capability units, and it's common to hear about month-end surprises as usage scales. There's no permanent free tier, only a 15-day trial, and procurement is sales-led, so self-service evaluation is limited.
Pricing model
Dynatrace prices on a consumption model, the Dynatrace Platform Subscription. Full-Stack Monitoring is billed around $0.01 per memory GiB-hour, infrastructure monitoring at roughly $0.04 per host-hour, and Kubernetes platform monitoring at about $0.002 per pod-hour, with log ingest near $0.20 per GB. The GiB-hour basis is friendlier to containerized density than pure per-host pricing. The friction is the number of dimensions: synthetic monitoring, security modules, and Davis features each draw capability units at their own rates, and that breadth is what makes the total hard to predict before you're running at scale. Below roughly 100 hosts, the per-unit rate tends to be uncompetitive without a negotiated discount.
The verdict
Pick Dynatrace if automated root cause is the reason you bought Instana in the first place and you want to keep that model, at a larger scale and with deeper full-stack coverage. Go in clear-eyed that you're trading one proprietary-agent relationship for another, and budget time for cost governance. If your team is standardizing on OpenTelemetry and wants the platform to be built around that, this is not the closest match.
2. Datadog
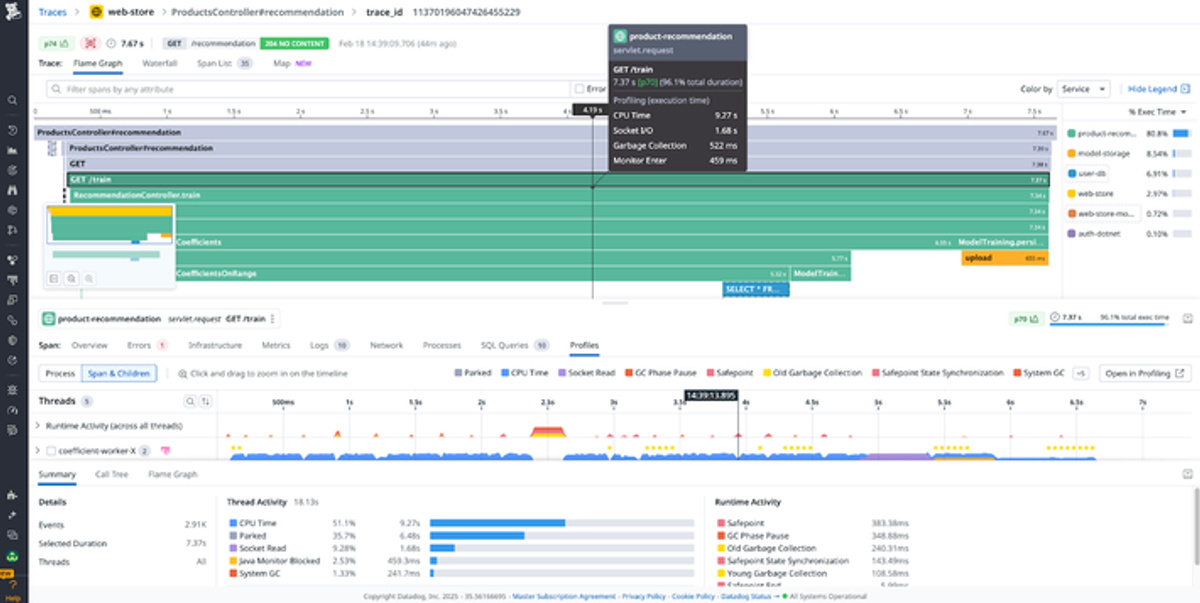
Datadog is the default broad observability platform, and for good reason. It does more things, integrates with more systems, and polishes more surfaces than almost anyone. If Instana felt narrow, Datadog is the opposite: metrics, APM, logs, RUM, synthetics, profiling, security, and a long tail of adjacent products, all in one pane.
What's good
- Breadth and integration coverage. Hundreds of integrations mean most of your stack is monitored out of the box, and the auto-instrumentation across major runtimes is genuinely good.
- A coherent product experience. The dashboards, monitors, and notebooks feel like one product rather than stitched parts, which lowers the learning curve for mixed teams.
- Strong APM fundamentals. Distributed tracing, service maps, and continuous profiler cover the ground Instana users care about, with a deeper feature surface around it.
The catch
Datadog is OpenTelemetry-compatible, not OpenTelemetry-native. You can ship OTLP to a Datadog Agent, but the platform is built around Datadog's own agent and data model, so your leverage from OTel is limited and your dashboards and monitors stay proprietary.
The bigger issue is that Datadog's business model is aligned with your data volume growing, and the pricing reflects it. Metrics sent via OpenTelemetry are billed as custom metrics, and a standard Kubernetes cluster can generate thousands of series before you write a line of your own. Host counting uses a high-water mark, so a brief scaling event can set your bill for the whole month, and a misconfigured agent in a containerized environment can multiply host counts fast. Logs are billed twice, once to ingest and again to index. None of this is hidden, but it all compounds.
Pricing model
APM lists at $31 per host per month on the infrastructure pricing model, or $36 to $47 per host standalone across APM tiers, billed annually. Each APM host includes one million indexed spans, then overage applies per million after that, which means a few busy microservices can add real cost on top of the per-host fee even with sampling. The model charges on hosts, indexed spans, custom metrics, and per-GB logs at once, and those dimensions interact: adding richer tags raises custom-metric counts, and scaling out raises host counts. It's predictable only if you invest in tag governance and sampling discipline. Larger accounts negotiate discounts, but the list model rewards more data, not better data.
The verdict
Choose Datadog if breadth and out-of-the-box coverage matter more than pricing purity, and you have the discipline (or the FinOps function) to keep custom metrics, host counts, and log indexing under control. If you're leaving Instana specifically to escape opaque, volume-driven bills, Datadog solves the vendor-stewardship worry but not the cost-model worry.
3. New Relic
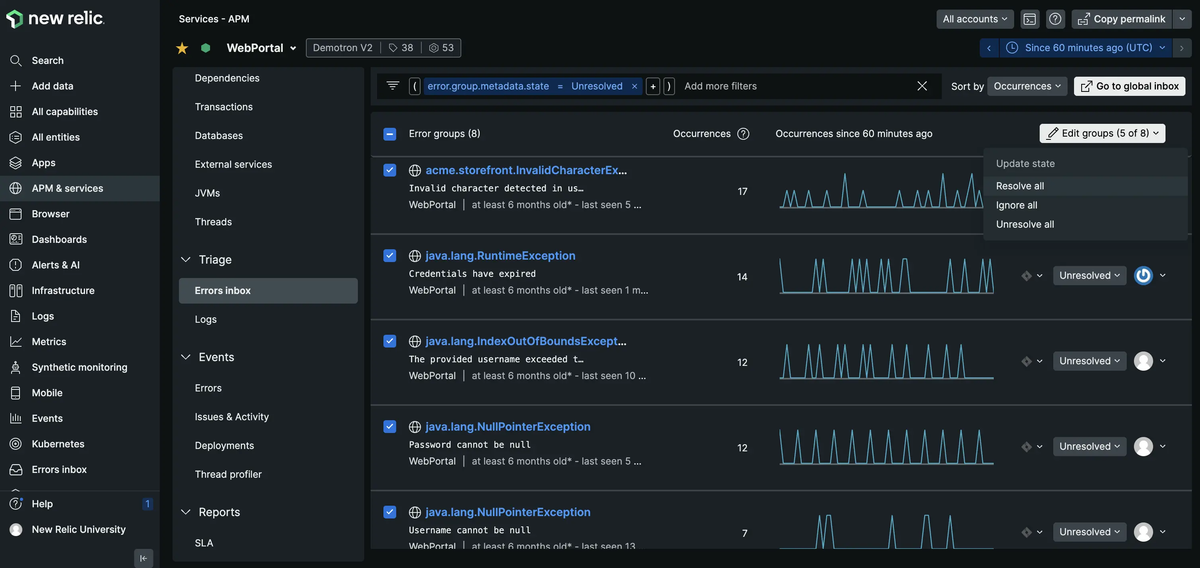
New Relic rebuilt its pricing years ago around a simpler idea than the per-host norm: charge for the data you send and the people who use the platform, and stop charging for hosts, containers, and agents entirely. For an Instana team frustrated by host-based licensing in a containerized world, that reframing is the appeal.
What's good
- Unlimited hosts and agents. You don't pay per node or per container, which decouples your bill from infrastructure density. That alone fixes one of the most common Instana cost complaints.
- A single ingest meter for all telemetry. Metrics, logs, traces, and events flow into one pool measured in gigabytes, which is easier to reason about than several parallel meters.
- Native OpenTelemetry ingestion. OTLP traces, metrics, and logs are first-class, so existing OTel instrumentation carries over without re-instrumentation.
The catch
The bill moves on two independent axes, data and users, and they compound. A busier release cycle raises ingest while a new hire raises seats, and both land on the same invoice. Past roughly five to ten engineers and a few hundred GB per month, the total stops tracking with intuition. Ingest volume is also harder to forecast than host count, so a single noisy service can shift the bill.
New Relic supports OpenTelemetry, but NRQL, its query language, and the deeper platform features are proprietary. Your queries and dashboards don't move with you. And the jump from the Standard edition's user cap into Pro pricing is the steepest step in the model, so team growth can trigger a larger increase than expected.
Pricing model
Every account includes 100 GB of ingest per month free. Beyond that, data is $0.40 per GB on the Original Data option with short default retention, or $0.60 per GB on Data Plus with 90-day retention and compliance features most non-regulated teams don't need. Users are tiered: basic users are free, with Core and Full Platform seats priced per month on top of ingest. There's also a compute dimension, Compute Capacity Units, for advanced features, and its rates aren't public. The single ingest meter is genuinely simpler than Datadog's stack of charges, and unlimited hosts is a real advantage for dense fleets. The caveat is that two uncapped axes still compound, so model both your data growth and your headcount before committing.
The verdict
New Relic is a strong fit if your Instana pain was host-based licensing and you'd rather pay for data and access. It suits teams with predictable ingest and a stable core of platform users. If your telemetry volume is spiky or your whole org needs query access, price out the ingest and seat axes together first, because that's where it gets expensive.
4. Splunk Observability Cloud
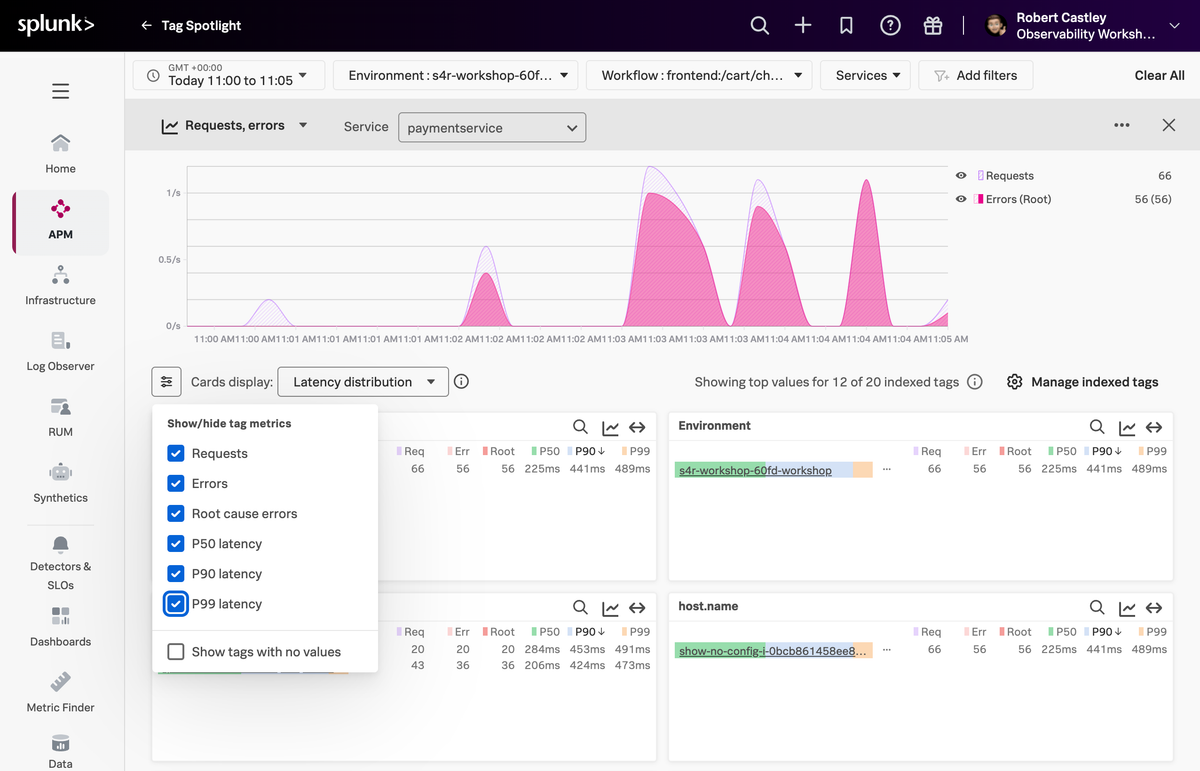
Splunk Observability Cloud grew out of the SignalFx and Omnition acquisitions, and it's a credible enterprise APM and metrics platform, now part of Cisco. Its calling card is real-time streaming analytics on high-cardinality metrics and NoSample tracing, which keeps full-fidelity traces rather than dropping them, a philosophy Instana users will recognize.
What's good
- NoSample full-fidelity tracing. Splunk ingests complete trace data rather than head-sampling, which preserves the rare error traces that sampling tends to throw away.
- High-cardinality metrics analytics. The streaming engine handles high-dimensionality metrics well, useful for large Kubernetes and microservice estates.
- Enterprise and Cisco ecosystem fit. For organizations already inside Cisco enterprise agreements or using Splunk for security, the bundling and shared tooling are practical advantages.
The catch
Logs are the gap. Splunk Observability Cloud handles metrics, traces, RUM, and synthetics, but log management typically means buying the separate Splunk platform and integrating at the dashboard layer, which adds cost and a second query language. That split matters for an Instana team used to logs, metrics, and traces in one place.
The query story is also fragmented across SignalFlow and SPL, and SPL in particular carries a learning curve. Custom metrics are governed by per-host time-series entitlements with overages beyond them. The Cisco acquisition, which closed in early 2024, hasn't repriced the platform much, but it has shifted the roadmap and bundling toward Cisco's frameworks, which is worth factoring into a multi-year commitment.
Pricing model
Observability Cloud publishes transparent per-host tiers: $15 per host per month for infrastructure, around $60 for the app-and-infrastructure bundle, and $75 for the end-to-end package, all on annual commitment. Standalone APM lists near $55 per host. Per-host pricing is easy to reason about up front, which is a genuine plus, but it carries the same density problem as Instana in containerized environments, and the log-platform dependency means the observability bill is only part of the total. If you need logs alongside traces and metrics, price the Splunk platform in from the start rather than treating it as an add-on.
The verdict
Splunk Observability Cloud fits enterprises already committed to Splunk or Cisco, especially those that value NoSample tracing and high-cardinality metrics and can absorb the separate log platform. If you're leaving Instana to consolidate logs, metrics, and traces under one roof with one query language, the split architecture works against that goal.
5. Chronosphere
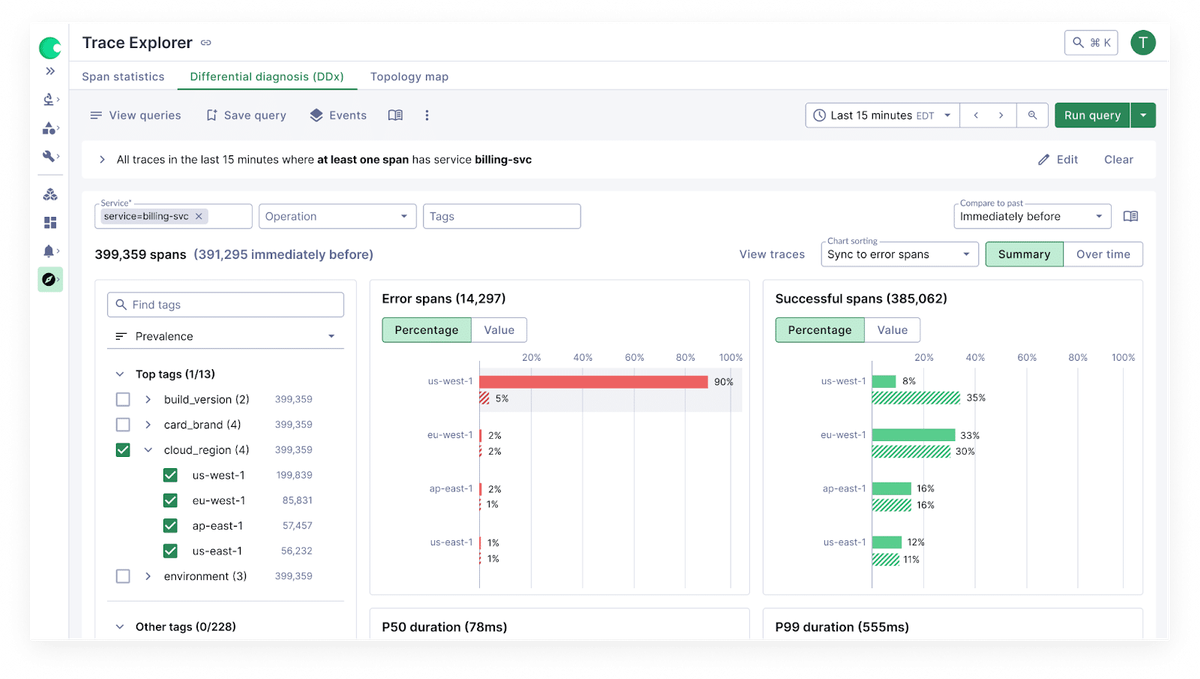
Chronosphere approaches the problem from a different angle than the APM incumbents. It's built for large cloud-native organizations whose central pain is telemetry volume and cost, and its defining piece is the Control Plane, which aggregates, downsamples, and drops low-value data before it's ever persisted. Now part of Palo Alto Networks, it has been a Gartner Magic Quadrant Leader for observability platforms for three consecutive years.
What's good
- Best-in-class telemetry cost control. The Control Plane gives teams per-team quotas and real-time visibility into what's being ingested, persisted, and dropped. Chronosphere reports customers cutting data volume by large margins, often well over half, and it ranked first for the cost-control use case in Gartner's 2026 Critical Capabilities.
- Open ingestion standards. It's OpenTelemetry-native on ingest and supports Prometheus, PromQL, Fluent Bit, and Alertmanager-style workflows, so your collection stays on open standards.
- Scale reliability. It's engineered for very high-volume metrics workloads, which is why large SRE organizations adopt it.
The catch
Chronosphere is not aimed at small teams, and it doesn't pretend to be. The advanced metric-shaping and cost-optimization features carry a real learning curve, and the value only materializes once you're at a scale where telemetry cost is a board-level line item. It's also historically been metrics-first, with traces and logs added later, so evaluate its APM-style depth carefully against a tracing-first tool if that's your priority.
Pricing is quote-only. The pricing page isn't public, which makes self-service evaluation impossible and puts you in a sales-led process from the start. The Palo Alto Networks acquisition, completed in January 2026, also introduces packaging uncertainty as the product integrates with the broader security portfolio.
Pricing model
Chronosphere charges for useful retained, or persisted, data after Control Plane shaping, using a fungible credits model rather than per host, agent, or user. Its Telemetry Pipeline is priced separately on raw throughput. The model is well matched to the category, because you're billed on the data you decide to keep, not on every raw byte or every node, which is the opposite of per-host pricing. The downside for planning is that nothing is published, so you can't estimate a bill before engaging sales, and credit pools, ingestion limits, and retention are all defined per contract.
The verdict
Chronosphere is the right call for large, fast-scaling engineering organizations where telemetry cost and cardinality are the primary problem and you have a platform team to run the shaping. If you're a mid-sized team wanting turnkey APM with automated root cause, or you need published pricing to evaluate at all, it's more platform than you need.
6. Grafana Cloud
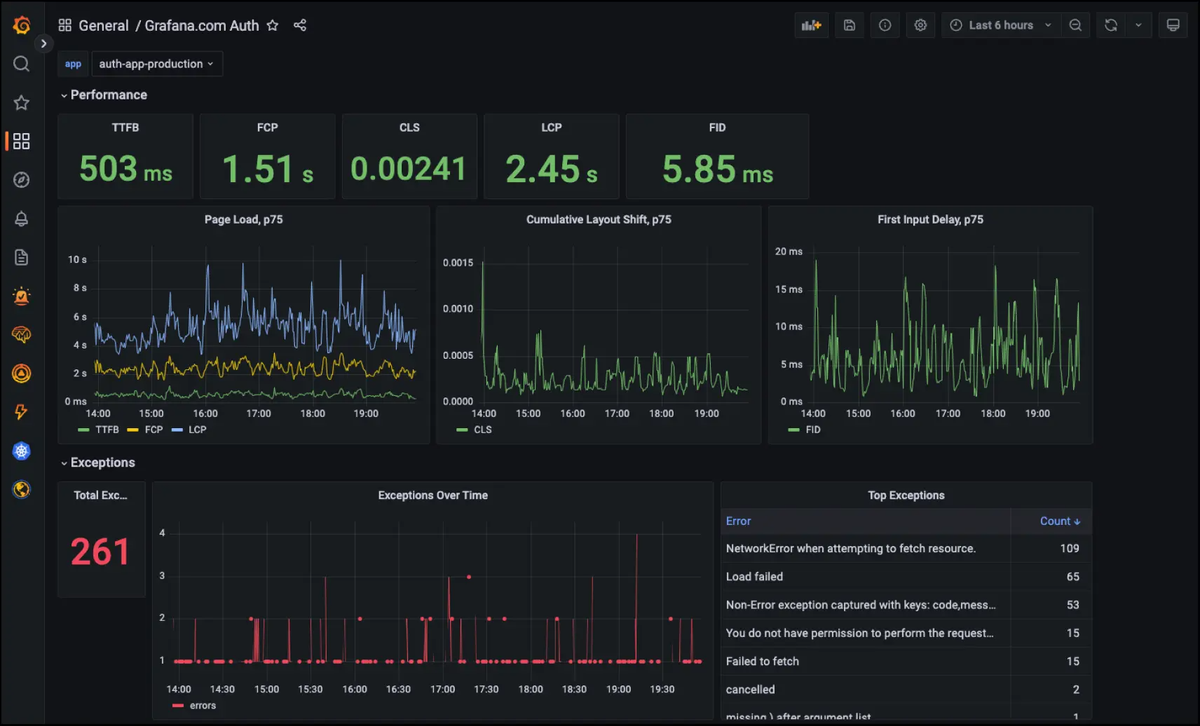
Grafana Cloud is the managed version of the open-source stack most engineers already know, with the familiar dashboarding layer sitting over separate backends for each signal. If your team lives in Grafana dashboards and PromQL, the appeal is continuity: you keep the interface and the open foundations, and someone else runs the storage.
What's good
- Open foundations and a generous free tier. The stack is built on open-source projects including Prometheus-compatible metrics, and the free tier is the most generous in the market, which makes evaluation and small-scale production genuinely free.
- You keep the interface you know. Teams already using Grafana dashboards and Prometheus carry that knowledge straight over, which lowers migration friction more than any proprietary platform can.
- Broad signal coverage. Metrics, logs, traces, profiling, RUM, and synthetics are all available under one usage-based bill.
The catch
The architecture uses a separate storage backend and a separate query language per signal: PromQL for metrics, LogQL for logs, TraceQL for traces. That's powerful, but it means context switching during investigations and more surface area to learn, which is a step back from Instana's single correlated model.
Cost is metered across several independent lines at once, active metric series, log volume, trace volume, active users, and a platform fee, and each ticks on its own schedule. Cardinality is the sharp edge: a team with disciplined Kubernetes labels can run a hundred hosts cheaply, while a cardinality explosion on the same hosts can push the bill an order of magnitude higher. As a commercial vendor monetizing an open-source project, Grafana Labs also has to balance investment across the free and paid tiers, which shapes how quickly deeper platform capabilities land.
Pricing model
Grafana Cloud's Pro plan runs a small monthly platform fee plus usage: roughly $6.50 per 1,000 active metric series above the free allowance, around $0.45 to $0.50 per GB for logs and traces across process, write, and retain, and a per-active-user charge for the visualization layer. The free tier includes 10,000 active series, 50 GB each of logs and traces, and three users. Enterprise starts at an annual spend commitment. The model is transparent line by line, but the number of meters means your effective rate depends heavily on cardinality and log verbosity, so it rewards teams that actively manage label discipline and punishes those who don't. Verify current rates on Grafana's Cloud pricing page before modeling.
The verdict
Grafana Cloud fits teams already invested in Grafana and Prometheus who want a managed stack on open foundations and are willing to manage cardinality to keep costs sane. If you want signals correlated automatically under one query language, or you'd rather not run a per-signal mental model, a more unified platform will feel less fragmented.
7. Elastic Observability
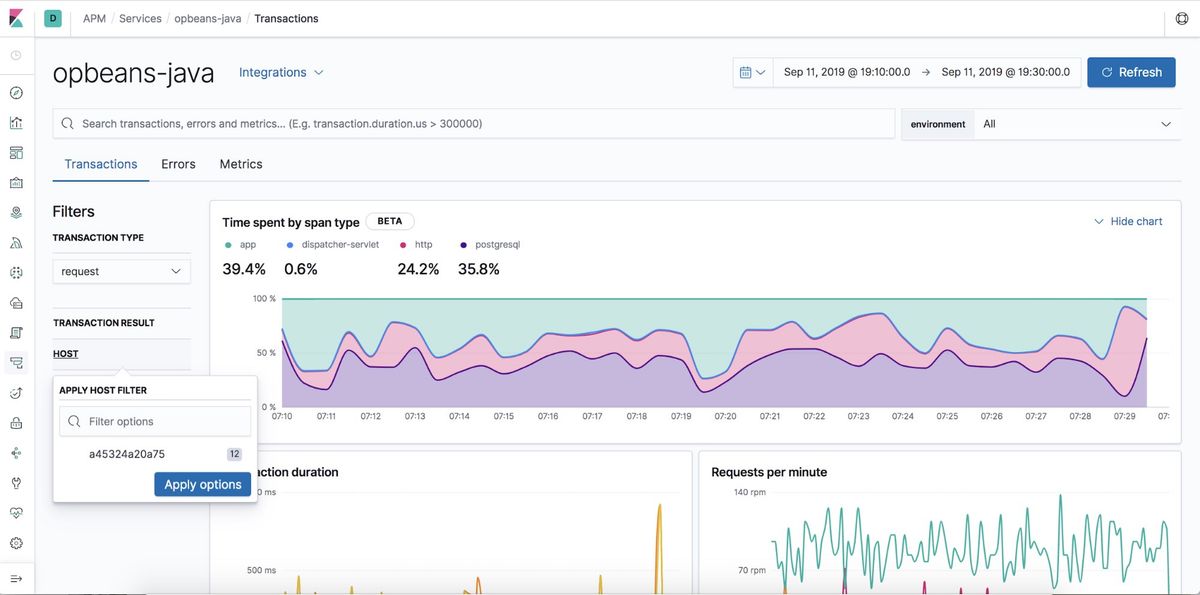
Elastic Observability builds observability on Elasticsearch, and its recent direction has been an aggressive move toward OpenTelemetry. It ships EDOT, the Elastic Distributions of OpenTelemetry, positions OTel as the primary path with no proprietary extensions, and even donated its Universal Profiling agent to the OpenTelemetry project. For an Instana team that wants OTel-native collection plus serious log search, that combination is distinctive.
What's good
- OTel-native collection with world-class log search. EDOT gives you standard OTLP ingestion, and Elasticsearch underneath means log search and analytics that few observability tools match.
- Deployment flexibility. You can run it as managed cloud, serverless, or fully self-managed, which is a real advantage for data-sovereignty and regulated environments where SaaS-only tools are non-starters.
- Storage efficiency. Features like logsdb index mode and searchable snapshots can cut log storage cost substantially, and TSDB improves metric density.
The catch
The query surface is a lot to learn. Between KQL, ES|QL, and Lucene, teams without existing Elastic experience face a steep curve, and query-language friction is a recurring theme in user feedback. If your engineers don't already know the Elastic Stack, factor in ramp time.
Cost forecasting is the other concern. Hosted pricing is resource-based, tied to RAM, storage, and tier, and Gartner has flagged that this model makes spend hard to predict as data volumes grow. There's no free tier, only a 14-day trial. And while Elastic's APM and service maps are capable, its automated root cause is less of a headline than Dynatrace's or Instana's, so if zero-config RCA was your reason for Instana, evaluate that gap directly.
Pricing model
Elastic offers a resource-based hosted model across Standard, Platinum, and Enterprise tiers, and a serverless option billed on Elastic Consumption Units with ingest as low as around $0.07 per GB. Resource-based pricing decouples your bill from host and user counts, which is helpful, but it ties cost to provisioned RAM, storage, and data tiers, and that's the dimension Gartner warns is hard to forecast at scale. The storage-efficiency features are the main lever you control. Model your retention and tiering strategy carefully, because index lifecycle management is where Elastic bills are won or lost.
The verdict
Elastic Observability is a strong choice if you want OTel-native collection, need self-managed or serverless deployment for compliance, and value deep log search, ideally with Elastic experience already on the team. If you want turnkey automated root cause or a query model your engineers can pick up in an afternoon, weigh those trade-offs before committing.
8. Dash0
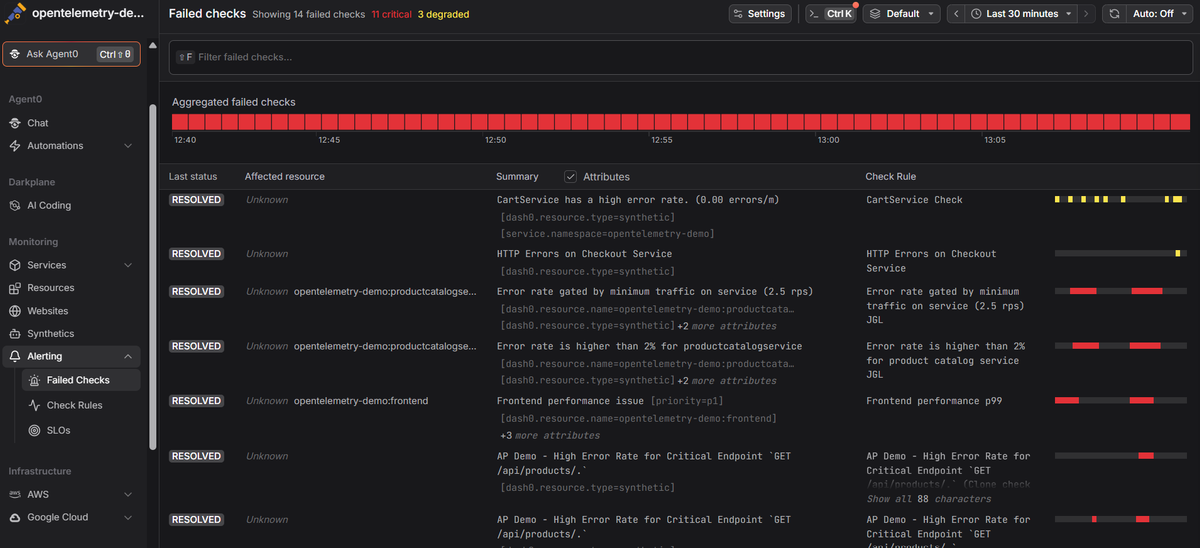
Dash0 is the one platform here built by someone who has already solved this problem once. Mirko Novakovic co-founded Instana and led it through the IBM acquisition, then started Dash0 in 2023 to rebuild observability with OpenTelemetry as the foundation instead of a proprietary agent. It's a fully managed platform covering metrics, logs, traces, RUM, and synthetic monitoring, built around open standards throughout.
What's good
- OpenTelemetry-native, not OTel-compatible. Dash0 ingests OTLP directly through the OTel SDKs, Collector, and a Kubernetes operator, and it carries resource attributes, semantic conventions, and cross-signal relationships through the whole investigation. Your instrumentation stays portable because it isn't tied to a vendor agent.
- One query language across signals. Dash0 supports PromQL for metrics, logs, and traces, and uses Perses-compatible dashboards, which keeps queries and dashboards portable and cuts the context switching that per-signal query languages create.
- Per-signal pricing that doesn't penalize rich data. Because billing is on data points, spans, and log records rather than hosts, seats, or attribute cardinality, adding a useful attribute doesn't create a new pricing dimension.
The catch
Dash0 is SaaS-only. There is no self-hosted or on-prem deployment, so if you have a strict data-residency or air-gap requirement, it's off the table regardless of its OTel strengths. That's a real limitation next to Elastic or Grafana's OSS.
Because it's OpenTelemetry-native, Dash0 leans on OTel for instrumentation rather than a zero-config proprietary agent. Its operator provides OTel auto-instrumentation for Java, .NET, Node.js, and Python, but other runtimes like Go, Ruby, and PHP mean setting up the OTel SDKs yourself, which is more work than dropping in Instana's host agent. As a company founded in 2023, its integration catalog and enterprise-feature maturity are younger than decade-old incumbents, so validate coverage for your specific stack. Retention is also worth checking against your needs: metric data points are retained for 13 months, but spans and log records are kept for 30 days.
Pricing model
Dash0 uses purely consumption-based pricing with no per-seat, per-host, or base platform fee. Published rates are $0.20 per million metric data points, $0.60 per million spans or span events, and $0.60 per million log records, plus per-thousand runs for synthetic checks. You estimate the bill by multiplying each signal's volume by its rate, which is about as legible as observability pricing gets. The model aligns with richly attributed OTel data, since cardinality and attributes don't add a dimension, though spans are priced at three times the metric rate, so high-throughput microservice environments where one request fans out into many spans should model trace volume specifically. Spam filters reject known low-value telemetry before it's stored and billed, and cost forecasts and budget limits help you manage spend before it drifts.
The verdict
Dash0 fits teams standardizing on OpenTelemetry and Prometheus that want a managed backend built around those standards, with predictable per-signal pricing and portable instrumentation, and that are comfortable with SaaS-only deployment. If you need on-prem, or you want the drop-in-agent, zero-config automation that defined Instana, weigh those gaps honestly. The founder lineage is a useful signal of intent, not a guarantee of feature parity, so evaluate it on the criteria above like any other tool.
Which tool fits your situation
If automated root cause was your reason for Instana, Dynatrace is the closest match at scale, with Davis and Smartscape giving you topology-driven causal analysis. You're trading one proprietary-agent relationship for another, so accept that and budget for cost governance.
If your pain was host-based licensing in a containerized world, New Relic decouples the bill from hosts entirely and meters on data and users instead, and Dash0's per-signal model removes host and seat dimensions altogether. Both fix the density problem; model your ingest or span volume to see which lands lower.
If you're standardizing on OpenTelemetry and want a backend built around it, Dash0 and Elastic are the OTel-native options. Choose Dash0 for a managed, unified, PromQL-everywhere experience; choose Elastic if you need self-managed or serverless deployment and heavy log search, and you have Elastic skills on the team.
If telemetry cost and cardinality at large scale are the whole problem, Chronosphere's Control Plane is purpose-built for exactly that, provided you're big enough to justify it and can run the shaping.
If you're already a Splunk or Cisco shop, Splunk Observability Cloud slots into existing agreements and offers NoSample tracing, as long as you account for the separate log platform.
If you want maximum breadth and out-of-the-box coverage and have the FinOps discipline to control volume-driven costs, Datadog remains the most complete single platform.
If your team lives in Grafana and Prometheus, Grafana Cloud is the path of least resistance, so long as you manage cardinality actively.
Final thoughts
The eight platforms here sort into three broad approaches, and each represents a trade-off. The proprietary-agent incumbents, Dynatrace, Datadog, New Relic, and Splunk, give you turnkey automation and enormous feature breadth at the cost of platform lock-in and, usually, cost models that reward more data rather than better data. The open-standards platforms, Elastic, Grafana Cloud, Chronosphere, and Dash0, keep your instrumentation and collection portable and align cost more closely with retained value, at the cost of leaning on OpenTelemetry and Prometheus rather than a single magic agent. Which trade-off is right depends less on feature checklists and more on whether your priority is zero-config automation or long-term portability and cost predictability.
Instana sits firmly in the first camp, and if what you loved was the drop-in agent, an incumbent will feel most familiar. If what pushed you to look elsewhere was the per-host bill or the pull toward open standards, the OTel-native platforms are built for the world you're moving into. Dash0 is the most direct expression of that thesis on this list, unified under PromQL, priced per signal with no host or seat fees, and portable by construction because your instrumentation lives in OpenTelemetry rather than in the vendor. The honest caveat is that it's SaaS-only and younger than the incumbents, so it fits teams committed to OTel more than teams that need on-prem or drop-in-agent automation.
Whichever way you lean, the most useful next step is to run your real telemetry through two or three candidates and watch what the bill and the investigation workflow actually look like. If Dash0 is on your shortlist, you can start a free trial with 14 days of unlimited access and point an existing OTel Collector at it to see your own data in minutes.
Frequently asked questions
Is IBM Instana being discontinued? No. IBM continues to sell and develop Instana, and IBM was named a Leader in the 2025 Gartner Magic Quadrant for Observability Platforms on the strength of it. Most teams evaluate alternatives for cost or strategy reasons, such as per-host licensing in containerized environments or a move toward OpenTelemetry-native tooling, rather than because the product is going away.
Does Instana support OpenTelemetry? Yes. Instana supports OpenTelemetry ingestion for traces, metrics, and logs, all generally available, and you forward OTLP data to the Instana agent or backend. The distinction that matters is that Instana's automated discovery and tracing run through its proprietary host agent, so it ingests OpenTelemetry rather than being built natively on the OTel data model.
Which Instana alternative is best for OpenTelemetry-native teams? Dash0 and Elastic Observability are the two built around OpenTelemetry rather than treating it as an ingest path. Dash0 is managed, unified under PromQL, and priced per signal. Elastic ships EDOT, supports self-managed and serverless deployment, and adds strong log search. Chronosphere and Grafana Cloud are also OTel-friendly on ingestion.
Do I have to re-instrument my applications to migrate off Instana? If you move to an OpenTelemetry-native platform and your services already emit OTLP, your instrumentation stays largely portable and you mostly repoint your Collector. If you move to another proprietary-agent platform, you'll typically deploy that vendor's agent and adopt its assumptions. Either way, dashboards, alerts, and saved queries rarely transfer automatically, so plan for that rebuild regardless of which tool you pick.

