The Integrations Hub now ships 101 curated check rules like Kubernetes, Vercel, AWS RDS, Istio, Argo CD, Cilium, the OpenTelemetry Collector, and many more.
Setting up alerting for a new technology has always been the slow part of getting full coverage. You know which metrics matter, but you still have to write the PromQL, decide on thresholds, and pick severities. Now we do that for you.
pre-built check rules for k8s
Every integration in the Hub has a Check Rules section listing the alerts most worth running for that technology. Browse them on the public Integrations Hub at dash0.com/hub before you sign up, or open them from the in-app integration page and install with one click; already configured with sensible thresholds and severities.
Each rule card is transparent about what it does and what it needs. You can see which of its metrics are already flowing into your organization and get a clear pointer if a dependency integration isn't set up yet; added rules are also disabled by default so you don’t need to worry about them spamming you immediately before you make modifications.
Once added, these rules behave like any check rule you authored yourself; you can edit, route to notification channels, adjust thresholds. The Hub is a curated starting point, not a black box.
Spam filters in Dash0 let you drop unwanted logs, spans, and metrics before they reach storage by matching on structured attribute conditions.
You can now manage spam filters as code using the Dash0 CLI, Terraform provider, and Kubernetes operator, so your data-hygiene rules live right alongside the rest of your infrastructure.
Every spam filter is expressed as a YAML document with kind: Dash0SpamFilter. The Dash0 CLI, Terraform provider and Kubernetes operator all accept the same YAML document that you can download from the Dataset configurations:
The spam-filters command is currently experimental and requires the --experimental (or -X) flag:
sh
spams-filters.sh# Create a spam filter from a YAML file
dash0 spam-filters create -X --dataset default -f drop-health-checks.yaml

# List all spam filters in a dataset
dash0 spam-filters list -X --dataset default

# Get a single spam filter as YAML
dash0 spam-filters get -X --dataset default <id>

# Update an existing spam filter
dash0 spam-filters update -X --dataset default <id> -f drop-health-checks.yaml

# Delete a spam filter
dash0 spam-filters delete -X --dataset default <id>
We have reworked the Spam Filters UI under Datasets so that you can name your spam filters (which of course works also via Infrastructure as Code), and download both the SpamFilters CRD to use with the Terraform provider for Dash0, the CLI and the Kubernetes operator.
Dashboard queries that aggregate large volumes of raw metrics can be slow and expensive.
You can now define recording rules as code using the Dash0 CLI, Terraform provider, and Kubernetes operator, so pre-computed time series are version-controlled and deployed alongside the rest of your infrastructure.
Recording rules let you evaluate PromQL expressions on a schedule and store the results as new time series.
This means dashboards and alerting rules can query the pre-computed series instead of recalculating them on every load.
You author rules in the standard `PrometheusRule` CRD format (`monitoring.coreos.com/v1`), so the syntax is already familiar if you have worked with the Prometheus Operator.
Each recording rule is scoped to a dataset and defined as a YAML document that follows the PrometheusRule specification.Inside the YAML you declare one or more rule groups, each with an evaluation interval and a list of rules entries that pair a record name with a PromQL expr. Dash0 evaluates these expressions on the configured cadence and writes the resulting series back into the dataset, ready for dashboards and alert conditions.
cli-recording-rules.sh# Create recording rules from a YAML file
dash0 recording-rules create --dataset default -f recording-rules.yaml

# List all recording rules in a dataset
dash0 recording-rules list --dataset default

# Get a single recording rule by ID
dash0 recording-rules get --dataset default <id>

# Update an existing recording rule
dash0 recording-rules update --dataset default <id> -f recording-rules.yaml

# Delete a recording rule
dash0 recording-rules delete --dataset default <id>
Google Cloud infrastructure monitoring is now in Dash0. Cloud Run, Pub/Sub, and Cloud Storage metrics flow the moment you connect a project — no setup required.
Your Google Cloud infrastructure is now fully visible in Dash0 the moment you connect a project. No agents. No YAML. No per-resource configuration. This release brings Cloud Run, Pub/Sub, and Cloud Storage into Dash0 with comprehensive metrics out of the box — and broader GCP coverage is already on its way.
Zero-configuration metric collection: Connect a GCP project through a guided OAuth flow and Dash0 immediately starts collecting a default metric set across every discovered resource. Metrics flow the instant your project connects without anything to enable, or to configure.
Cloud Run monitoring: Instant visibility into Cloud Run Services and Cloud Run Jobs. Track request counts, latency, error rates, CPU, memory, and instance counts the moment you're connected.
Pub/Sub monitoring: Topics and subscriptions in a clean nested view. Catch message throughput issues, delivery latency spikes, undelivered message counts, and oldest unacked message age — without building a single dashboard first.
Cloud Storage monitoring: Request counts, data transfer volumes, and error rates at the bucket level, live from the moment your project connects.
Metric coverage: Each service type ships with Core metrics (required for the Dash0 experience), Default metrics (on automatically, covering what you would check first during an incident), and Extended metrics (available on demand via integration settings). For finer control, spam filtering applies on top of any of these.
Generally Available: Google Cloud Run Services, Google Cloud Run Jobs, Pub/Sub, Cloud Storage, Google Cloud SQL.
Notification channels and the associated routing rules join the Dash0 settings you can manage as Infrastructure as Code in Dash0.
Keeping alerting configuration in sync across environments has always been tedious.You can now manage notification channels — Slack, PagerDuty, email, webhooks, and more — as code using the Dash0 CLI, Terraform provider, and Kubernetes operator.
Notification channels control where Dash0 sends alerts when check rules fire. Until now they could only be configured through the UI, which made it difficult to version-control, review, and replicate them across organizations. With IaC support, you define a channel once in a YAML file and apply it from your terminal, CI/CD pipeline, or GitOps workflow.
Each notification channel is defined as a CRD-enveloped YAML document with kind: Dash0NotificationChannel.The spec.type field selects the channel type (one of 17 supported integrations), and spec.config holds the type-specific settings such as webhook URLs or Slack channel names.Notification channels are organization-level resources, so no --dataset flag is required.
notification-channel-cli.sh# Create a notification channel from a YAML file
dash0 -X notification-channels create -f slack-alerts.yaml

# List all notification channels
dash0 -X notification-channels list

# Get a single notification channel as YAML
dash0 -X notification-channels get <id> -o yaml

# Update an existing notification channel
dash0 -X notification-channels update <id> -f slack-alerts-updated.yaml

# Delete a notification channel
dash0 -X notification-channels delete <id>
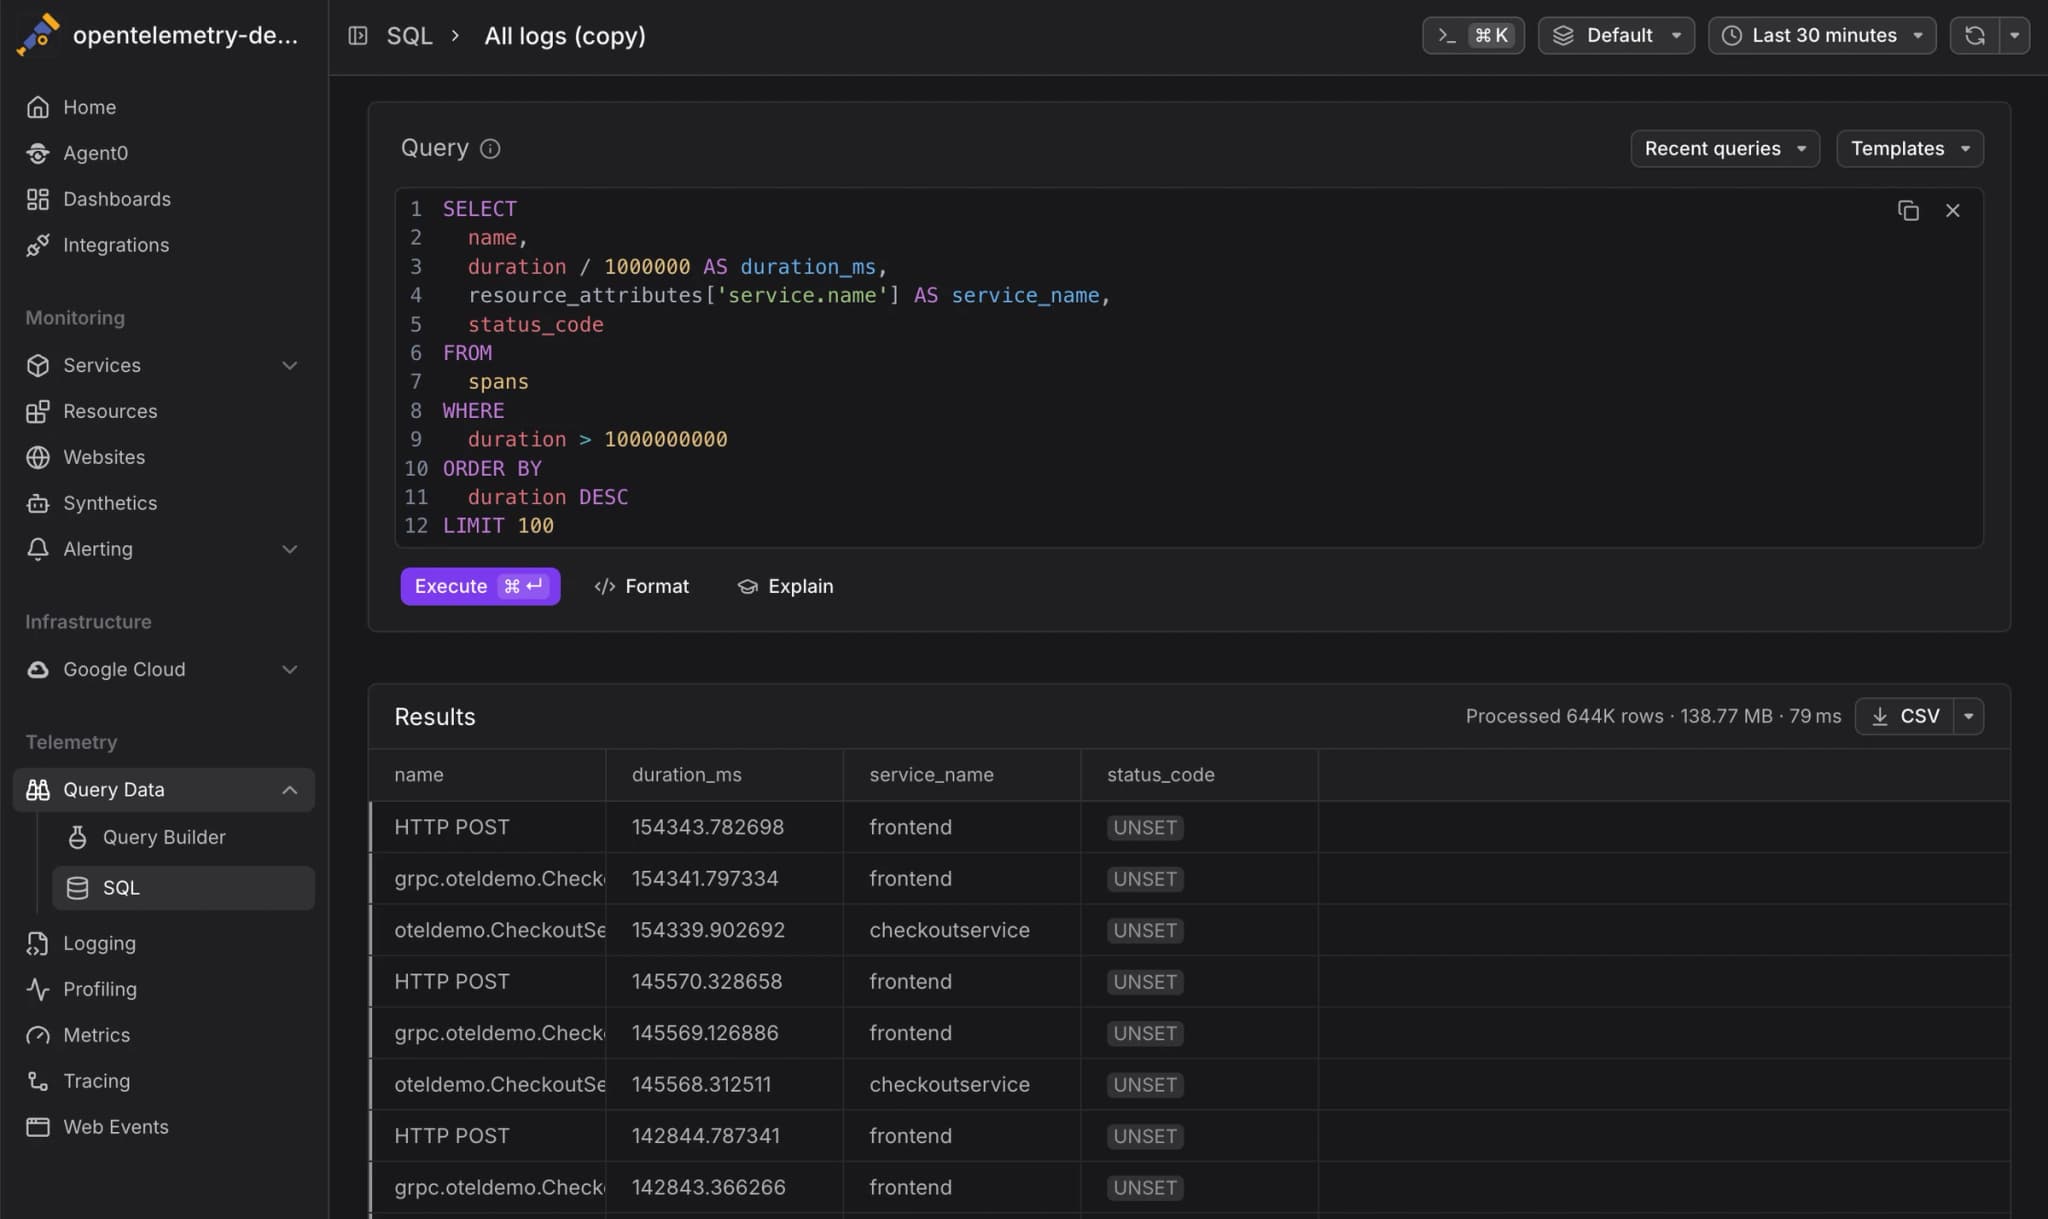
Dash0 SQL is now generally available. Write queries directly against your logs, spans, and web events — with templates to start fast, query history to revisit past work, and saved views to persist queries and share with your team.
Full SQL Support: Write SQL against logs, spans, and web events. Joins, subqueries, aggregations. Functions for aggregation, string manipulation, date, array, math, logic, JSON extraction, and type conversion are supported. Because it's standard SQL, any AI tool can write queries for you — just describe what you want and paste the result in. See the full function reference in the docs.
Cross-signal joins and aggregation on arbitrary attributes unlock questions no single explorer can answer. Join spans to themselves to compute connection KPIs across service boundaries. Pull custom span attributes — query IDs, URL parameters, business-specific flags — alongside performance data to understand not just that something is slow, but which request types are responsible.
Built-in Query Templates: A library of ready-to-run query examples ships with Dash0 SQL. Pick a template, run it, and modify it from there — no blank-page problem.
Recent Queries: Dash0 SQL keeps a local history of your last 20 queries. Get back to anything you ran earlier without rewriting it from scratch.
Saved Views with Sharing: Save any query as a named view that lives in Dash0 and persists across sessions and devices. Share saved views with teammates so the whole team can build on the same go-to queries.
Need more room for that service name? Now you can drag column edges to resize tables in Trace Explorer, Log Explorer, Web Events Explorer, and Resources.
We've added drag-to-resize handles to table columns across Dash0's explorers. Hover over the table header row to reveal grip handles at column edges, then drag to adjust the width. Save your view to keep your preferred column sizes across sessions.
To reset column sizes, use the view reset button. If you've saved a view with custom column sizes, a "Reset column sizes" button will appear in the table Settings menu.
Resize handles
Available in: Trace Explorer, Log Explorer, Web Events Explorer, and Resources.
Running multiple sites on a single web integration? Now you can finally see which domain each session came from.
If you're using a shared web integration across multiple domains — think franchise networks, regional storefronts, or white-label deployments — you've probably wondered which domain a particular session was visiting. Until now, there was no way to tell from the Dash0 UI.
This update surfaces the page.url.domain attribute in three places:
Session list sidebar
The session summary card now shows the domain alongside location and browser info, so you can identify which site a user was on at a glance.
Domain display in the sidebar
Session detail page
When viewing a full session, the domain appears in the header for quick context as you step through page views and events.
Domain display in full sessions page
Dashboard filters
A new Domain filter variable is available in both the Overview and Web Vitals dashboards, letting you slice metrics by domain across your entire network.
Domain filter in dashboard views
Also in this update:
On smaller screens, the session detail header items no longer get squeezed — they now wrap gracefully instead.
Connecting your AI coding tools to Dash0 just got a lot simpler.
Dash0's MCP server now supports OAuth 2.0 authentication, so tools like Claude Code, Cursor, Windsurf, and other MCP-compatible clients can authenticate without requiring you to create and manage static API tokens.
When you add Dash0 as an MCP server in your AI tool of choice, the tool will automatically open a browser window where you log in and grant consent — just like connecting any other app. Behind the scenes, Dash0 handles dynamic client registration, token exchange, and automatic refresh. You never touch a token.
For example, in Claude Code
sh
claude mcp add --transport http dash0 {{endpoint_mcp}}
That's it. Claude Code will walk you through the OAuth flow on first use.
No more token management. You don't need to visit the Dash0 UI to create an auth token, copy it into your config, and remember to rotate it.
Short-lived, auto-refreshing tokens. Access tokens expire in 15 minutes and refresh automatically - reducing the blast radius if a token is ever compromised.
Full audit trail. Every OAuth authorization, token exchange, and revocation is tracked in your organization's audit log.
Revocable at any time. You can review and revoke connected applications from your Dash0 settings (User Settings -> Applications).
Once connected, your AI tool has access to 20+ MCP tools for querying your observability data - service catalogs, PromQL metrics, logs, traces, synthetic checks, dashboards, and more. All scoped to your user permissions and dataset access.
If you prefer managing tokens yourself - for CI pipelines, scripts, or automated workflows - bearer token authentication remains fully supported. OAuth is an additional option, not a replacement.
Chart legends now behave the same way everywhere in Dash0.
Click a legend entry to isolate that series — all other series are hidden so you can focus on the one that matters. Shift+click to select multiple series and build the exact comparison you need. Click the isolated entry again to restore all series.
This interaction model is now applied consistently across all charts in Dash0: dashboards, explorers, and detail views. No more guessing which legend behavior you will get.
When a check fails, the first thing you want to do is understand why. Until now, drilling down from a failed check into the underlying telemetry meant losing context — metric filters weren't carried over, and the charts you landed on showed largely unfiltered data, often not relevant for your investigation.
Dash0 now provides a seamless drilldown experience from failed checks directly into the relevant spans, logs, web events, and metrics — with filters automatically extracted from the check's PromQL expression.
When you open a failed check's details view, Dash0 analyzes the PromQL expression behind the check and extracts the metric names and label filters. The drilldown then uses these filters to show you only the telemetry that matters:
Spans, Logs, and Web Events cards appear only when the check uses a related synthetic metric (e.g., dash0.spans or dash0.spans.duration), with extracted filters pre-applied for a precise view.
Metrics cards list all other metrics used in the check, each filtered to the relevant label matchers.
Not every filter from a PromQL expression can always be mapped to a telemetry query — Dash0 applies what it can and skips what it can't, so you always get the most relevant view possible. Although, the only times we need to skip some of the filters are for the most complex PromQL queries. (If you want to know more, hit Michele up and prepare for an entire discussion about symbolic model-checking on the PromQL AST. It is great fun!)
Error span processing time per error log in the checkout service
The metric shows how much error span processing time (at P95) occurs for each error log generated by the checkout service. This is useful for:
Identifying if checkout errors generate disproportionate tracing overhead
Correlating checkout service error logging patterns with distributed trace complexity
Detecting when checkout errors trigger cascading failures across services (high values = many error spans per checkout log)
When looking at the Failed Check Details page for an alert using this query:
The spans shown are only those with status code ERROR, across all services
The logs shown are those with severity range ERROR for the checkoutservice.
Now, we could have picked a simpler PromQL expression, but where's the fun in that. You would have looked at it, assumed it just extracted somehow the filters from the timeseries, and phoned it in. In reality, the algorithm does a lot of work with binary operators (+, -, *, /), logic operators (AND, OR, UNLESS), and more.
Open the Failed Checks page, select a failed check, and explore the drilldown cards. Brush a time range in the timeline chart to jump directly into the relevant telemetry.
The lion's share of the research that led to this breakthrough has been performed in collaboration with Julius Volz (who else to rely upon to know all the dark corners of PromQL?!?).
Julius' course about "Understanding PromQL" is a rite of passage for technical staff at Dash0, and we cannot endorse it enough!
The Query Builder just got a major upgrade. We've unified it with the dashboard panel editor, giving you a cleaner, more consistent experience, and a few quality-of-life fixes along the way.
If you've used both the Query Builder and the dashboard panel editor, you may have noticed they were starting to feel like two different products. Different layouts, different behaviors, different quirks. We've fixed that.
New query builder view
The Query Builder now uses the same interface as the dashboard panel editor. This means a more consistent experience across Dash0, and as we add new widget types to dashboards, they'll automatically be available in the Query Builder too.