Dash0 acquires Polar Signals

Dash0 updates from January 2026

6 updates shipped to Dash0 in January 2026: Extended Retention for Synthetic API Check Runs, Kubernetes Operator: per-namespace export and API sync, New AI Integrations: OpenCode, LangChain, kagent, OpenLIT and Kiro and more.

Extended Retention for Synthetic API Check Runs

We've increased the retention period for synthetic API check runs from 30 days to 13 months at no extra cost. This change applies to all check runs executed from January 19, 2026 onwards. Existing check runs will continue to follow the previous 30-day retention policy.

We've increased the retention period for synthetic API check runs from 30 days to 13 months at no extra cost. This change applies to all check runs executed from January 19, 2026 onwards. Existing check runs will continue to follow the previous 30-day retention policy.

Read more

Kubernetes Operator: per-namespace export and API sync

Telemetry export and API sync now support per-namespace configuration to enable more flexible routing.

Starting with version 0.99 of the Dash0 Kubernetes Operator, you can define per-namespace settings for exporting telemetry and syncing custom resources (Dash0View, Dash0SyntheticCheck, PrometheusRule, PersesDashboard) to different backends and/or datasets.

The configuration in the Dash0OperatorConfiguration serves as a default that can be overridden by providing an alternative configuration in a namespace's Dash0Monitoring resource.

You can find more details in the operator's documentation.

Read more

New AI Integrations: OpenCode, LangChain, kagent, OpenLIT and Kiro

Build smarter and monitor better with 5 new AI integrations. Connect AI tools to your telemetry for context-aware coding, or track LLM performance, costs, and agent behavior in production.

We've added five new AI integrations to help you build and monitor intelligent applications:

dashboard showing new AI integrations

AI Coding Assistants (connect to your Dash0 telemetry):

  • OpenCode - Terminal AI coding agent that uses your telemetry data to identify issues and correlate incidents with code changes.

  • Kiro - Agentic IDE with spec-driven development that leverages your observability data for telemetry-aware coding and root-cause analysis.

OpenTelemetry Monitoring (observe your AI applications):

  • kagent - Kubernetes-native platform for building and deploying AI agents that can connect to MCP servers (including Dash0). Monitor your agents' LLM calls, tool executions, and orchestration flows with built-in OpenTelemetry support.

**LLM Application Monitoring **(observe your AI applications):

  • LangChain - Monitor LLM call performance, token usage, and chain execution flows in your LangChain applications.

  • OpenLIT - OpenTelemetry-native observability for LLM applications with automatic instrumentation and GPU monitoring.

These integrations enable you to build AI-powered tools that understand your system's behavior through telemetry, and monitor the performance and costs of your AI applications in production.

Read more

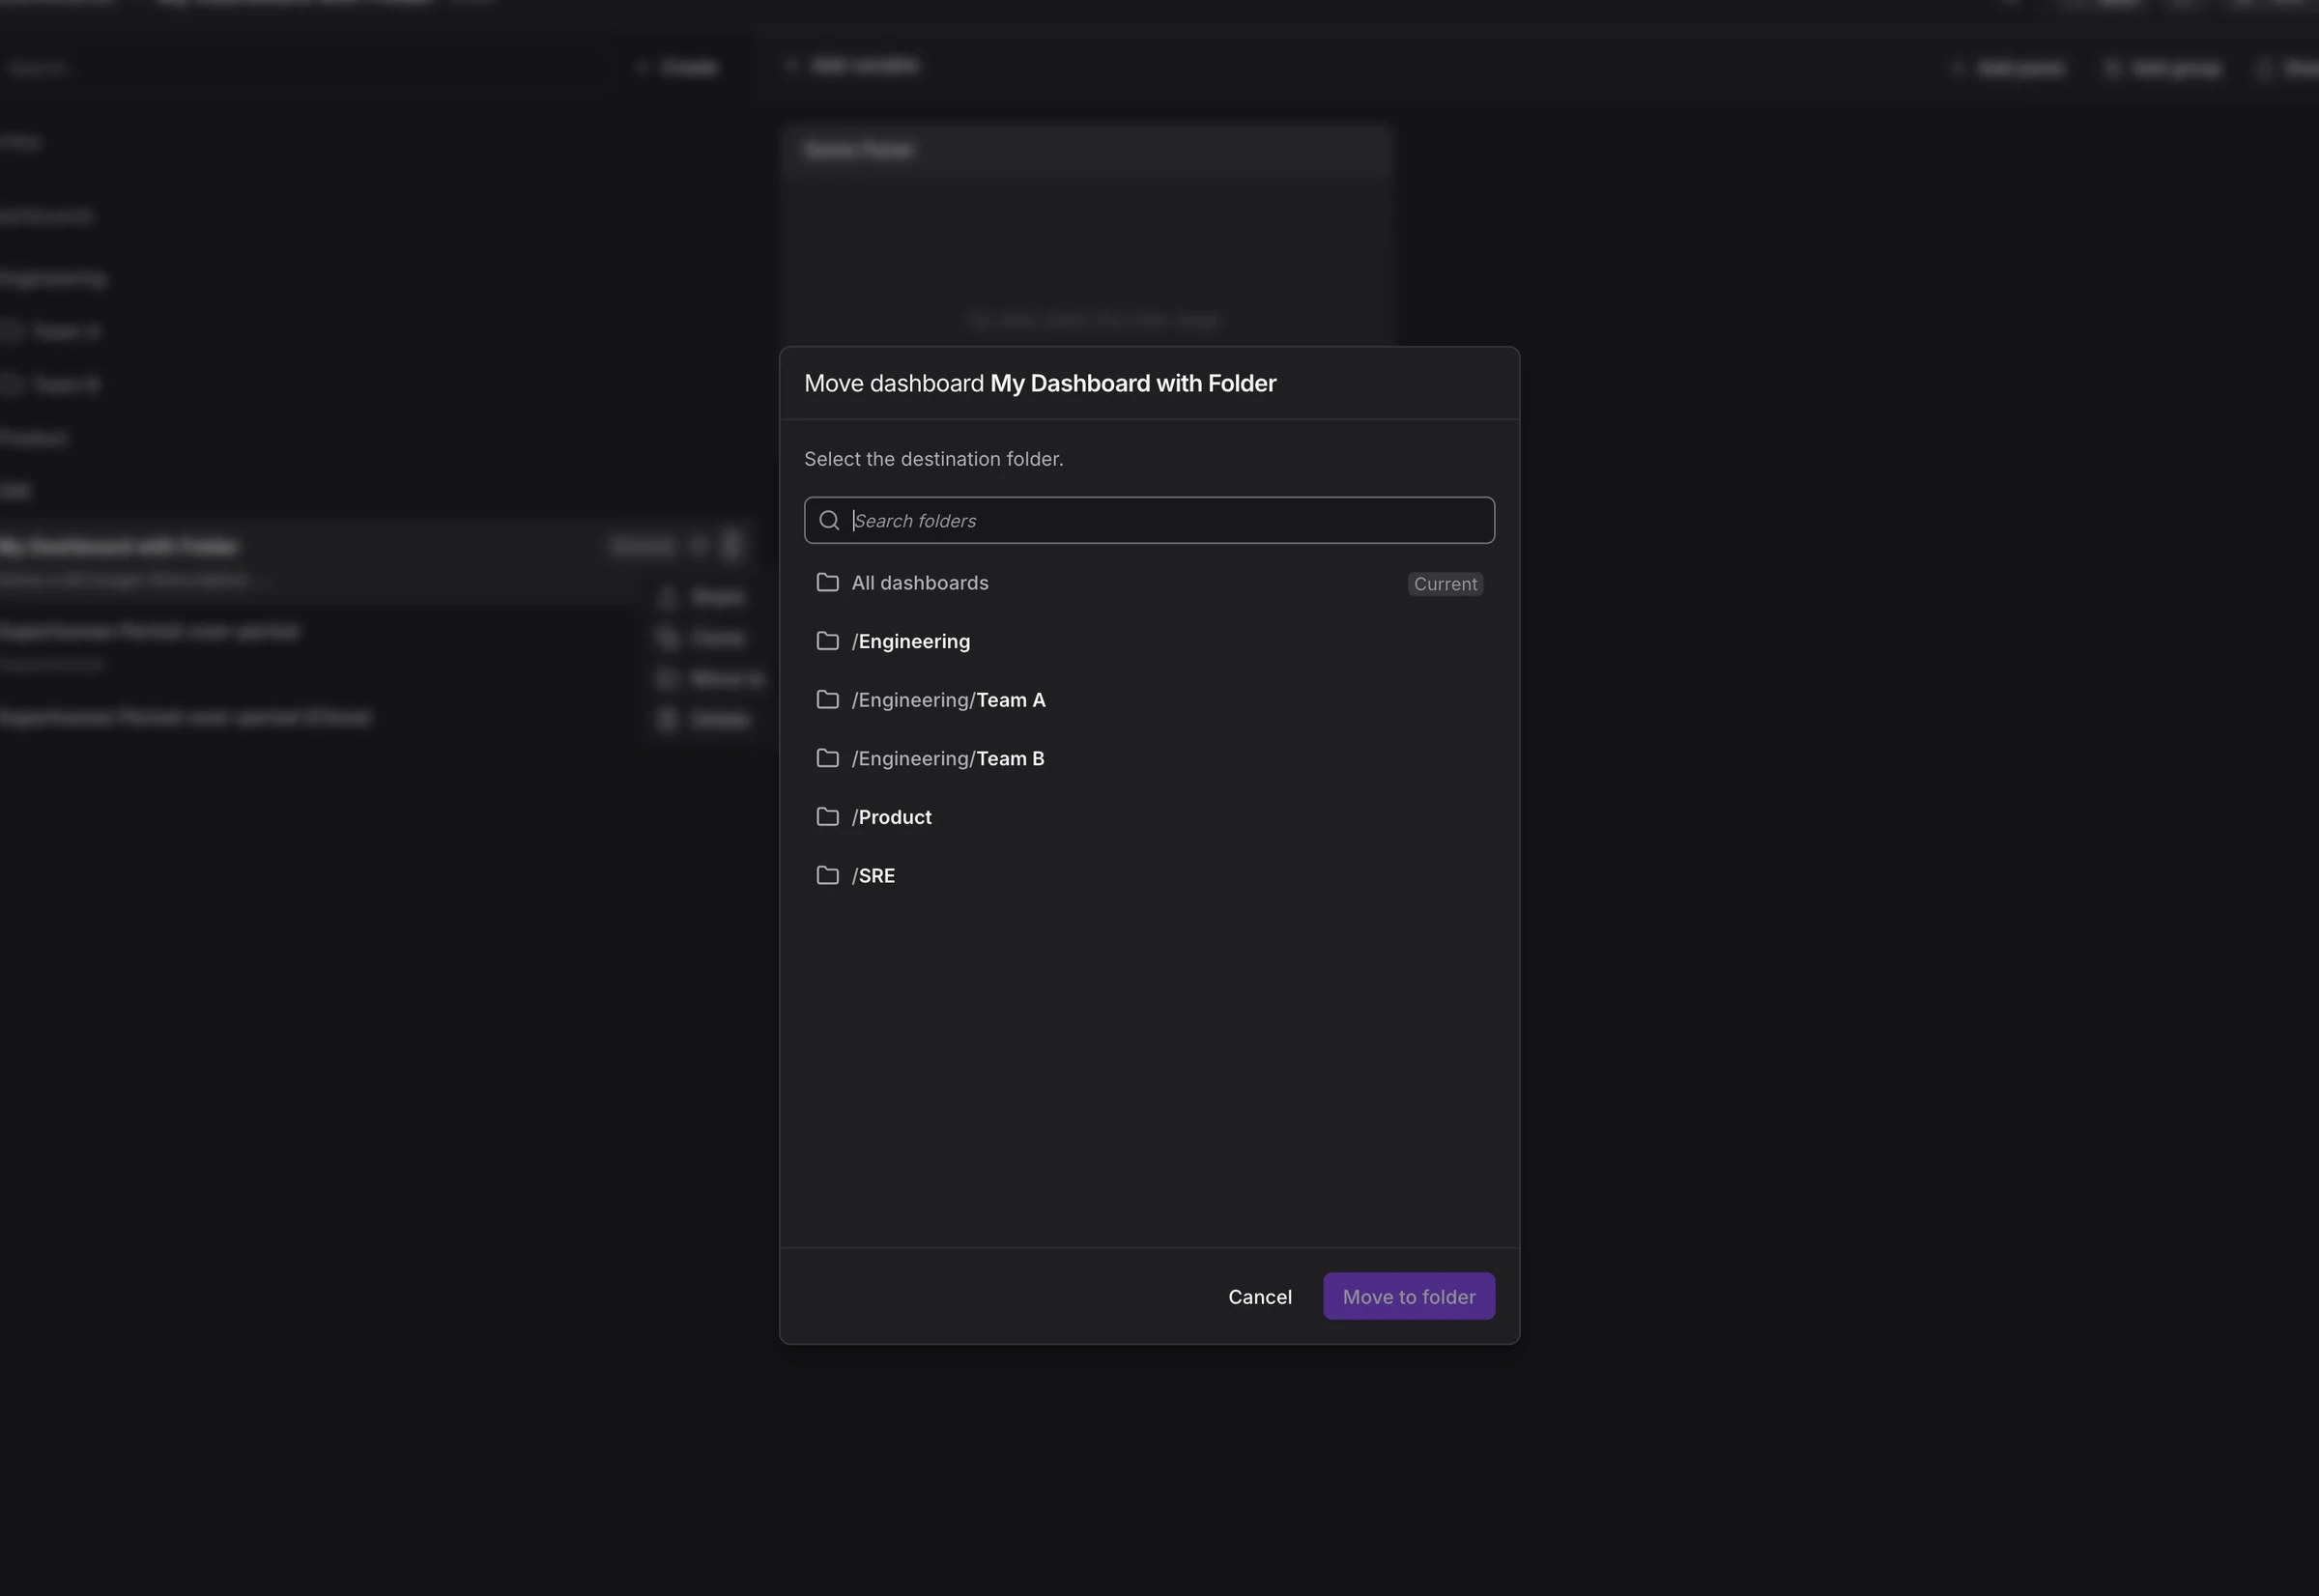
Organize assets with folders

As observability grows, dashboards and alerts quickly pile up. Without structure, it becomes difficult to navigate and maintain clarity. That’s why Dash0 now introduces Folders.

Dash0 Folders let you organize assets by service, environment, or business domain, reflecting how your team actually works. This makes it easier to find the right dashboard and keeps your workspace organized as your system evolves.

Dashboard list with folders"Move to" dialog

Folders are built for scale. You can manage them through Infrastructure as Code, keeping your organizational structure consistent across development, staging, and production. Teams can also define which folders appear by default, giving everyone a clean and intentional starting point.

In short: Folders reduce clutter and bring structure to growing observability environments, so Dash0 remains as organized as the systems you monitor.

Read more

Service Views and a new Service Map

Today, we’re launching Dash0 Services in Beta. We’ve turned your OpenTelemetry data into a real-time, living map of your entire system. No proprietary agents, no manual configuration - just the payoff for the instrumentation work you’ve already done.

📊 Service Catalogue

Get a bird’s-eye view of your system health or dive deep into specific code paths.

  • The Command Center: A high-level list of every service.

  • Infrastructure Resources: See "Failed Checks" on Resources alongside your APM metrics.

Endpoint-Level Granularity: Use the **Operations Tab **to see which specific operation is failing, even when the rest of the service looks healthy.

🗺️ Service Map

We had a Service Map before so what's new?

  • Customizable Views: Save your preferred filters to quickly see the services most relevant to your work by default.

  • Dynamic Traffic Visualization: Easily discover traffic flows and paths within your service topology with overlaid particles.

  • Grouped External Services: Explore external services organized by similarity, reducing clutter and complexity compared to the full internal map.

We use OpenTelemetry semantic conventions to automatically draw the connection between your services.

  • Automatic Discovery: Connections are derived live from your tracing data.

  • Visualize the Blast Radius: RED metrics (Requests, Errors, Duration) are overlaid on every connection so you can see exactly where a failure starts and where it spreads.

Read more

Meta Check Rules

Check rules can now query Dash0's own check metrics (dash0.check.*, dash0.issues.*, dash0.synthetic_check.*), enabling higher-level alerts based on the status of other checks.

Check rules can now query Dash0's own check metrics (dash0.check.*, dash0.issues.*, dash0.synthetic_check.*), enabling higher-level alerts based on the status of other checks.

Use this to:

  • Aggregate check failures and group multiple related checks into a single alert, reducing alert fatigue by consolidating notifications.

  • Monitor synthetic check execution and latency metrics: dash0.synthetic_check.runs* and *dash0.synthetic_check.http.timing.*

Find out more in Meta Check Rules

Read more