Dash0 Raises $110M Series B at $1B Valuation
Monitor AI agent operations in Kubernetes with distributed tracing for LLM calls, tool executions, and agent workflows.
kagent is an open-source AI agent platform designed for cloud-native Kubernetes environments. It provides a framework for building, deploying, and running AI-powered automation solutions that can diagnose issues, optimize performance, and manage infrastructure through intelligent agents. Built on open standards like the Model Context Protocol (MCP) and Agent2Agent (A2A) protocol, kagent brings agentic AI capabilities directly into your Kubernetes workflows with built-in observability through OpenTelemetry.
Monitoring kagent with OpenTelemetry provides complete visibility into your AI agent operations, including distributed traces of LLM calls, tool executions, agent decision-making flows, and the performance of multi-agent orchestration patterns.
kagent has built-in OpenTelemetry support for tracing and logging. By enabling these features and configuring an OpenTelemetry Collector, you can send all agent execution telemetry to Dash0, including LLM calls, tool executions, and agent decision flows.
This guide shows you how to deploy kagent on Kubernetes with OpenTelemetry tracing and logging enabled, forwarding all telemetry data to Dash0 for complete visibility into your AI agent operations.
Before setting up kagent monitoring, ensure:
You'll need an OpenTelemetry Collector that accepts OTLP and exports to Dash0. Consider using:
Helm Chart for The OpenTelemetry Collector
For other providers, see the kagent documentation on LLM providers.
Create kagent-values.yaml with OpenTelemetry enabled:
Note: Update the endpoint to match your OpenTelemetry Collector service name and namespace.
Open http://localhost:8080 to access the kagent dashboard.
service.name=kagent* to see all kagent traceskagent agents can use Dash0's Model Context Protocol (MCP) server to query observability data directly. This enables agents to help with SRE tasks, troubleshooting, and performance analysis by accessing logs, traces, metrics, and service information.
You'll need a Dash0 auth token for MCP access. While you can use your existing auth token, we recommend creating a dedicated token for MCP:
*) - Recommended for full MCP functionality*:read) - For read-only access to observability dataCreate dash0-mcp.yaml to configure the MCP connection:
Deploy the MCP server configuration:
Create observability-agent.yaml that uses Dash0 MCP tools:
Deploy the observability agent:
Access the kagent UI at http://localhost:8080 and select the observability-agent. You can now ask questions like:
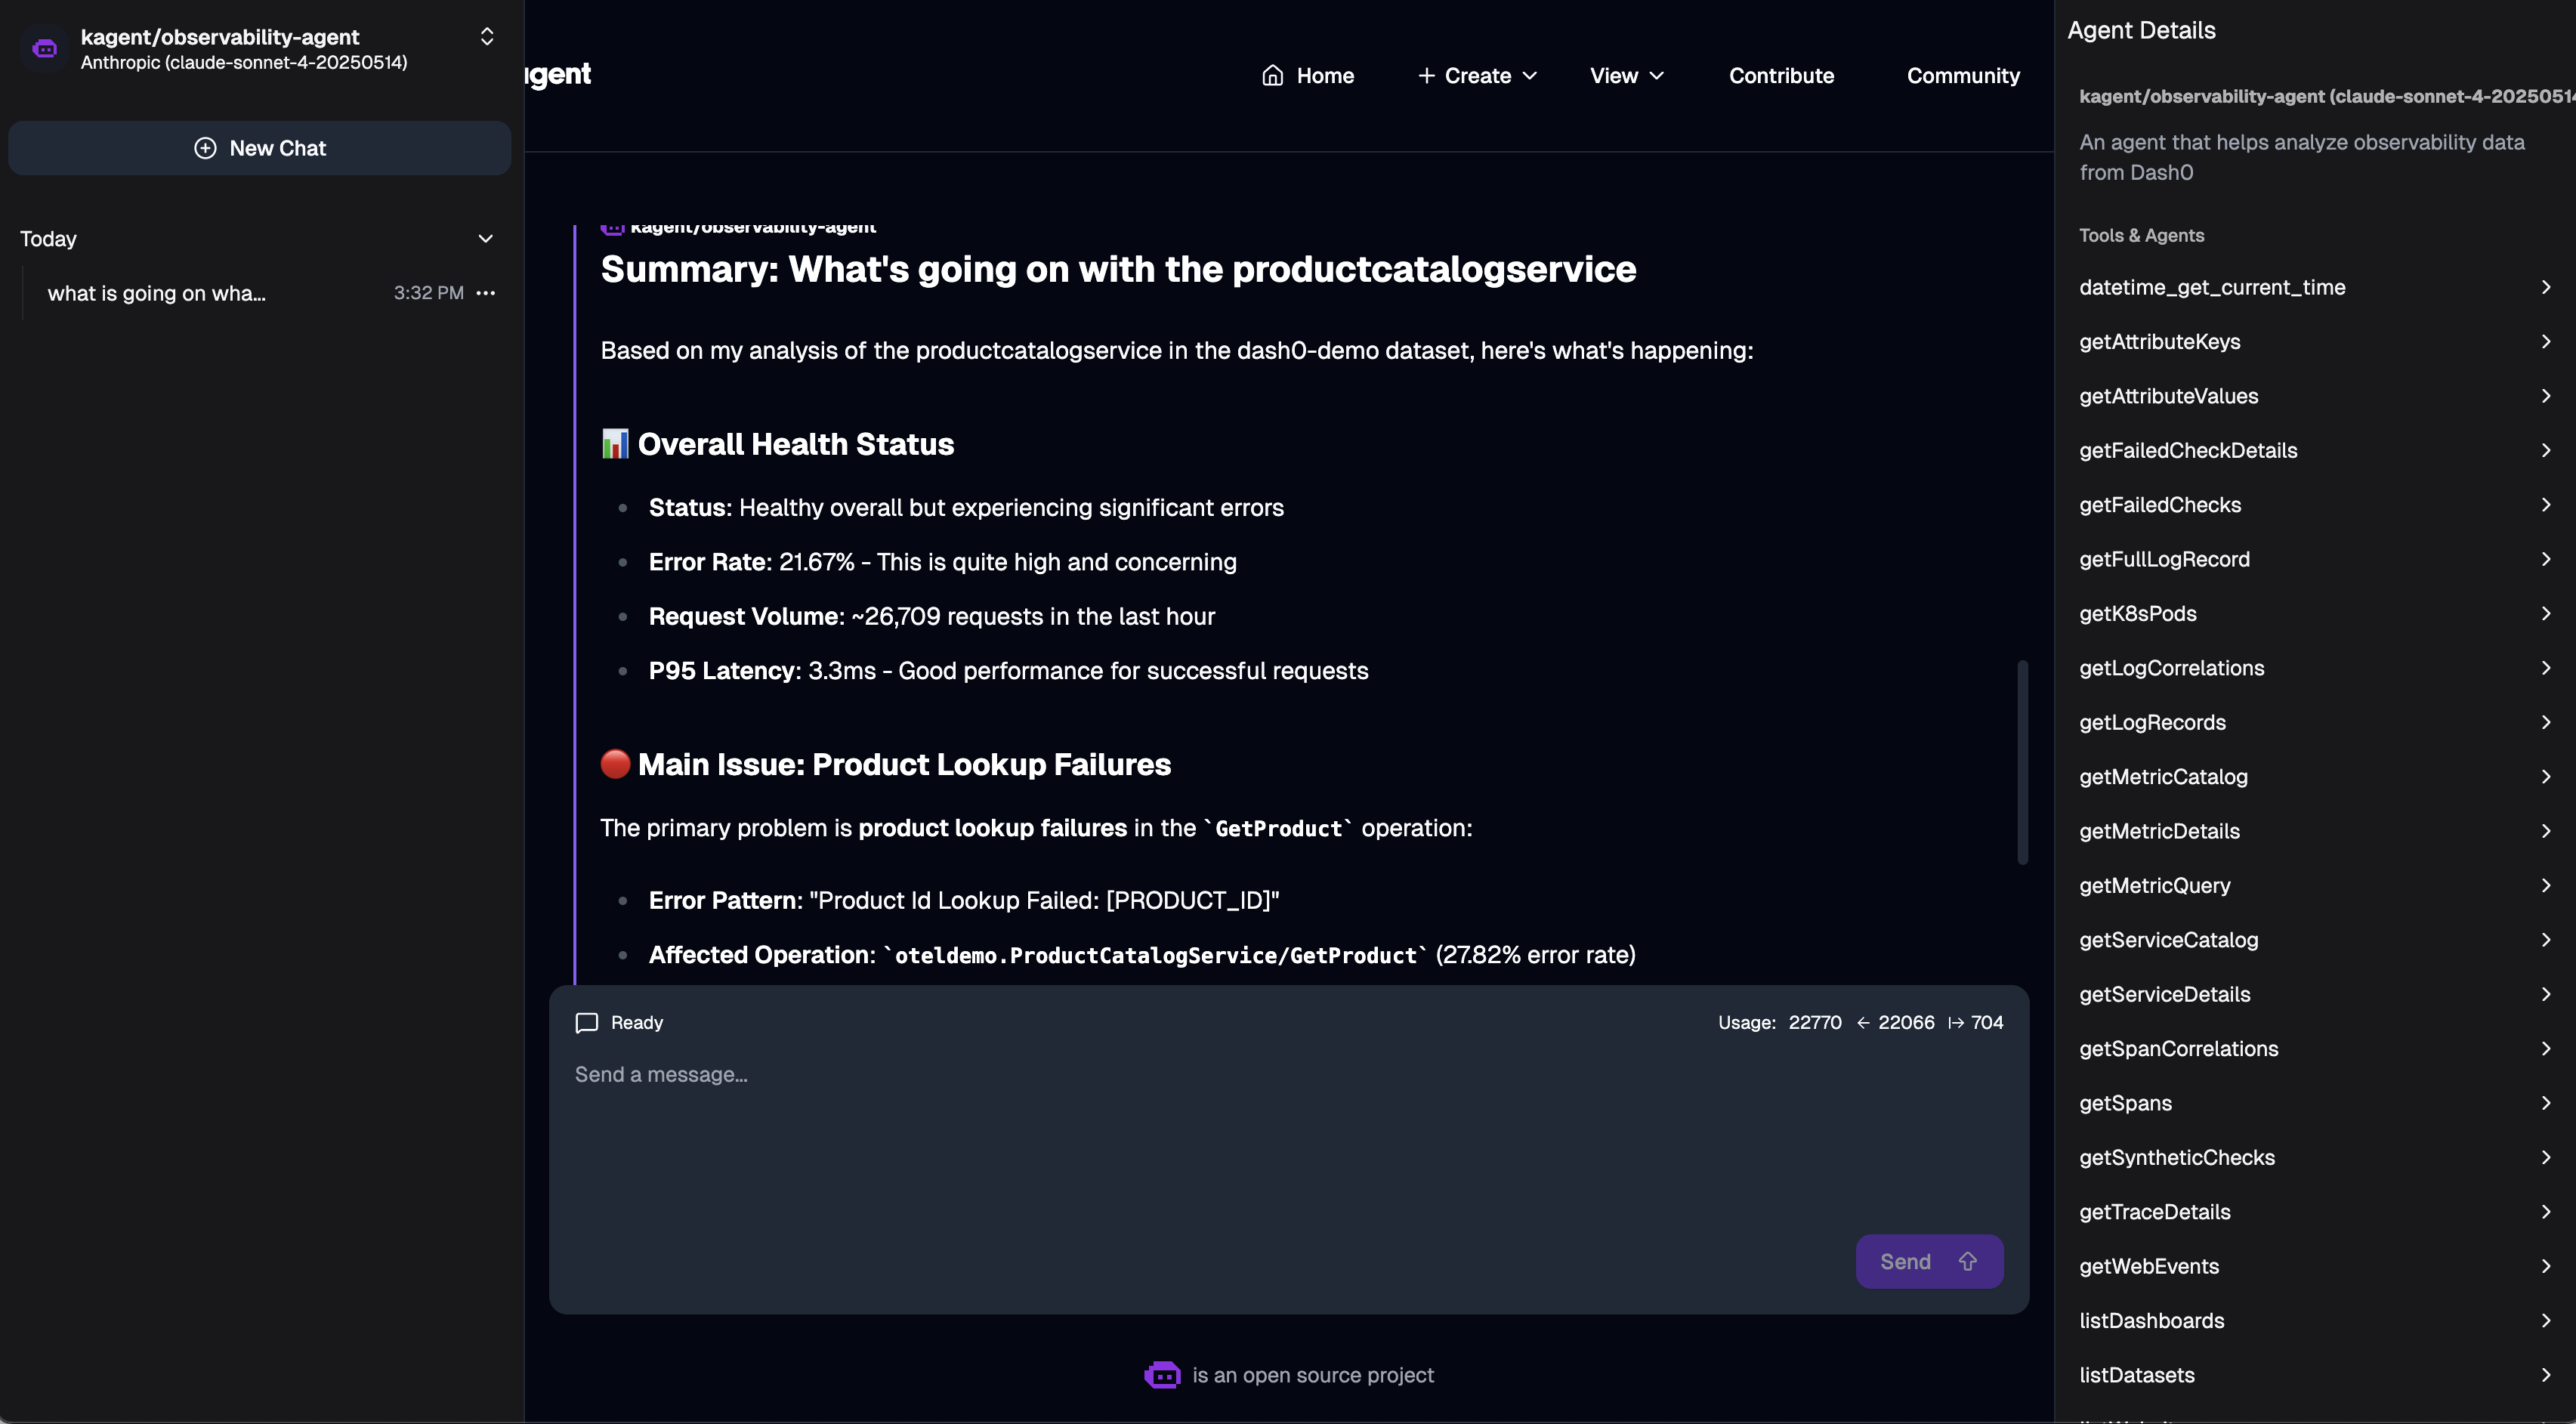
The agent will use Dash0 MCP tools to query your observability data and provide insights. All agent interactions are traced and sent to Dash0, allowing you to see how the agent uses different tools to answer your questions.