
Last updated: October 12, 2026
Create Check Rules from Scratch
Create check rules from scratch for full control over every configuration setting. This guide walks through the complete process step by step.
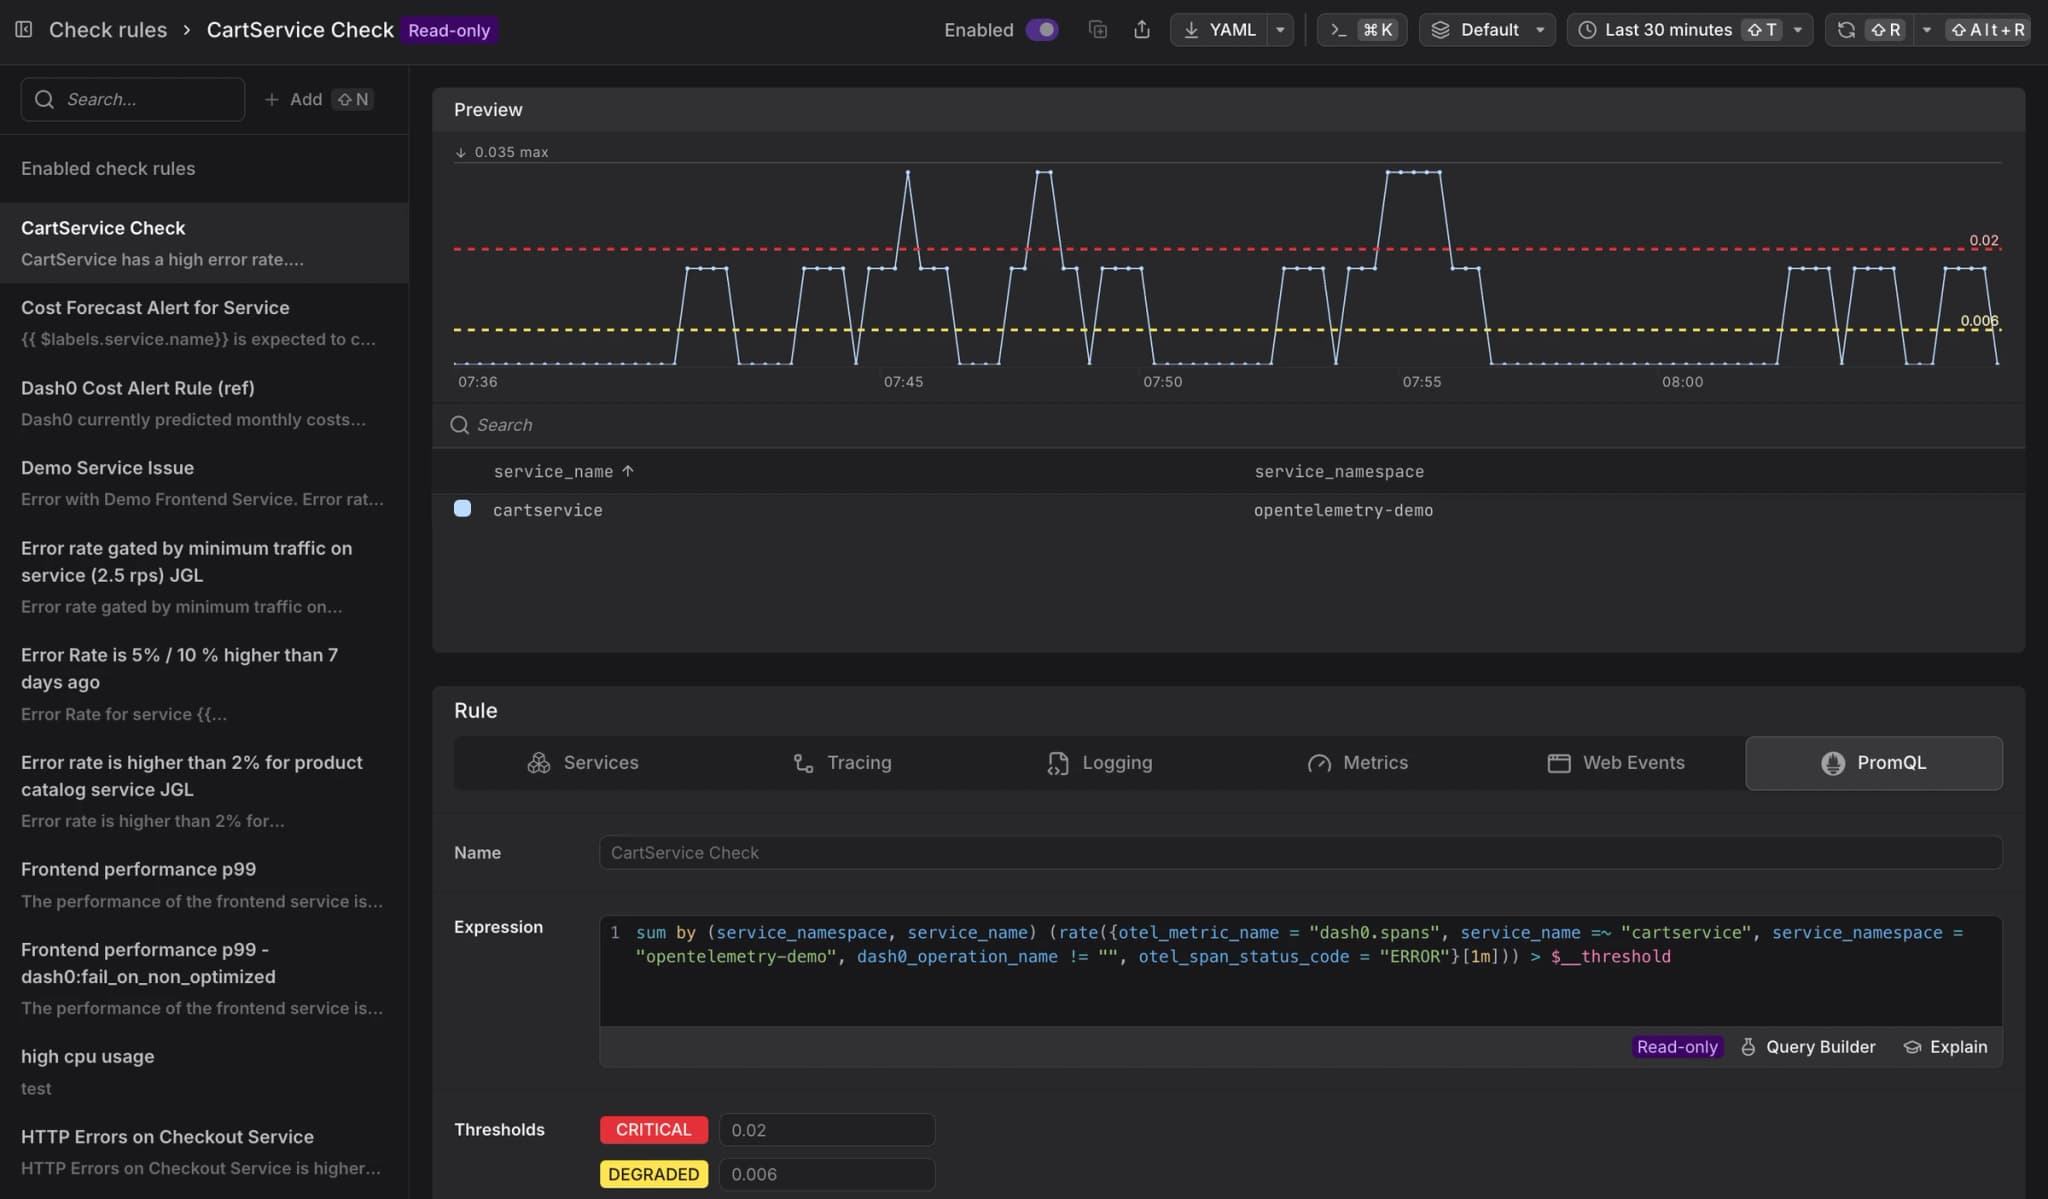
Creating check rules requires Admin privileges or a Maintainer role in the dataset. See About Alert Monitoring for details on access restrictions.
Step 1: Navigate to Check Rules
Access the Check Rules list through the Dash0 navigation menu or by going to the Check Rules in Dash0 directly.
- Click Alerting in the left navigation menu.
- Select Checks from the submenu.
You'll see a list of existing check rules (if any) with their current status, dataset, and severity indicators.
Step 2: Create a New Check Rule
Begin creating a new check rule by providing a descriptive name.
- Click the Add button in the top-right corner of the check rules list.
- Enter a descriptive name for your check rule in the Name field.
Use clear, descriptive names that indicate what the check monitors. Examples: "Frontend P99 Latency", "Payment Service Error Rate", "Database Connection Pool Exhausted".
Step 3: Build Your Query
The query defines what telemetry you're monitoring. The Query Builder is the interactive user interface for designing queries:
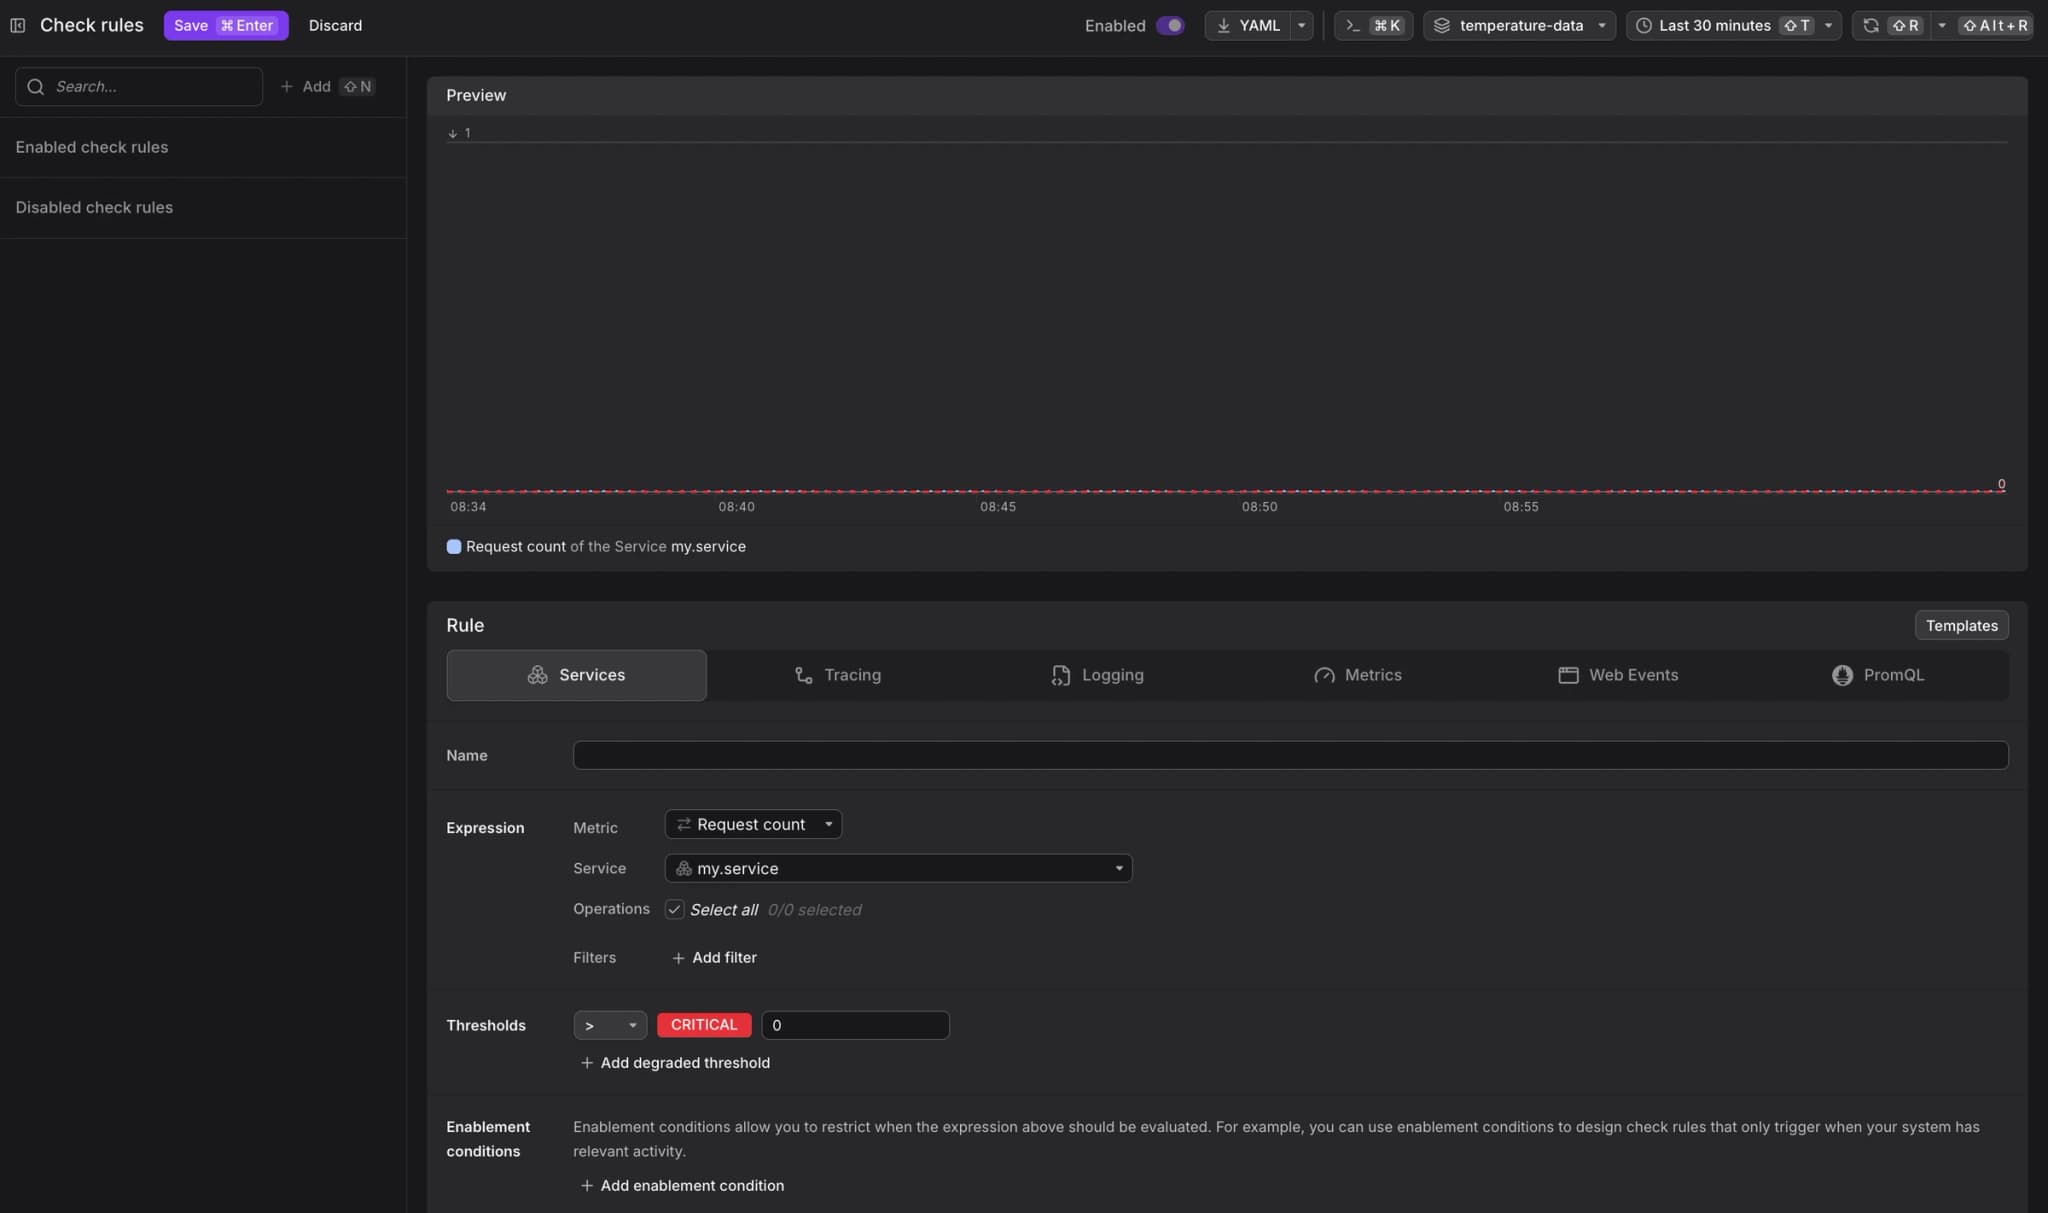
The Query Builder provides tabs for different telemetry types:
- Services: Monitor aggregated metrics across a service
- Tracing: Query span data and trace metrics
- Logging: Monitor log records and patterns
- Metrics: Query custom and OpenTelemetry metrics
- Web Events: Monitor browser telemetry and user interactions
- PromQL: Write raw PromQL expressions for maximum flexibility
Select the tab that matches your telemetry type, then configure your query using the visual builder. For detailed guidance on each tab, including step-by-step instructions, examples, and best practices, see About Query Builder.
- Use visual tabs (Services, Tracing, Logging, Metrics, Web Events) for guided query building
- Use PromQL tab for advanced queries involving multiple services, complex aggregations, or custom logic
- Use
$__thresholdin PromQL expressions as a placeholder for threshold values - Add aggregations (
sum by,avg by) to control how many separate alerts are created
Step 4: Preview Your Query
Review the preview chart to confirm your query returns the expected telemetry data before proceeding. After building your query, review the preview chart to verify it returns the expected data.
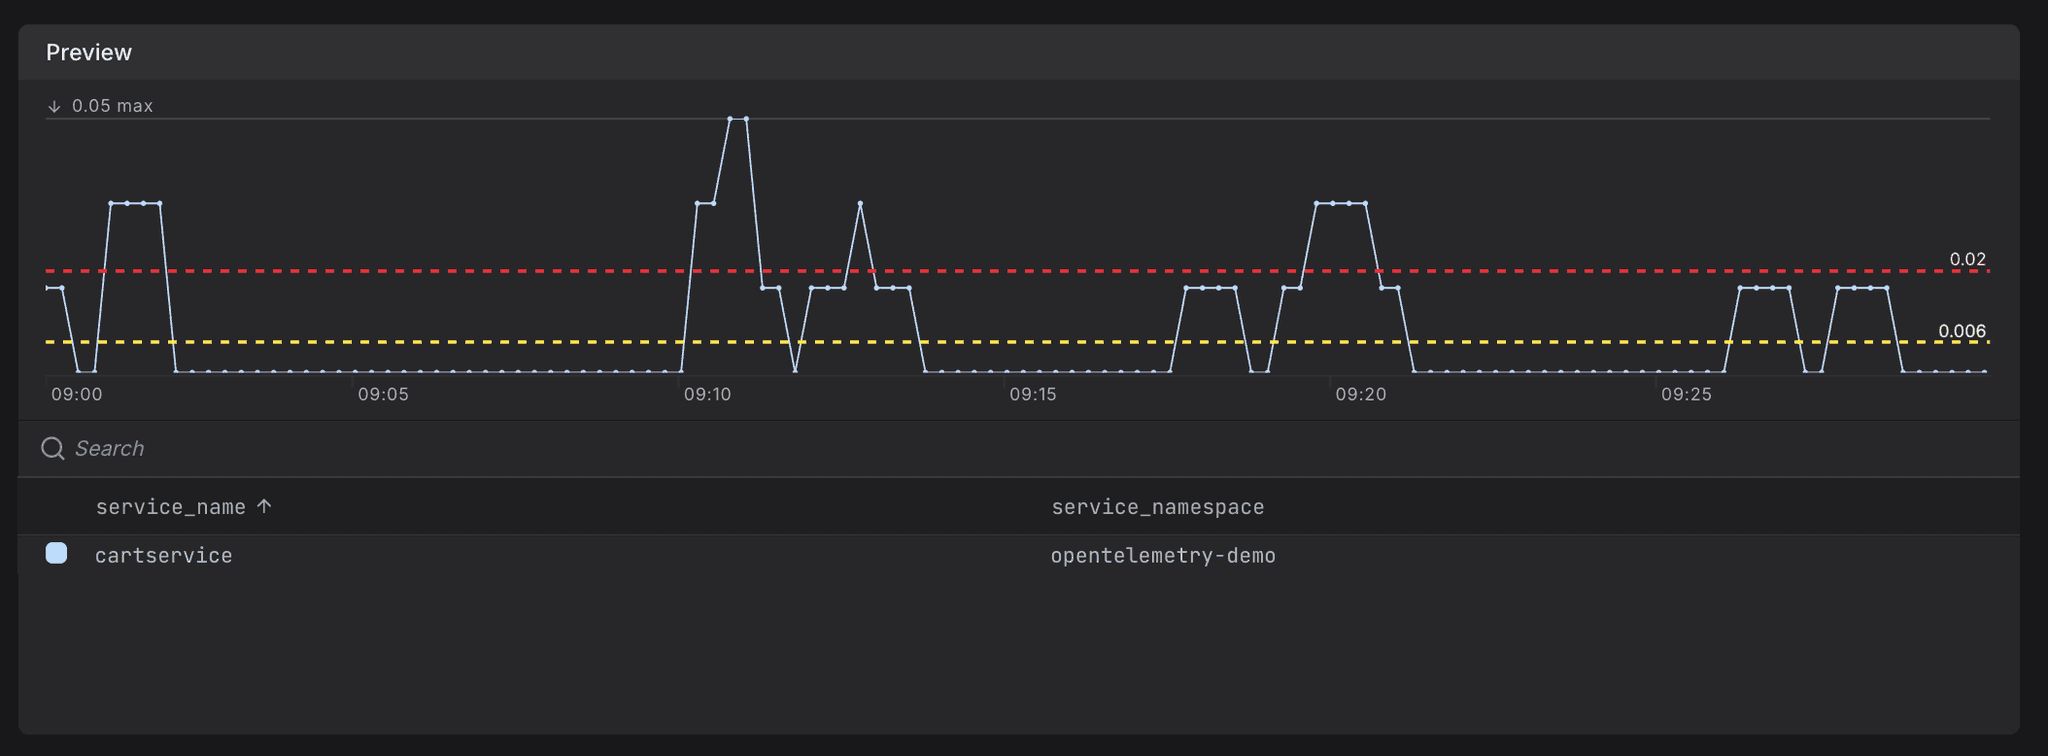
The preview chart shows:
- Recent values matching your query
- Time range (typically last hour)
- Legend indicating which series are being monitored
If the chart is empty or shows unexpected data, adjust your query filters or time range.
Step 5: Set Thresholds (Optional)
Define when your check should trigger alerts by setting threshold values.
-
Scroll to the Thresholds section.

-
Select a comparison operator (>, <, >=, <=, ==, !=) from the dropdown.
-
Enter a value for the Critical threshold (required).
-
Optionally, click Add degraded threshold to add a Degraded threshold.
- Critical: High-severity issues requiring immediate attention
- Degraded: Warning-level issues that may escalate
The comparison operator and threshold values work together to define the alert condition. For example, "> 100" fires when the metric exceeds 100. Your query must use $__threshold to reference these values. If both degraded and critical thresholds are defined and a metric value exceeds both, only the critical alert fires. Dash0 always fires the most severe applicable threshold.
When using Dash0's synthetic metrics ($__special metrics like service health, error rates, etc.), thresholds are built-in and optional. These metrics have default threshold values that fire alerts automatically. You can override them by explicitly setting threshold values. For custom metrics and standard PromQL queries, you must explicitly set thresholds and reference $__threshold in your query.
Step 6: Configure Evaluation Settings
Control how often Dash0 evaluates your check and when it triggers alerts.
Evaluation Frequency
Set how frequently Dash0 runs the check rule query.
-
Locate the Evaluate every dropdown.

-
Select an interval. The dropdown offers 1m (the default), 2m, 3m, 4m, 5m, 10m, 15m, and 1h.
Use shorter intervals (1m) for critical services requiring fast detection. Use longer intervals for non-critical checks or to reduce evaluation costs.
The interval you can use depends on your query window. Wider query windows require a longer minimum interval, and the query window may not exceed 7 days. See Check Rule Limits for the full table.
Grace Periods
Configure grace periods to prevent noisy alerts by requiring sustained threshold violations before firing.
-
Scroll to the Grace Periods section.

-
Set the For grace period (how long the threshold must be exceeded before alerting).
-
Set the Keep firing for grace period (how long the check remains active after recovering).
Grace periods are configured based on your evaluation interval. The options show both the multiplier and the actual time duration:
- None (0m): No grace period, alert immediately
- 1x (1m): Wait one evaluation cycle (e.g., 1 minute if interval is 1 minute)
- 2x (2m): Wait two evaluation cycles
- 3x, 4x, 5x: Longer grace periods for stable alerting
Example: With a 1m evaluation interval and "2x (2m)" for the "For" grace period, the check fires after 2 consecutive minutes of threshold violations.
Step 7: Add Enablement Conditions (Optional)
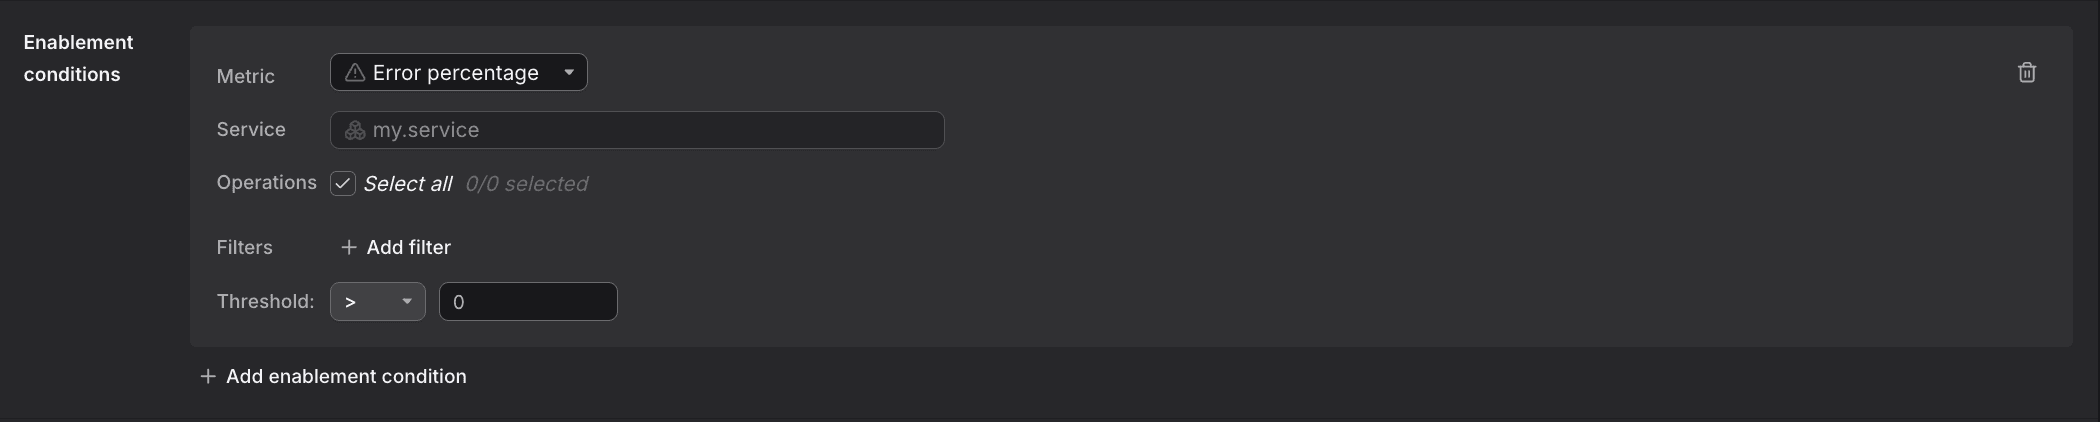
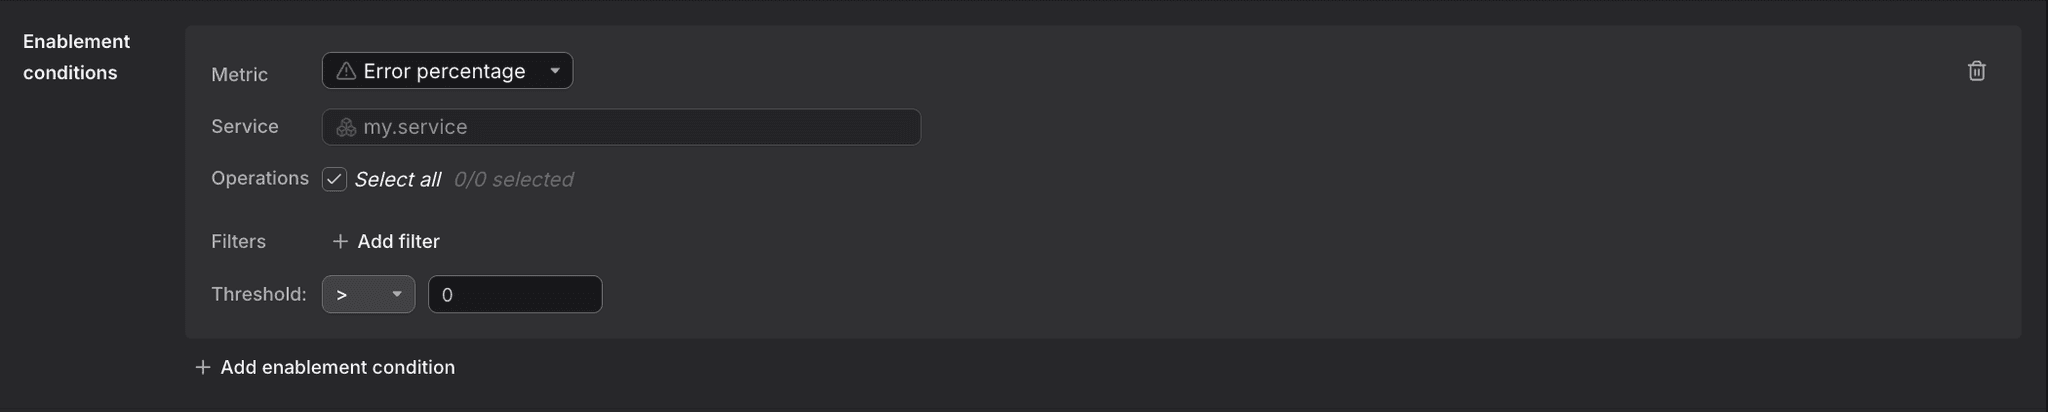
Optionally add enablement conditions to restrict when the check fires, acting as boolean guards on your main query.
-
Scroll to the Enablement Conditions section.
-
Click Add enablement condition.
-
Specify conditions that must be true for the check to fire. For example, only alert when the service has sufficient traffic. This prevents false alerts during maintenance windows or low-traffic periods.
Step 8: Configure Notifications
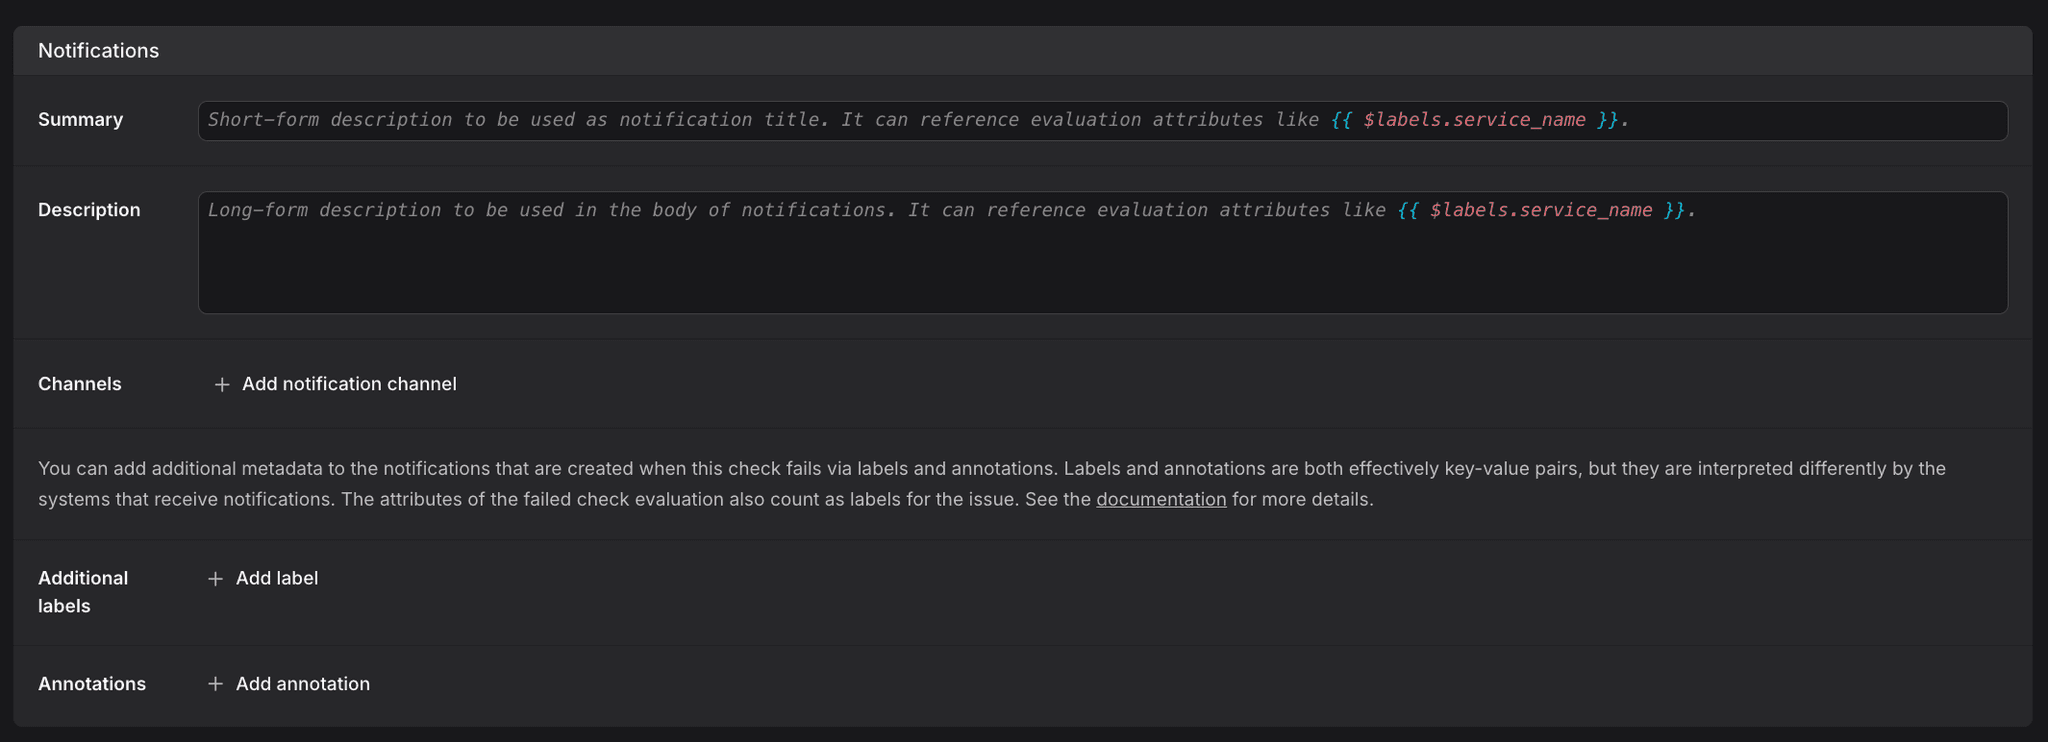
Set up how and where notifications are sent when the check rule fires by configuring the summary, description, and notification channels.
The UI-based approach described in this section is not the only way to configure notification channels. Instead, you can manage notification channels as code.
Create clear alert messages that will appear in notifications.
- Enter a concise Summary for the alert, which appears in notification titles.
- In the Description field, provide detailed context.
Example summary:
Frontend P99 latency exceeded {{$__threshold}}msExample description:
Service: {{$labels.service_name}}
Current value: {{$value}}ms
Threshold: {{$__threshold}}ms
Use template variables to make summaries and descriptions dynamic.
The editors provide auto-completion to help you discover the available labels and variables.

The auto-completion dropdown shows all available labels and variables based on your query evaluation. If you don't see the labels you expect, check the preview chart to confirm which labels your query produces.
{{$__threshold}}: The threshold value specified in the Thresholds section (degraded or critical, whichever fired). Note the two leading underscores.{{$value}}: The actual metric value that triggered the alert.{{$labels.label_name}}: Includes any label from your query results or hard-coded labels.
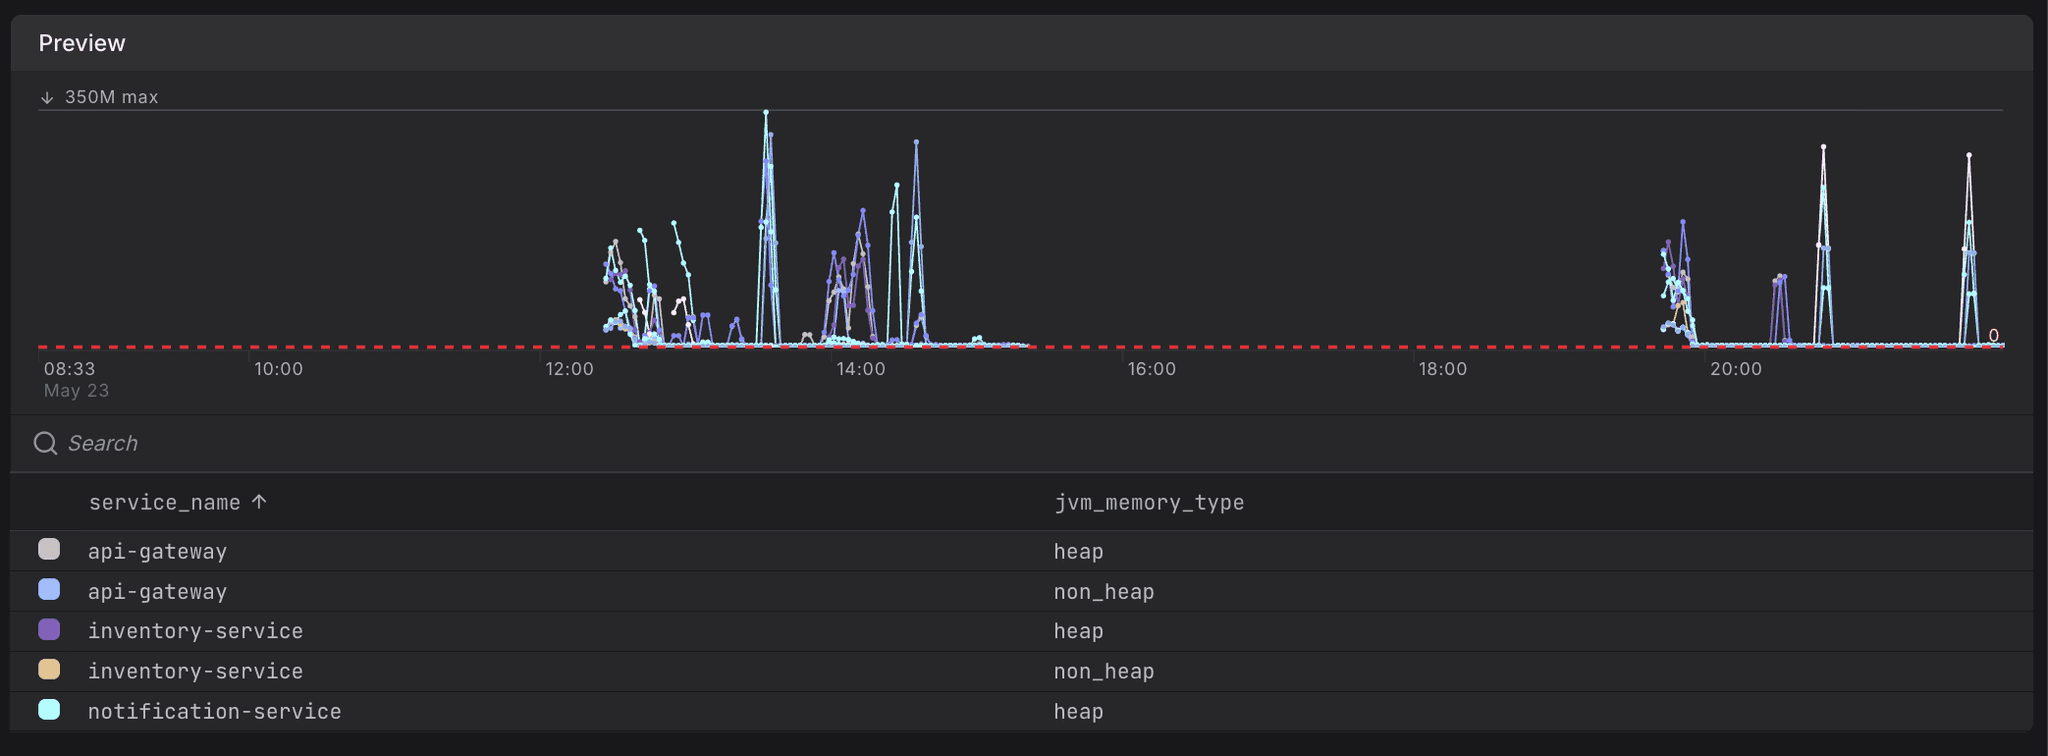
Where labels come from:
- Labels projected by your PromQL query, such as
{{ $labels.service_name }}and{{ $labels.jvm_memory_type }}below. These are visible in the evaluation preview chart legend, such as
 service_nameandjvm_memory_typebelow.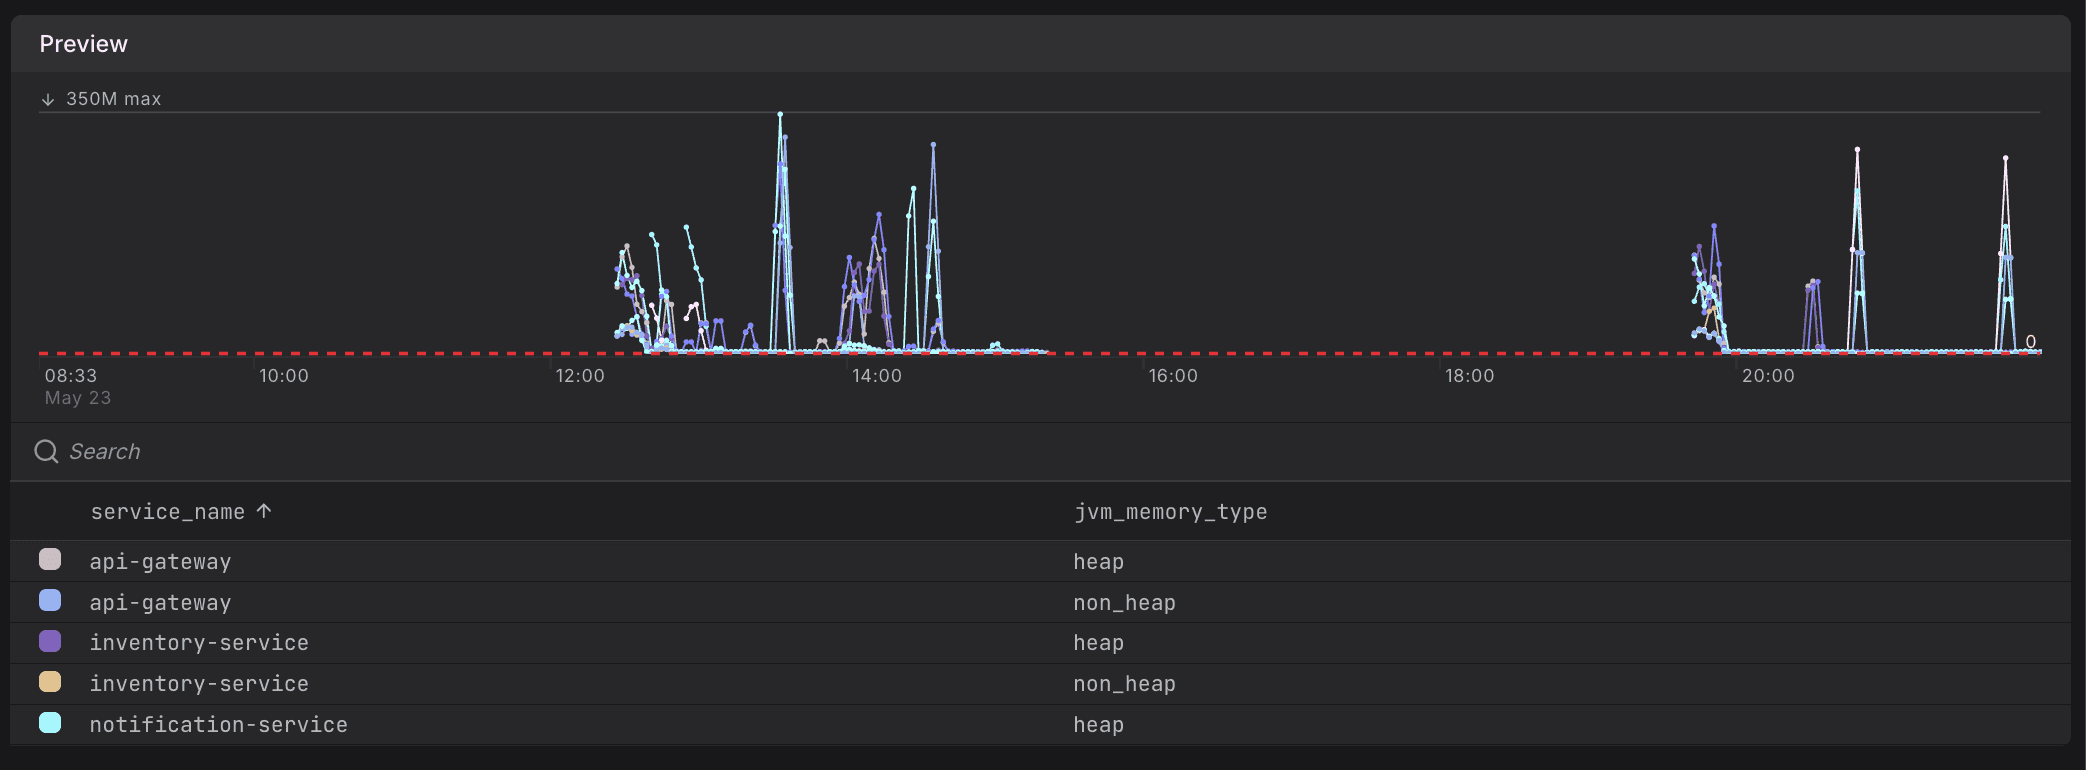
- Custom labels, which you define.
 You define these as part of the check rule in the Additional Labels section, such as
 team:srebelow.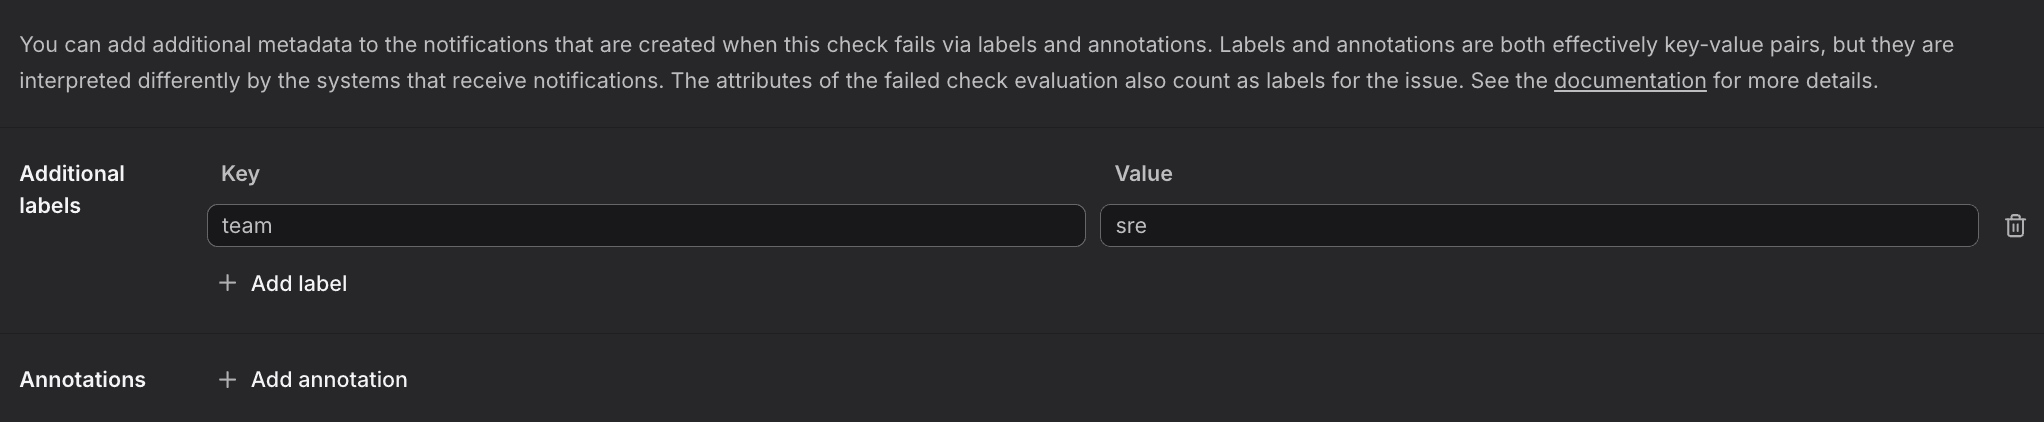

Use the $__threshold placeholder in your check rule query, and it will be replaced with the actual threshold value during evaluation.
For details, see Optimize Alert Messages with Templates for all available variables and template functions.
Step 9: Configure Notification Channels
Configure where alert notifications should be sent when the check rule fires.
The UI-based approach described in this section is not the only way to configure notification channels. Instead, you can manage notification channels as code.
- Go to the Notification Channels settings.
- Click Add Channel.
- Select a channel from the dropdown.
Notification channels must be configured before they appear in this list. See Set Up Notification Channels for channel setup instructions.
Instead of hardcoding channels, you can use labels to route alerts dynamically:
- Add a label to your query (e.g.,
team="frontend"). - Configure routing rules in Dash0 to send alerts based on label values.
See Route Check Rule Notifications for routing configuration.
Step 10: Save and Verify Your Check Rule
Review and save your check rule configuration to activate it.
- Review all settings.
- Click the Save button in the top-right corner.
- Wait for the confirmation message.
Your check rule is now active and will begin evaluating at the configured interval. You can see it in the check rules list with its current status.
After saving, verify the check rule is working correctly by reviewing its evaluation history.
- Return to the Check Rules list.
- Click on your newly created check rule.
- Review the timeline chart showing evaluation history.
Further Reading
- About Alert Monitoring — Overview of Dash0's alerting capabilities
- Generate Check Rules with Agent0 — Use AI to generate check rule configurations
- Investigate Failed Checks — Troubleshoot failed checks
- Route Check Rule Notifications — Use label-based routing to direct alerts
- Set Up Notification Channels — Configure notification channels