Last updated: July 27, 2026
Understand Synthetic Metrics
Synthetic metrics are metric signals that Dash0 derives on demand from raw telemetry — logs, spans, web events, profiles, and synthetics — rather than from pre-stored metric time series.
They let you query high-cardinality observability data using the same PromQL interface as ordinary metrics.
Dash0 provides the following synthetic metrics:
- Core signals:
dash0.resources,dash0.logs,dash0.spans,dash0.spans.duration,dash0.span.events,dash0.metrics.datapoints - Web monitoring:
dash0.web.events,dash0.web.vitals.lcp,dash0.web.vitals.inp,dash0.web.vitals.cls,dash0.web.sessions,dash0.web.sessions.duration,dash0.web.bounces,dash0.web.users,dash0.web.page_views,dash0.web.errors,dash0.web.requests,dash0.web.requests.duration - Synthetic checks:
dash0.synthetic_check.runs,dash0.synthetic_check.http.dns.duration,dash0.synthetic_check.http.connection.duration,dash0.synthetic_check.http.ssl.duration,dash0.synthetic_check.http.request.duration,dash0.synthetic_check.http.response.duration,dash0.synthetic_check.http.total.duration
How They Work
When you query a synthetic metric such as dash0.logs, Dash0 does not read a stored counter. Instead, it reads the raw underlying records for the selected time range, aggregates them at a granularity appropriate to the query step size, and returns a time series on the fly.
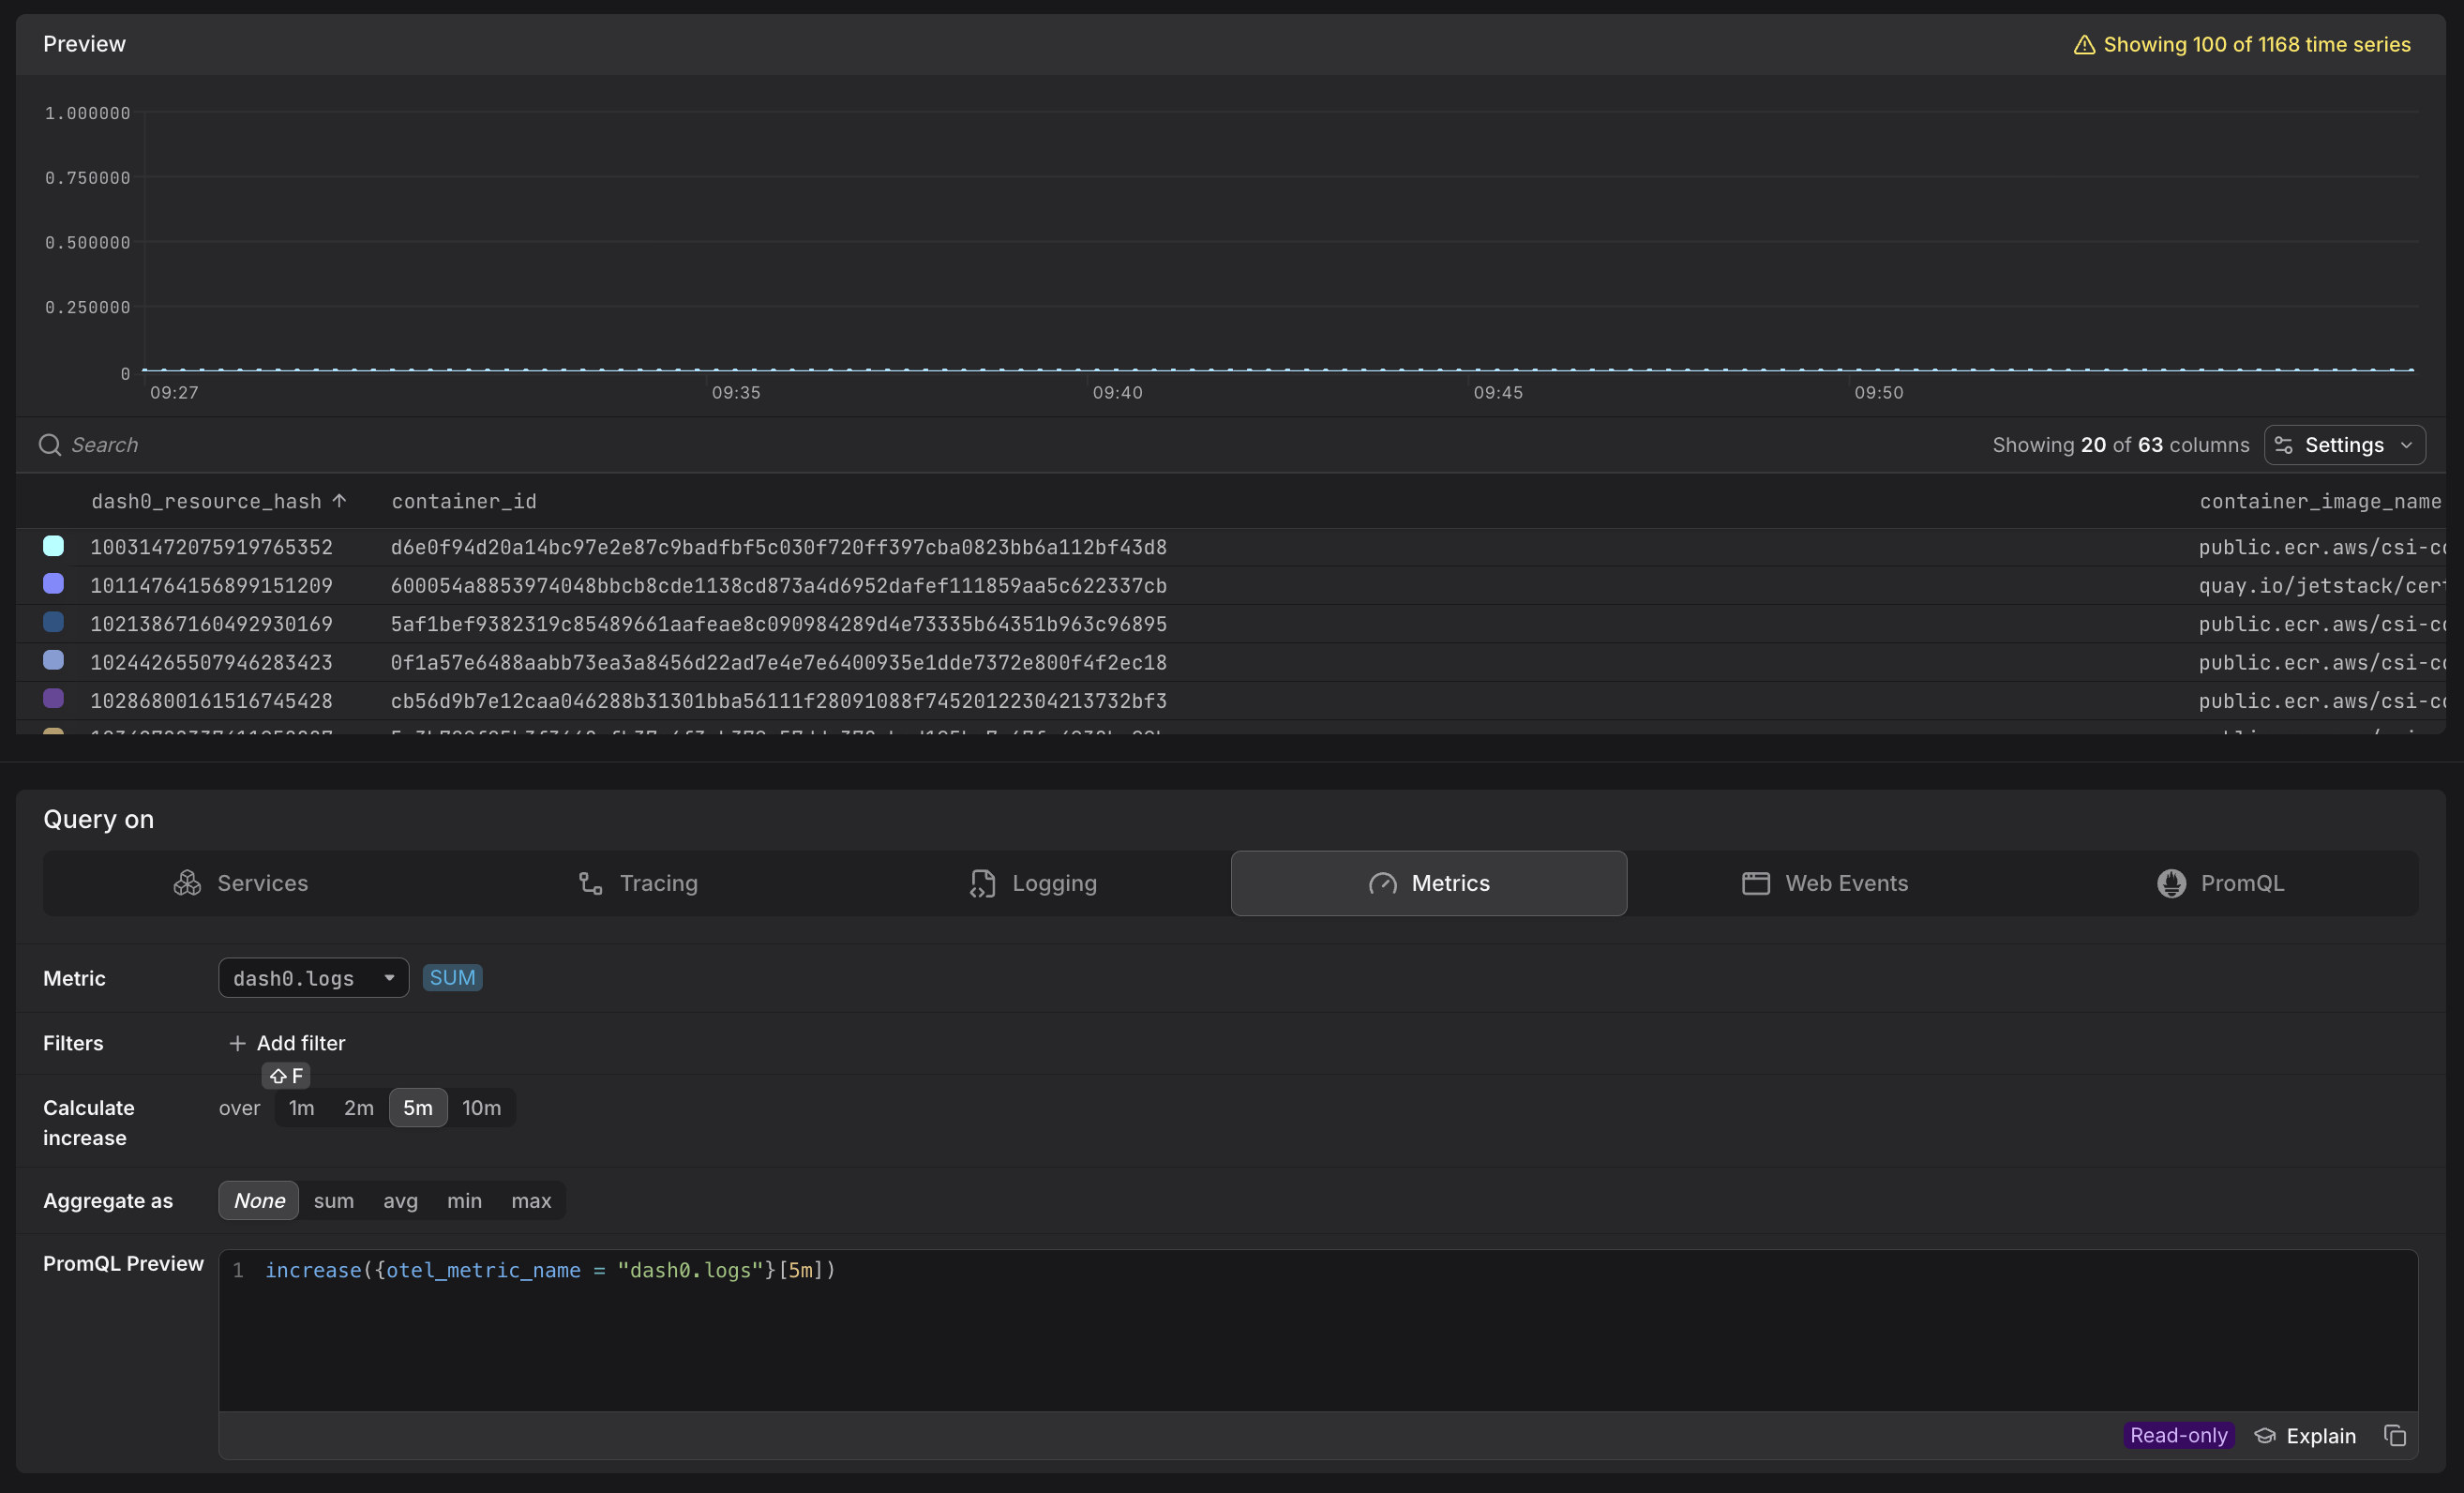
Because PromQL expects these values to behave like cumulative counters, the raw values monotonically increase over time. For this reason, Dash0 always wraps synthetic metrics in increase() by default — both in the visual Query Builder tabs and in data previews in the Metric Sidebar. The increase() function calculates the total increase of the cumulative counter over each evaluation step, so that a chart shows the actual count of events per interval rather than an ever-growing cumulative value. Use rate() instead when you need a per-second value.
Default Grouping and Cardinality
Logs, spans, and web events can have very high cardinality: a single log stream may carry attributes from thousands of services, pods, and request paths, all with different shapes. Returning all of those dimensions by default would make most queries unusably large.
To keep synthetic metrics practical out of the box, Dash0 aggregates them to the resource level by default. This constrains the number of returned time series to the number of distinct resources (e.g., pods or services) that emitted the underlying records — regardless of how many other attributes those signals carry.
This resource-level aggregation is a Dash0 behavior specific to synthetic metrics and is just a starting point. You can go beyond resource-scope attributes at any time: use the Split by option in the Query Builder, or write a PromQL aggregation directly (for example, sum (...) by (...)) to group by any attribute the underlying signals carry.
Accessing Additional Dimensions
The resource-level default is a starting point, not a limit. You can materialize any dimension you need using the Split by controls in the Query Builder, which appear once you select an aggregation function (sum, avg, min, or max).
By default, the Split by field is pre-populated with dash0.resource.id — this is what produces the resource-level breakdown. You can:
- Replace
dash0.resource.idwith a different attribute to pivot entirely to a new dimension. - Click "+ Add split" to add further dimensions alongside the existing ones, producing one time series per unique combination of values.
Some common splits for synthetic metrics:
| Signal | Split by attribute | What you see |
|---|---|---|
dash0.logs | dash0.log.pattern | Log volume broken down by message pattern |
dash0.logs | otel.log.severity.text | Log volume broken down by severity level |
dash0.spans | service.name | Span count broken down by service |
For example, below you see the result of splitting by dash0.log.pattern.
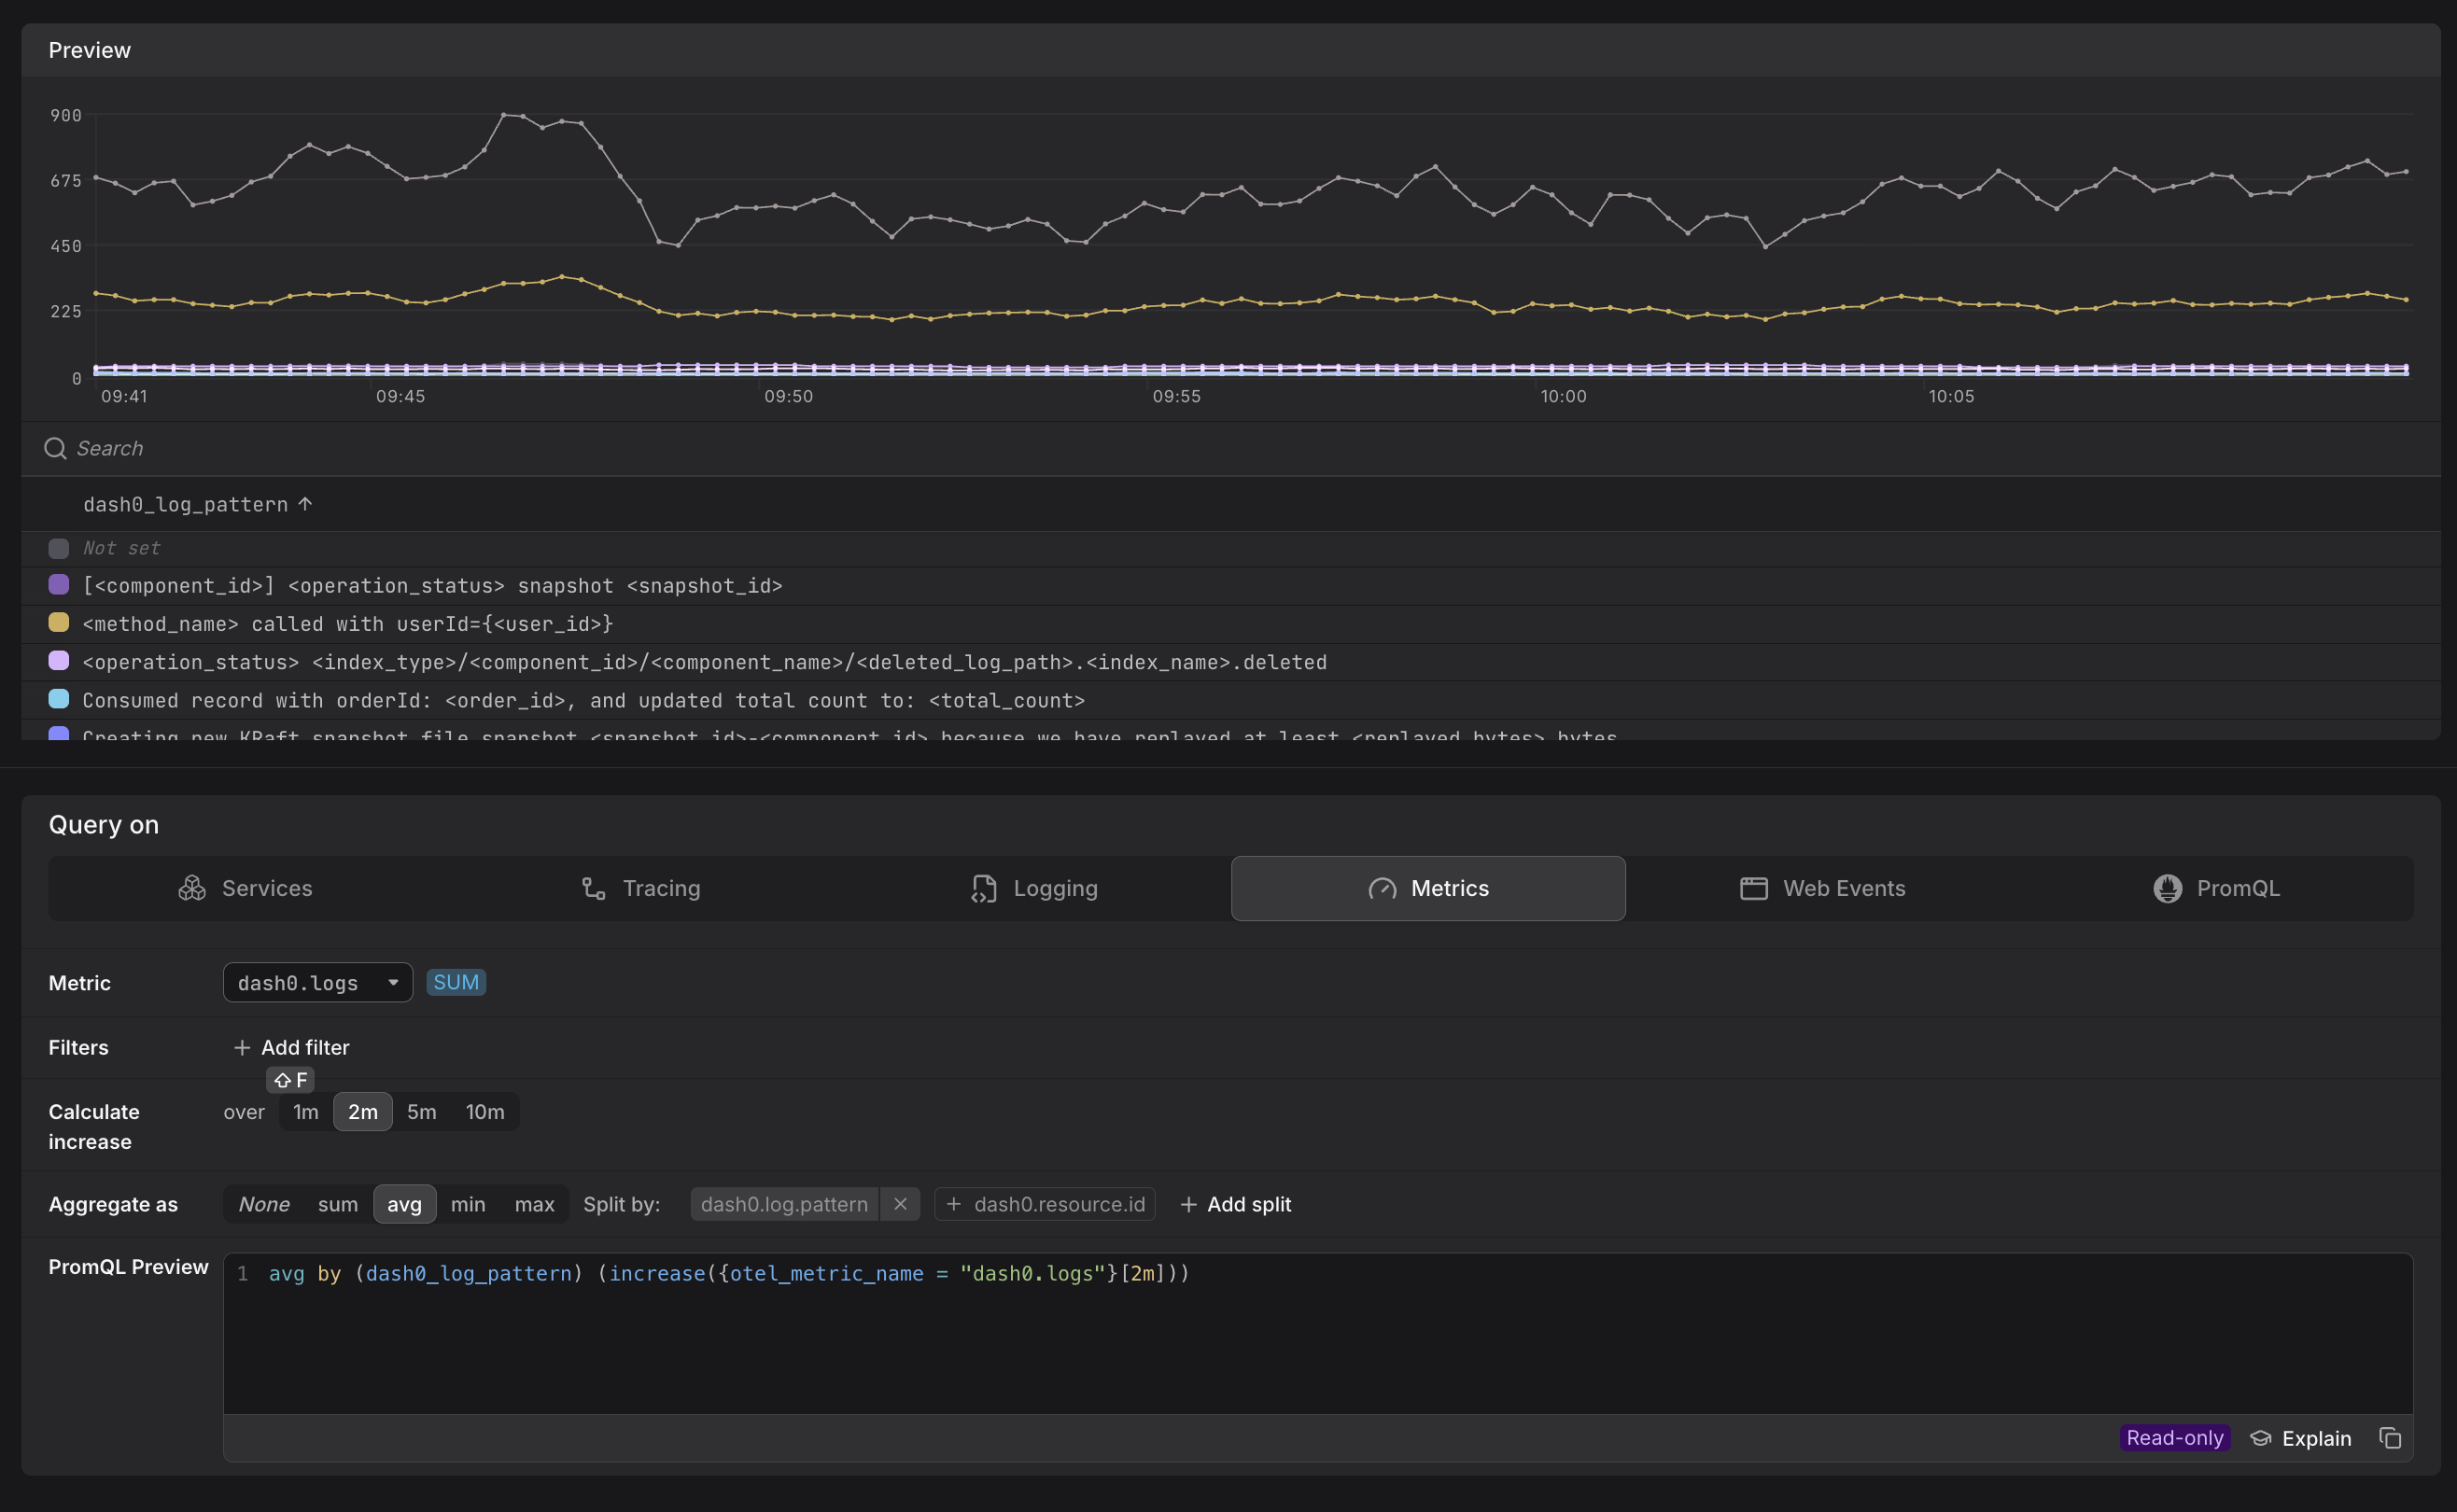
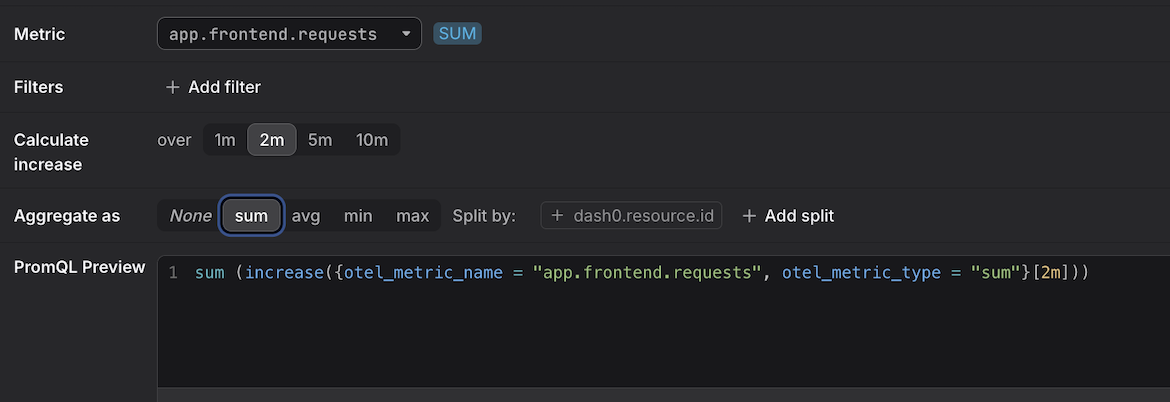
Each split attribute is reflected immediately in the PromQL Preview as a by (...) clause.
For example, selecting avg and splitting by service.name produces:
1avg by (service_name) (increase({otel_metric_name = "dash0.logs"}[2m]))
You can also add a Filter before splitting to constrain which records feed into the aggregation — for example, filtering to a single service.name before splitting by log.pattern keeps cardinality manageable while still exposing the detail you need.
Synthetic Metrics vs. Ordinary Metrics
| Ordinary metric | Synthetic metric | |
|---|---|---|
| Storage | Stored as a time series | Derived on demand from raw records |
| Cardinality | Determined by instrumentation | Constrained by default to resource level; expandable via Split by |
| Resolution | Defined by the sender | Determined by query step size |
| Default aggregation | Returns all time series | Wrapped in increase() automatically |
| Examples | app.ads.ad_requests, kube_pod_info | dash0.logs, dash0.spans |
Further Reading
- Query Metrics in the Query Builder — how to use Split by and PromQL to explore synthetic metric dimensions.
- Understand OpenTelemetry Metric Names — how
otel_metric_nameworks and how it relates to Prometheus name translation.