Last updated: July 27, 2026
Browse and Filter Metrics
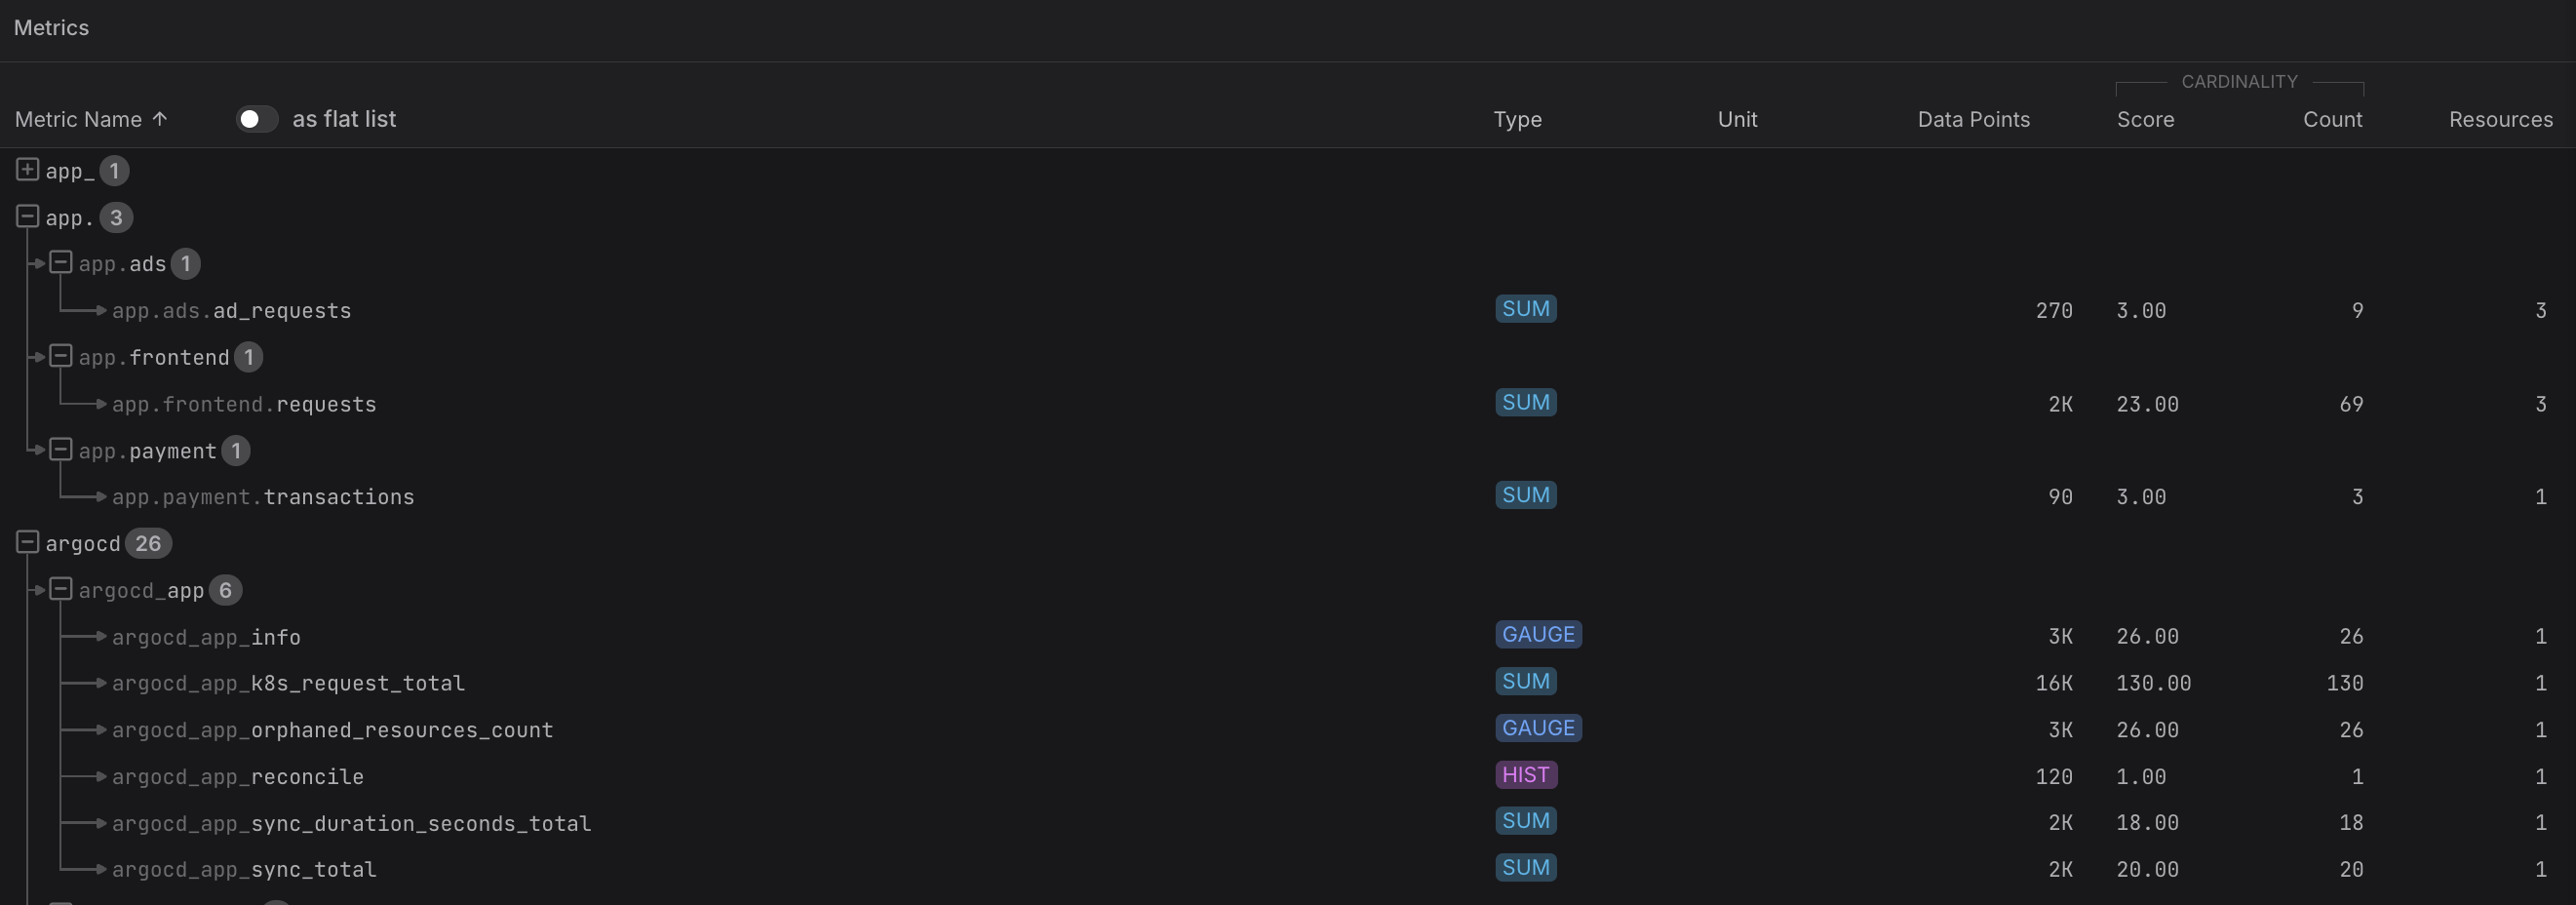
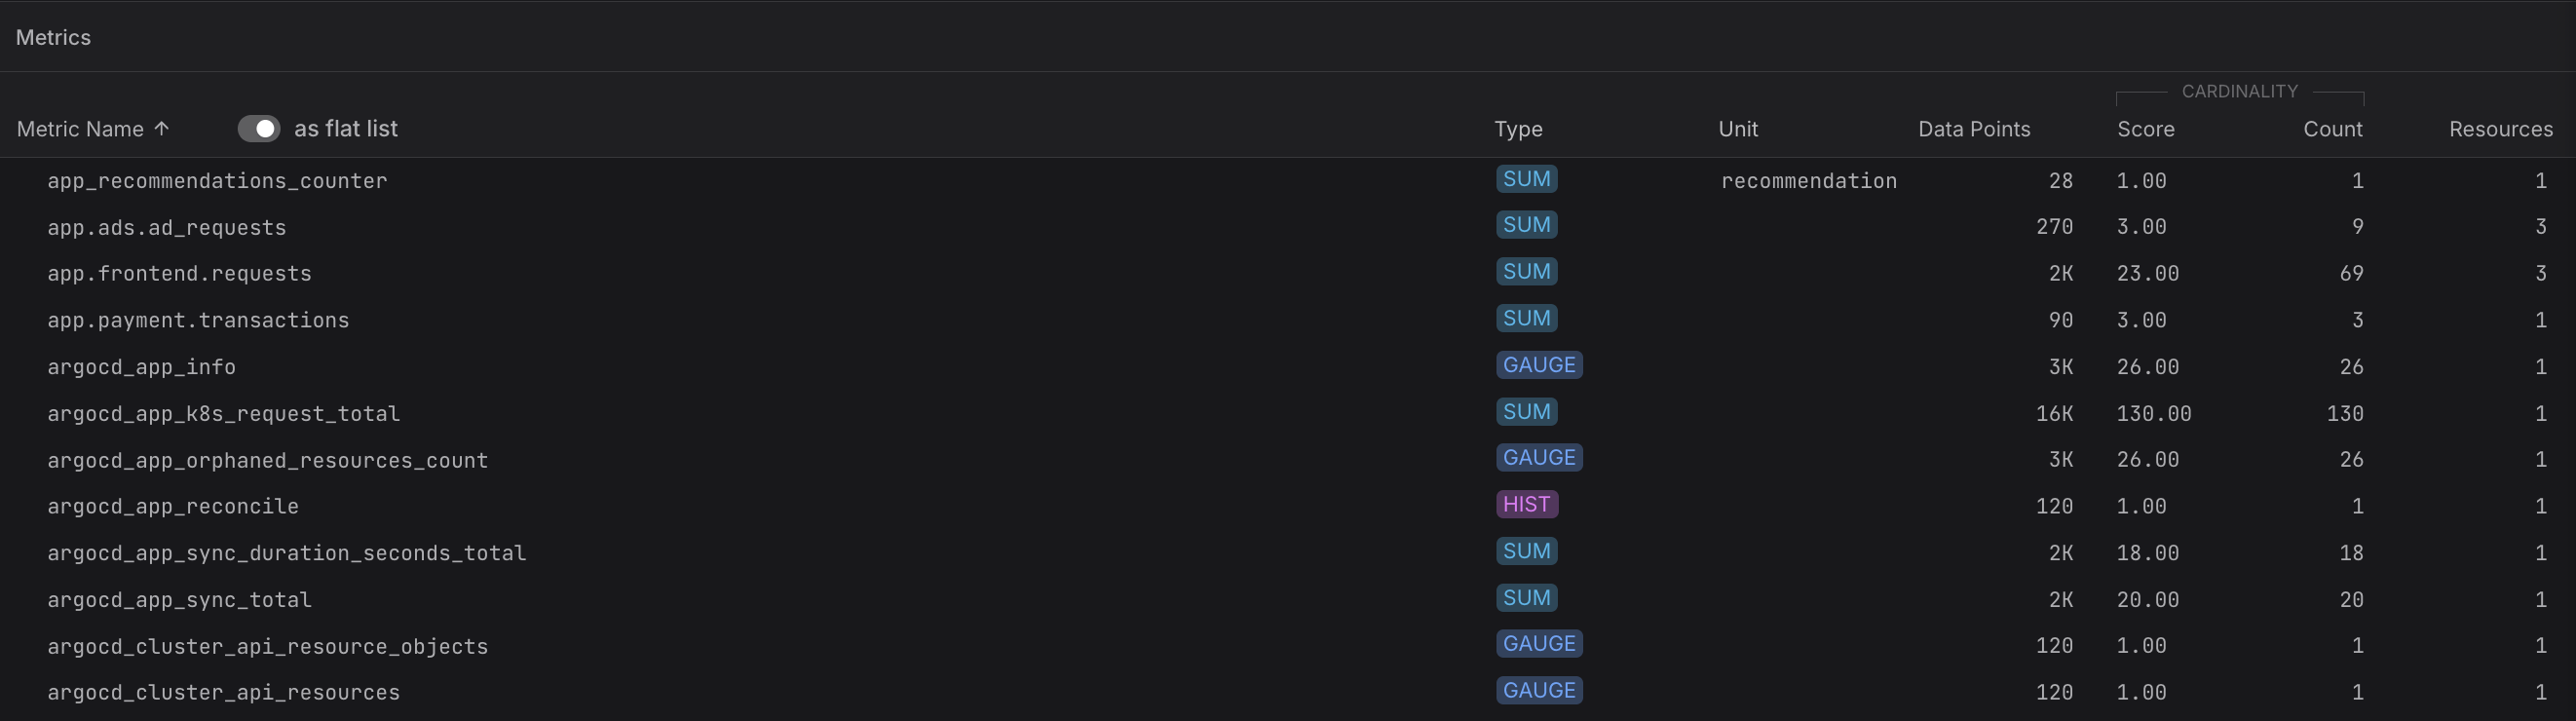
The Metrics table beneath the tree map lists every metric signal available in the selected time range. You can switch between a grouped namespace view and a flat alphabetical list, and narrow the results with the filter bar.
Toggle as flat list at the top of the table to switch between the two display modes:
- Grouped (default) — collapses metrics into a collapsible namespace hierarchy based on dot-separated name segments (e.g.
app.ads,app.frontend,argocd). Useful when you know the namespace you are looking for and want to reduce visual noise.
- Flat list — shows every metric as its own row in alphabetical order. Useful for scanning across namespaces or when you want to sort by a specific column.

Click any metric row to open the Metric Sidebar for a detailed view of its attributes, associated resources, and a live data preview. From there, you can navigate directly to the Query Builder to run aggregations and slice the data further.
Table Columns
Each metric row (in flat-list mode, or when a group is expanded) shows:
| Column | Description |
|---|---|
| Metric Name | The OpenTelemetry metric name as reported by your instrumentation. |
| Type | The OTLP metric data type (SUM, GAUGE, HIST, EXP HIST, SUMMARY). |
| Unit | The unit declared in the metric definition, if any. |
| Data Points | The number of data points ingested in the selected time range. |
| Score | A Dash0-calculated cardinality score that divides the metric's time-series cardinality by the number of reporting resources — a high score means disproportionately many time series per resource. |
| Count | The raw cardinality count — the number of unique time-series combinations observed. |
| Resources | The number of distinct resources that have reported this metric. |
Use the Search and filter bar at the top of the page to narrow the list. You can filter by any resource attribute or metric signal attribute — for example, to show only metrics from a specific service or Kubernetes namespace. Filters apply to both the tree map and the table simultaneously.