Last updated: July 27, 2026
Inspect Metric Details
Clicking any metric row in the Metric Explorer opens the Metric Sidebar — a detail panel that surfaces everything Dash0 knows about that metric without leaving the explorer.
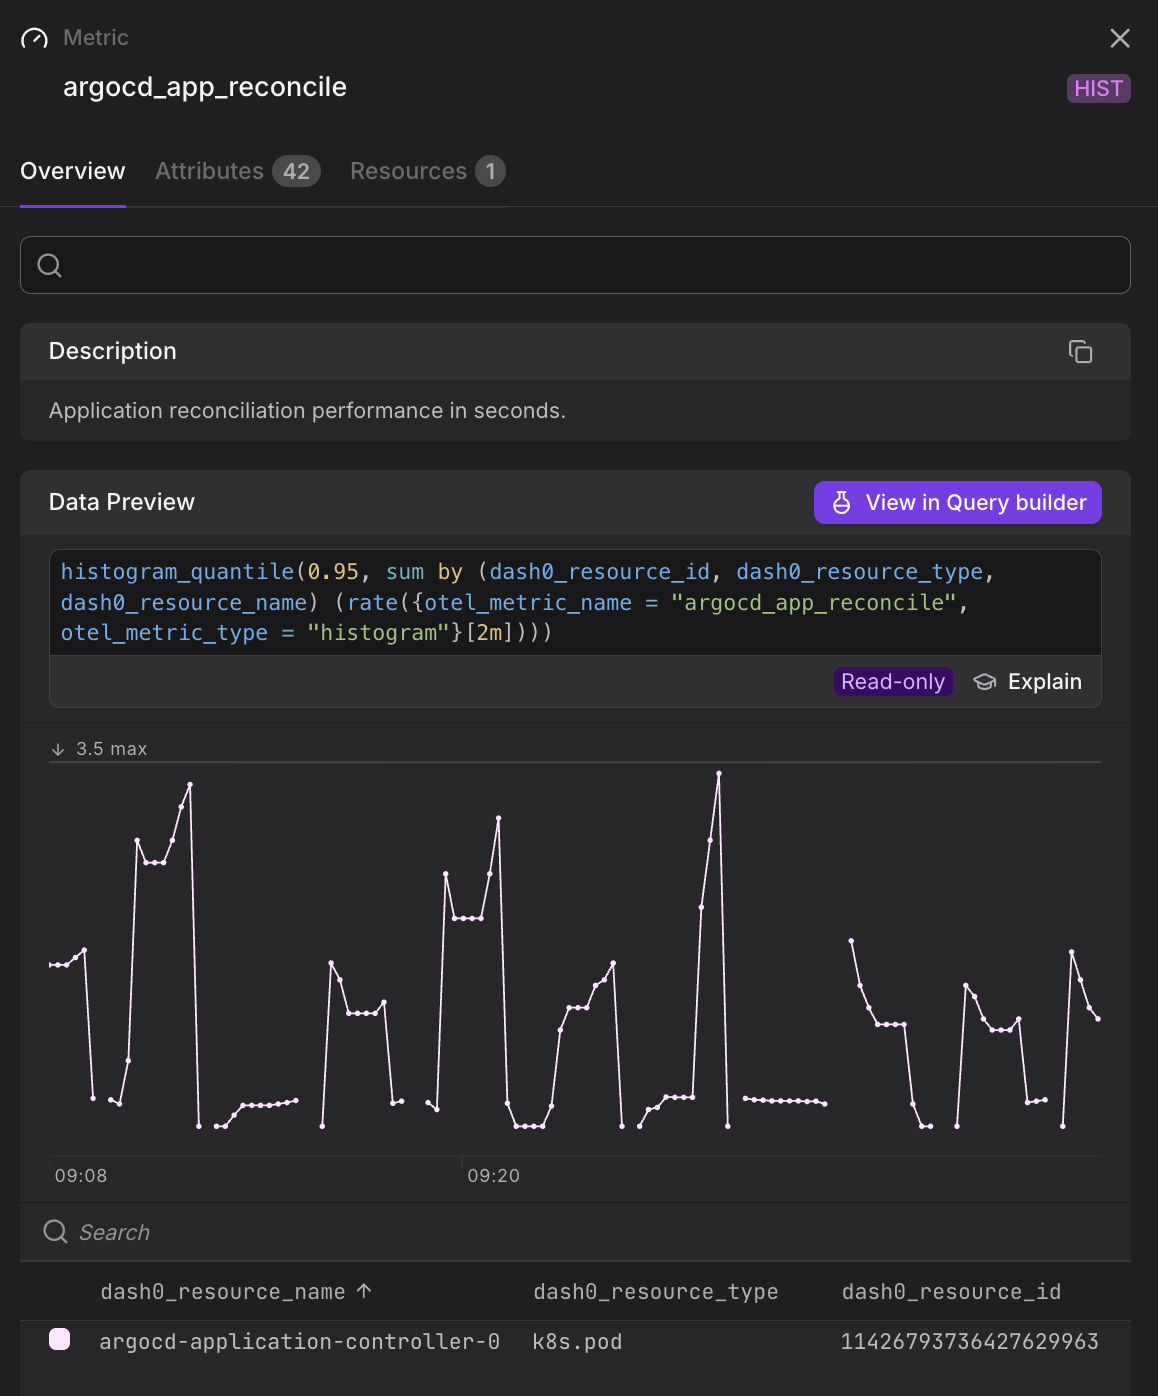
Select View in Query Builder in the Overview tab to open the metric directly in the Query Builder. The data-preview query is pre-populated, giving you a ready-made starting point for further analysis, filtering, and aggregation.
Sidebar Tabs
The sidebar is organized into three tabs:
Overview
The default tab. It shows:
- Description — the human-readable description attached to the metric definition, if one was provided by the instrumentation.
- Data Preview — a read-only PromQL query and a live time-series chart, so you can immediately see the shape of the data. The query uses
otel_metric_nameandotel_metric_typelabel matchers and wraps the result inincrease()for cumulative metrics. Select Explain to get a plain-language explanation of the query. - Dimension table — a list of all time-series returned by the preview query, with their resource and metric attributes.
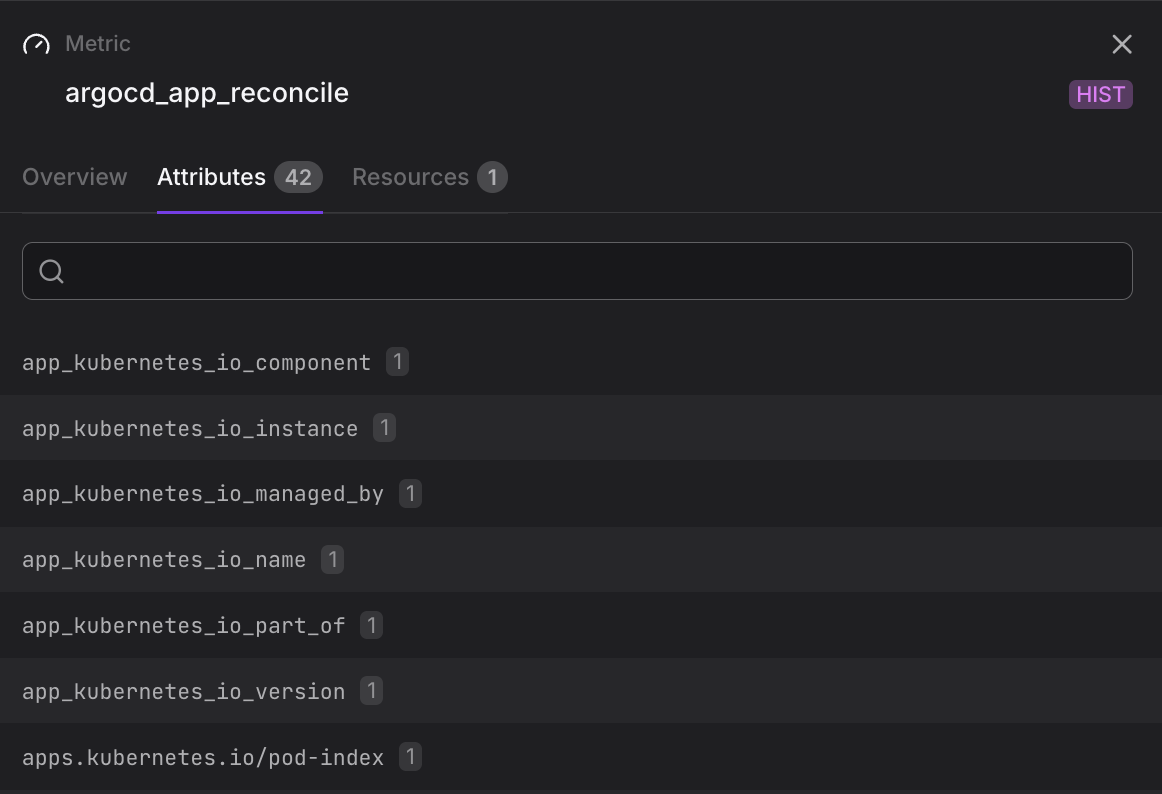
Attributes
Lists all attribute keys and their observed values that contribute to the cardinality of this metric.
The tab badge shows the number of distinct attribute keys and the total number of unique values across all keys. Use this tab to understand what is driving cardinality.
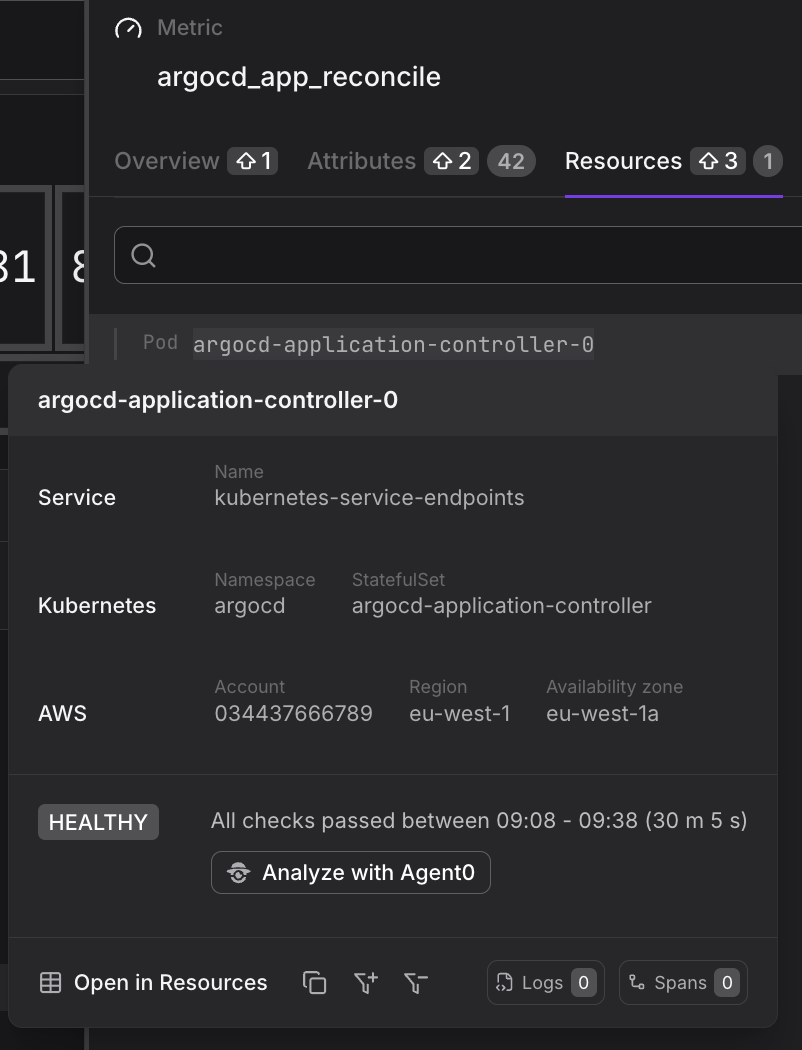
Resources
Lists all resources that have reported this metric in the selected time range.
The tab badge shows the resource count. Use this tab when you want to know where a metric is coming from rather than what its values are.