Last updated: July 14, 2026
Common Metric Query Issues
Learn how to avoid the most frequent PromQL traps with concrete examples and actionable solutions for building better alerts and dashboards. This guide covers range alignment issues, naming conventions when working with OpenTelemetry metrics in PromQL, and Dash0-specific query behaviors.
Range Misaligned to Step Sizes
One of the most subtle and common mistakes in PromQL is using a range selector that doesn't match your visualization or evaluation interval. This creates a situation where your charts and alerts don't reflect the actual behavior you're trying to monitor.
The Problem
When you query with a range selector like sum(increase({otel_metric_name="dash0.spans"}[1m])), you're calculating the total increase over a 1-minute window. However, if your chart's step size is set to 2 minutes, PromQL will evaluate this query every 2 minutes, but each evaluation only looks at the most recent 1 minute of data.
This means you're missing half of the data. If you have a traffic spike that lasts 1 minute but occurs in the middle of a 2-minute evaluation window, you might only capture a fraction of it or miss it entirely.
Concrete Example
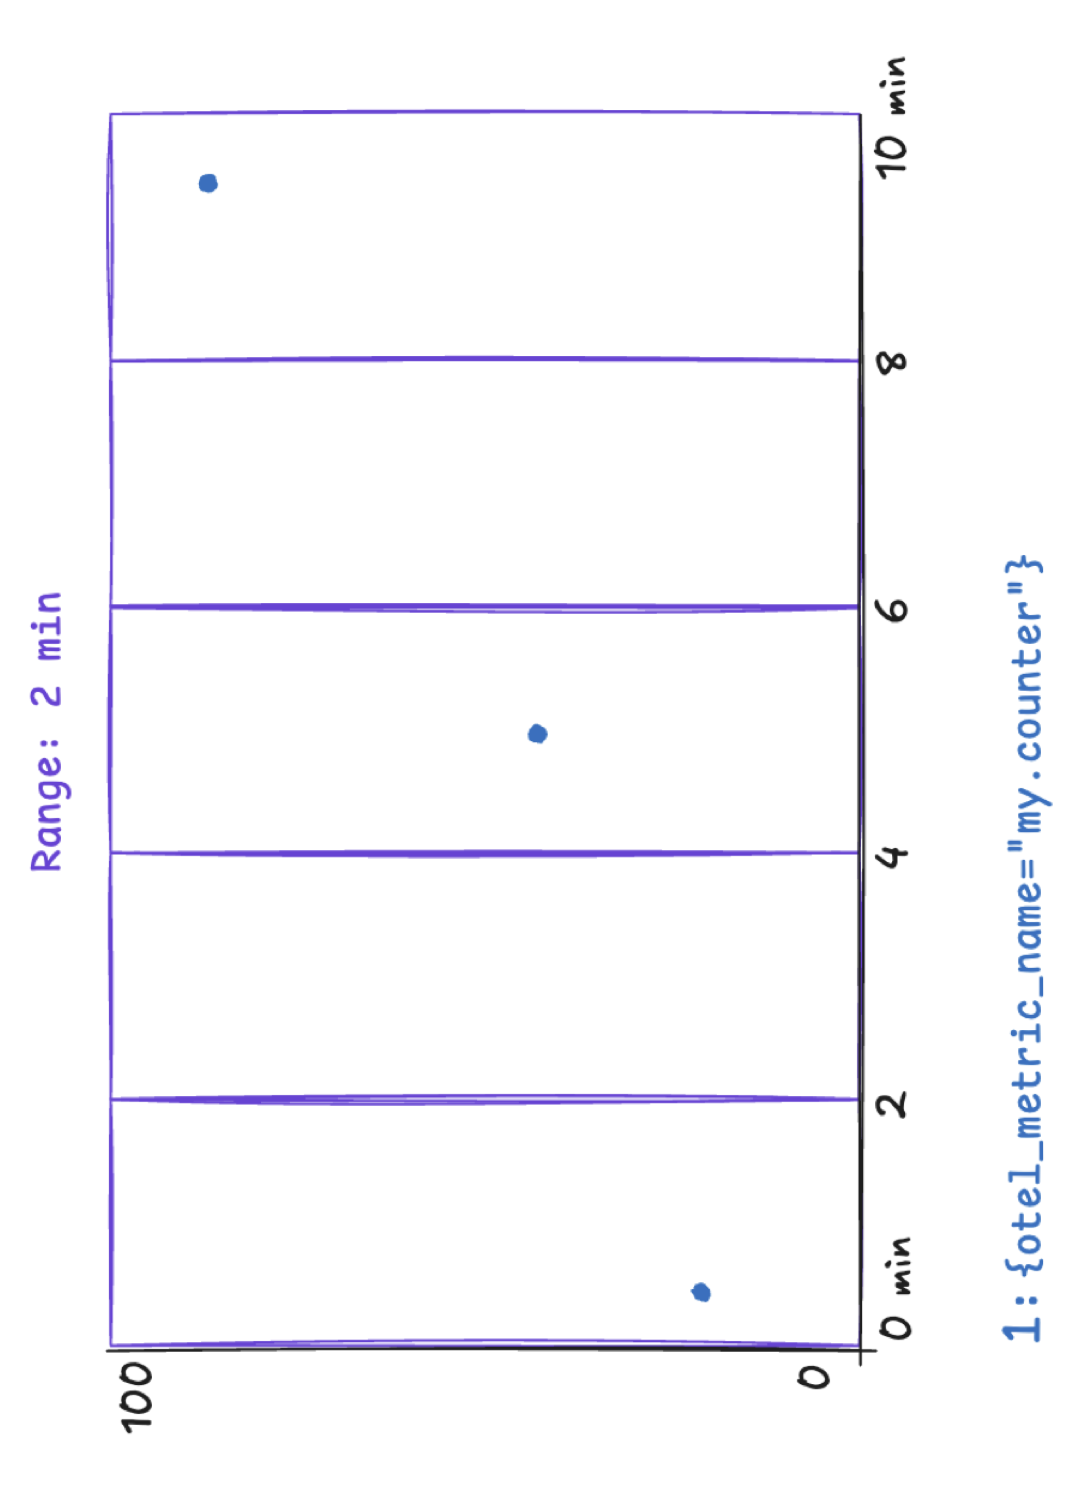
Consider these underlying data points powered by Dash0's synthetic dash0.spans metric. In this example we assume a step size of 2 minutes.
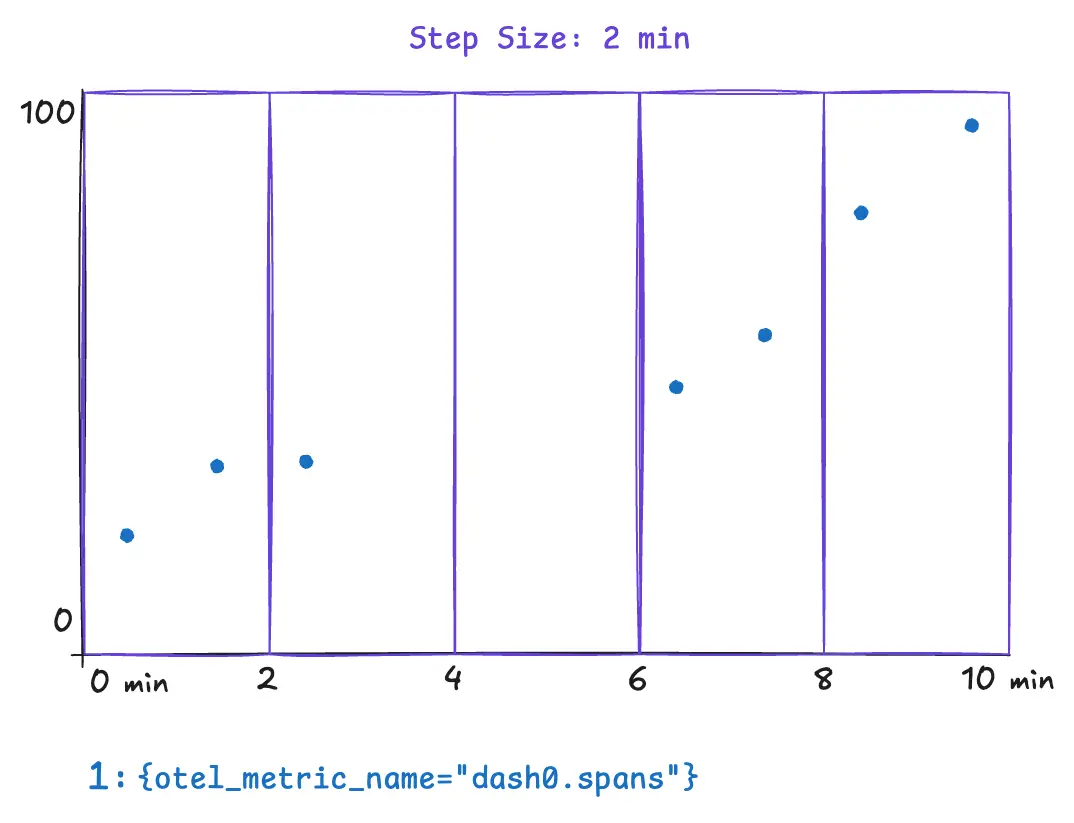
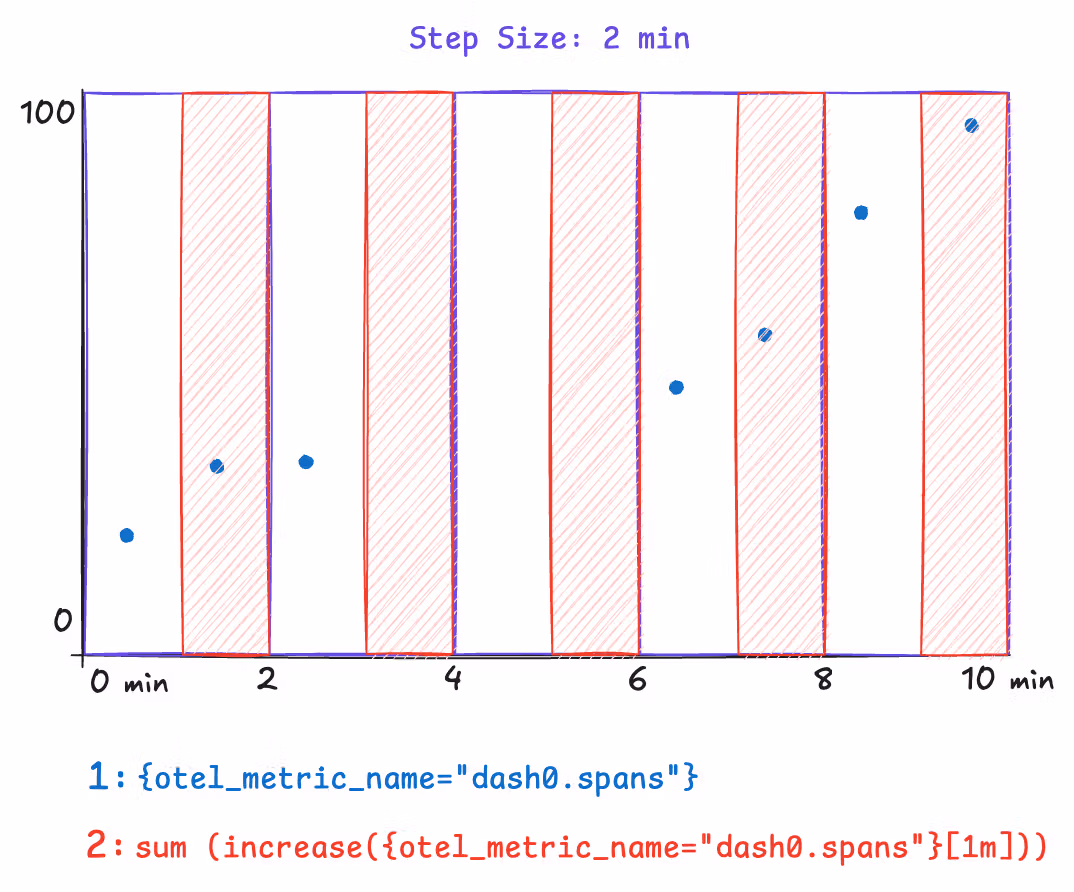
The following example illustrates a metric query that can yield surprising and incorrect results. The metric query is only covering half of the step size. This results in missing data for the time between minutes two and four. Spikes that occur within that time range wouldn't appear in any data point. Notice how the range selector is explicitly set to 1m.
Now compare this with a query where the step size and range are aligned. This query explicitly sets the range to 2m, and all the underlying data is covered by the query evaluation.
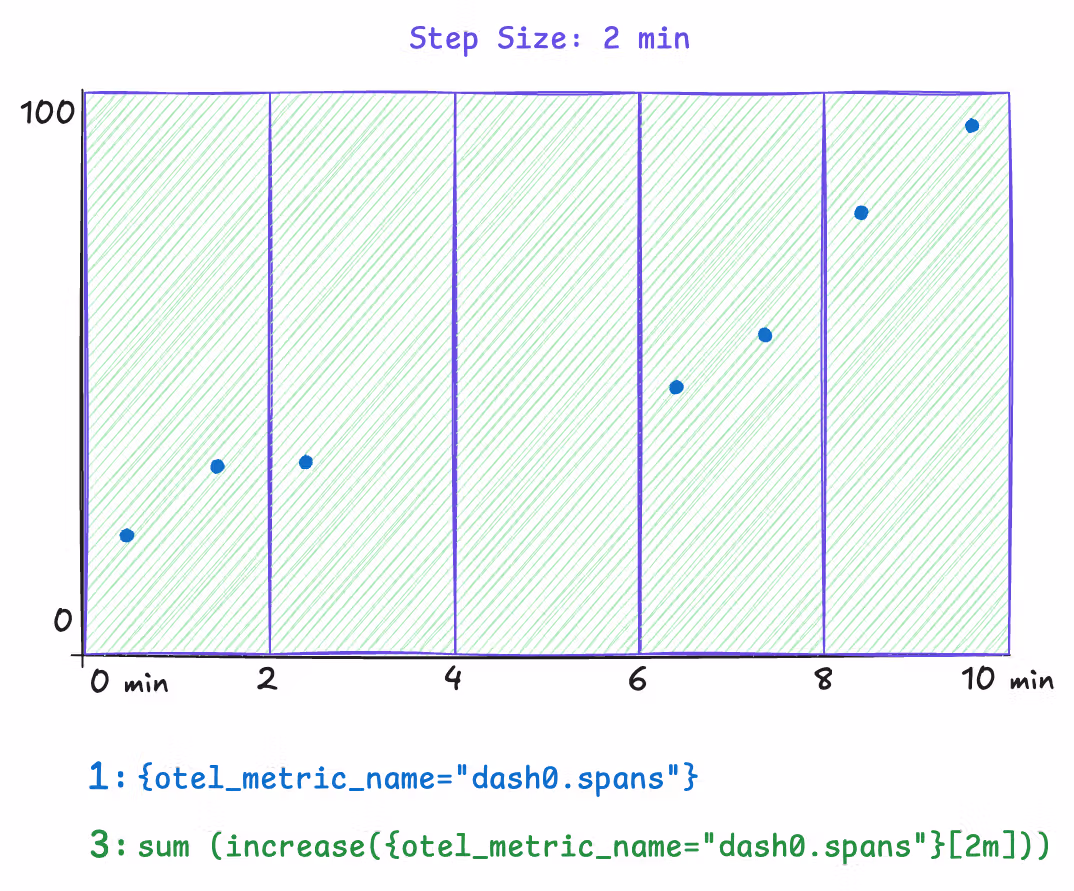
However, a downside to this approach is that the step size is dynamic. The step size is dynamically chosen when Dash0 is rendered based on the selected time range and available space for charts. To solve this, use the $__interval and $__rate_interval variables instead of an explicit 2m in the range selector. Both variables remain aligned as closely as possible to the current step size.
Note: Time series chart tooltips communicate the actual step size through the presented timestamps. Within dashboarding, you can even configure a minimum step size.
The Fix
| Query type | Correct variable |
|---|---|
rate() and increase() | $__rate_interval |
avg_over_time() and other aggregations | $__interval |
12345# Correct — adapts automatically to zoom levelrate(http_requests_total[$__rate_interval])# Risky — may return "No data" when zoomed inrate(http_requests_total[30s])
Impact on Alerting
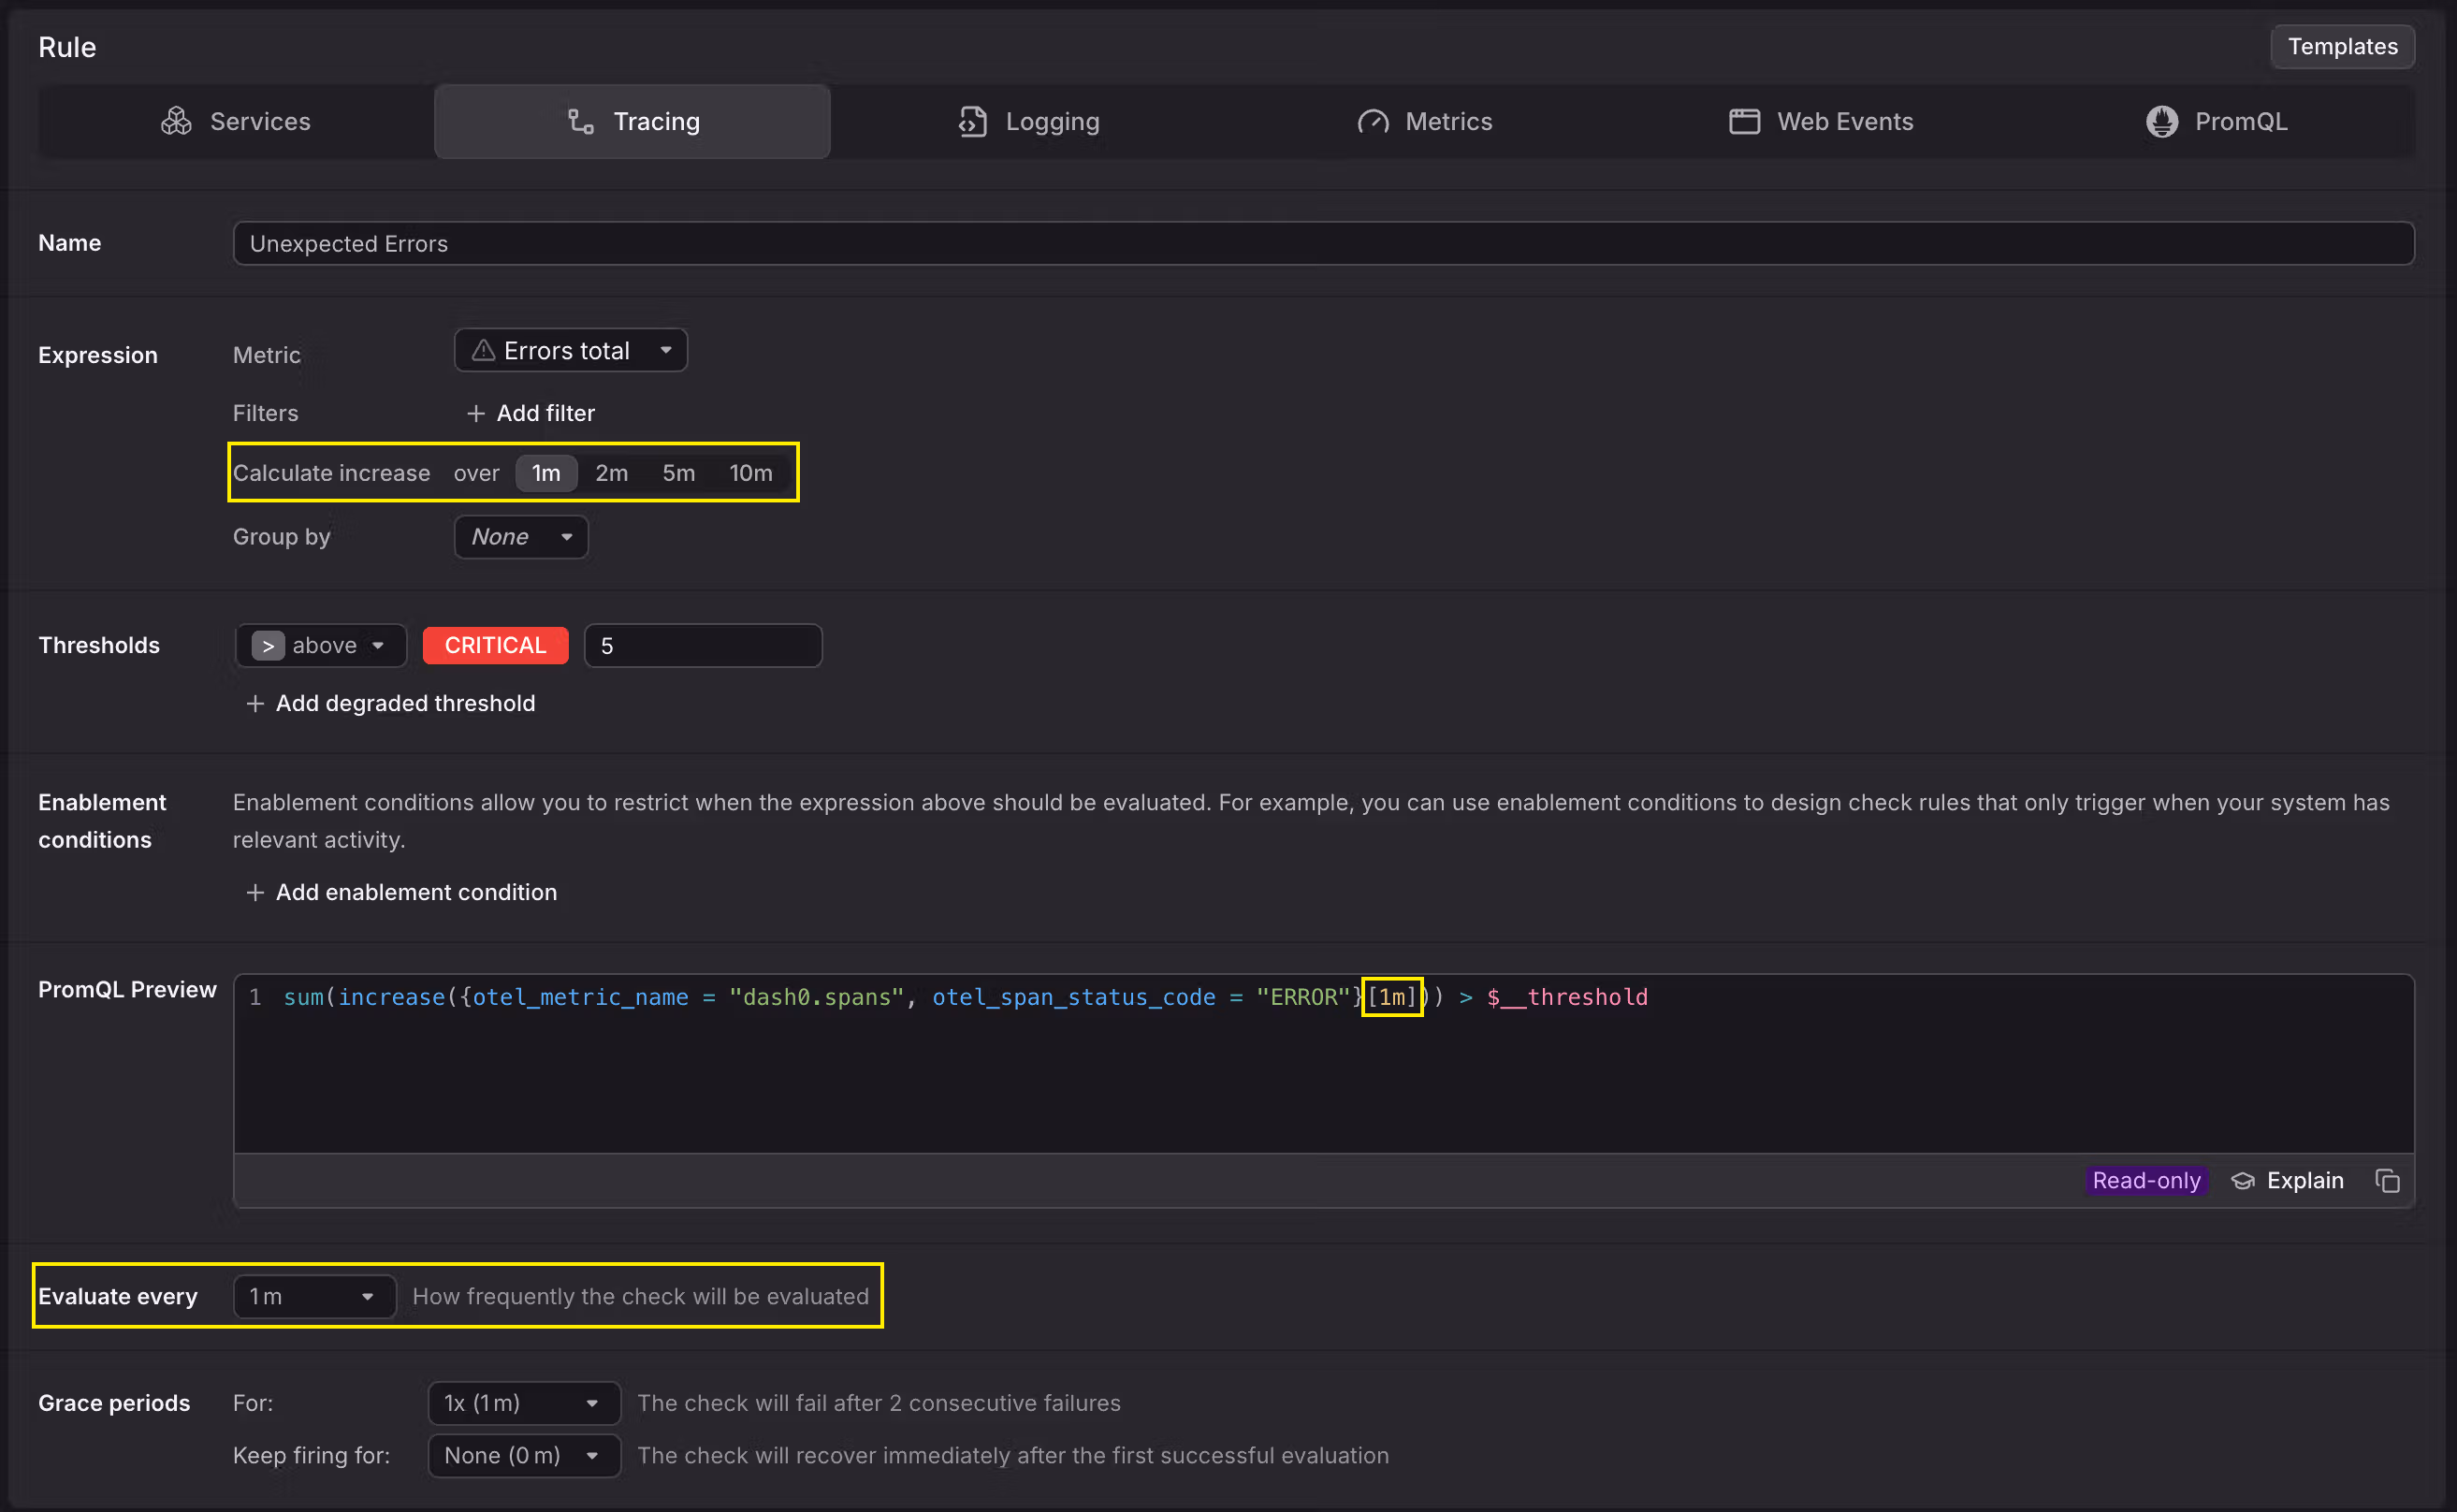
This issue is even more critical for alerts. If your check rule uses a range of 30s and is evaluated every 1m, you are always going to miss 30 seconds of data in your alert evaluation. Make sure the range is equal to or larger than the evaluation frequency.
Range Misaligned to Collection Intervals
Functions like rate() and increase() need at least two data points within the specified range to compute a result. If the range does not cover enough data points, the query returns empty results and charts stay blank. Other range-vector functions such as irate() or delta() can be affected in the same way.
The Problem
This issue shows up in two common scenarios.
Slightly misaligned ranges. A metric is collected every 60 seconds, but the query uses a [1m] range. Due to timing jitter between collection and evaluation, the 1-minute window often contains only a single data point. With nothing to compare it against, rate() and increase() return no result.
Very sparse collection intervals. Some metrics are only collected infrequently, for example once every hour. In these cases, most practical range values are far too short to ever contain two data points. Using rate() or increase() on such metrics produces empty results almost all of the time.
Concrete Example
Consider a counter metric collected every 60 seconds. A query like the following uses increase() with a one-minute range:
1increase({otel_metric_name="my.counter", otel_metric_type="sum"}[1m])
Because the range barely matches the collection interval, most evaluation windows contain at most one data point. The chart appears empty even though data is being collected.
To verify that data points exist, remove the increase() or rate() function and plot the raw time series instead:
1{otel_metric_name="my.counter", otel_metric_type="sum"}
This shows the individual data points on the chart and helps you determine the actual collection interval of the metric.
The Fix
The range must be large enough to always contain at least two data points. As a rule of thumb, use a range of at least two times the collection interval. For a metric collected every 60 seconds, a [2m] range ensures that two data points are always covered:
1increase({otel_metric_name="my.counter", otel_metric_type="sum"}[2m])
For charts in Dash0, you can combine the $__rate_interval variable with an increased minimum step size. Because $__rate_interval is set to one minute in Dash0, it is not sufficient on its own when the collection interval is 60 seconds or longer. Setting the minimum step size to two minutes in the chart configuration ensures that $__rate_interval adapts accordingly:
1increase({otel_metric_name="my.counter", otel_metric_type="sum"}[$__rate_interval])
For metrics with very sparse collection intervals, such as once per hour, set the range and minimum step size to match. For example, use a [2h] range for an hourly metric to reliably capture at least two data points.
OTel and Prometheus Metric Name Differences
Dash0 stores metrics using the OpenTelemetry data model but also exposes them through a Prometheus-compatible query API. The two ecosystems use different naming conventions, and queries that work in one style may return no data in the other.
The Problem
When migrating dashboards from Grafana or writing PromQL queries against metrics originally defined with OpenTelemetry names, the metric name you expect may not match the name Dash0 exposes.
There are two common causes.
-
Dot-to-underscore normalization: Prometheus does not allow dots in metric names. An OTel metric named
http.server.request.durationbecomeshttp_server_request_durationin Prometheus naming. If the metric has a unit, a unit suffix is appended as well, producinghttp_server_request_duration_seconds. -
Histogram series: Building onto the previous metric, if this is a histogram, then Prometheus exposes several distinct metrics; multiple
_buckettime-series with alelabel per histogram bucket,_countand_sumfor count and sum totals. And thus ifhttp.server.request.durationis a histogram the following metrics will be exposed:http_server_request_duration_seconds_bucket,http_server_request_duration_seconds_countandhttp_server_request_duration_seconds_sum. -
Missing
_totalsuffix on counters: Monotonic Sum metrics (counters) are exposed with a_totalsuffix in Prometheus convention. A metric namedmy_countermust be queried asmy_counter_total.
Concrete Example
An application exports a counter metric called http.client.request.count via OpenTelemetry. Querying it by its OTel name in standard PromQL returns no results:
12# Returns no data — dots are not valid in Prometheus metric nameshttp.client.request.count
The Prometheus-compatible name applies both transformations: dots become underscores, and the _total suffix is added:
12# Correct Prometheus-style namehttp_client_request_count_total
The Fix
You can query metrics in two ways.
-
Prometheus-compatible name: Apply the naming rules manually. Replace dots with underscores, add the unit suffix if present, and append
_totalfor counters.promql1rate(http_client_request_count_total[$__rate_interval]) -
OTel metric name label: Use the
otel_metric_namelabel to query by the original OpenTelemetry name. This avoids the need to remember the normalization rules.promql1rate({otel_metric_name="http.client.request.count", otel_metric_type="sum"}[$__rate_interval])
Use the Metrics Explorer to look up the exact name and type of any metric in your organization. This removes the guesswork when constructing queries.
Missing Histogram or Summary Sub-Series
Histogram and Summary metrics expose multiple sub-series such as _bucket, _sum, and _count. When these sub-series are missing, percentile calculations and throughput queries return no data.
The Problem
When migrating dashboards, you may find that queries referencing metric_name_count or metric_name_sum return empty results even though data is being ingested. This typically happens because the underlying metric is not actually a Histogram or Summary.
OTel Histograms and Summaries expose _bucket, _sum, and _count sub-series automatically. However, if the instrumentation or exporter sends the metric as a Gauge or Sum instead of a Histogram, none of these sub-series exist. The metric appears in the Metrics Explorer, but only as a single time series without any suffixed variants.
Concrete Example
A service is expected to export http_request_duration_seconds as a Histogram. A dashboard queries the observation count:
1rate(http_request_duration_seconds_count[$__rate_interval])
The query returns no data. Checking the Metrics Explorer reveals that the metric is ingested as a Sum rather than a Histogram, so no _count sub-series exists.
The Fix
- Open the Metrics Explorer in Dash0 and locate the metric. Check whether its type is Gauge, Sum, Histogram, or Summary.
- If the metric is a Histogram,
_bucket,_sum, and_countshould all be available. Verify the Prometheus-compatible name follows the expected naming convention (see the section above). And specifically for the_bucketname, verify multiple series with differentlelabels are returned. - If the metric appears as a Sum or Gauge but should be a Histogram, the issue is in the instrumentation or exporter configuration. Review the SDK or exporter settings to ensure the metric is emitted with the correct type.
Some frameworks and exporters emit the same logical metric with different types depending on the exporter version. For example, certain Ktor metrics may appear as Summaries in one exporter but as Histograms in another. Always verify the actual metric type in Dash0 before building dashboards or alerts.
Querying Non-Default Datasets
If your organization uses multiple datasets, queries that work against the default dataset may return no data when targeting a different one.
The Problem
The Prometheus-compatible query API targets the default dataset unless you specify otherwise. When querying metrics that belong to another dataset, results come back empty. The dash0_dataset virtual label is available for group by clauses in PromQL but cannot be used as a filter matcher to select a dataset.
Concrete Example
A query returns data in the default dataset but produces no results for a dataset called staging:
12345# Works in the default datasetrate(http_server_request_duration_seconds_count[$__rate_interval])# Returns no data — dash0_dataset cannot be used as a filterrate(http_server_request_duration_seconds_count{dash0_dataset="staging"}[$__rate_interval])
The Fix
Pass the dataset as a query parameter on the Prometheus API endpoint instead of using a label matcher:
1/api/prometheus/api/v1/query?query=rate(http_server_request_duration_seconds_count[$__rate_interval])&dataset=staging
When using dash0_dataset in a group by clause, it works correctly for splitting results across datasets:
1sum by(dash0_dataset) (rate(http_server_request_duration_seconds_count[$__rate_interval]))
Queries Must Include a Metric Name
Every PromQL query in Dash0 must specify which metric to query. Omitting the metric name produces an error, even if other label matchers are present.
The Problem
In standard Prometheus, you can query by label matchers alone without naming a specific metric, for example {job="myapp"}. In Dash0, this query returns an error because the query engine requires exactly one metric name matcher (__name__ or otel_metric_name) in every query.
Concrete Example
12345# Error — no metric name specified{service_name="cartservice"}# Error — __name__ regex matcher is not specific enough{__name__=~".+", service_name="cartservice"}
The Fix
Always include a metric name in the query, either as the metric identifier or as an explicit __name__ or otel_metric_name matcher:
12345678# Using the metric name directlycontainer_memory_working_set_bytes{service_name="cartservice"}# Using an explicit __name__ matcher{__name__="container_memory_working_set_bytes", service_name="cartservice"}# Using the otel_metric_name label{otel_metric_name="container.memory.working_set", service_name="cartservice"}
Delta Temporality Histograms and Classic Bucket Queries
Histograms exported with delta temporality cannot be queried using the classic _bucket, _sum, and _count sub-series format.
The Problem
OpenTelemetry supports two temporality modes for metrics: cumulative and delta. Prometheus historically uses cumulative temporality, so the classic bucket representation (_bucket, _sum, _count) only works with cumulative histograms. When a histogram is exported with delta temporality, querying these suffixed sub-series returns an error or no data.
The Fix
There are two approaches depending on your level of control over the metric source.
-
Use native histogram functions: If the metric is available as a native histogram in Dash0, you can query it directly with functions like
histogram_quantile()without relying on the_bucketsuffix. Native histograms support delta temporality.promql1histogram_quantile(0.95, rate({otel_metric_name="my.histogram", otel_metric_type="histogram"}[$__rate_interval])) -
Switch to cumulative temporality at the source: If the exporter or SDK can be configured, switch from delta to cumulative temporality for histogram exports. This restores compatibility with the classic
_bucket/_sum/_countquery pattern.
Extrapolated Values
Prometheus by default extrapolates values for functions such as rate(), increase() or delta(). The reason is to
account for irregular scrape intervals, so that data should match reality better.
The Problem
Extrapolated values might slightly under- or over-represent actual increases, which mostly is not that much of
a problem. Where it is most noticeable, is for integer based counts using the increase() or delta() functions. Because
extrapolation does not round values, and thus you are likely to see 'float' values.
Concrete Example
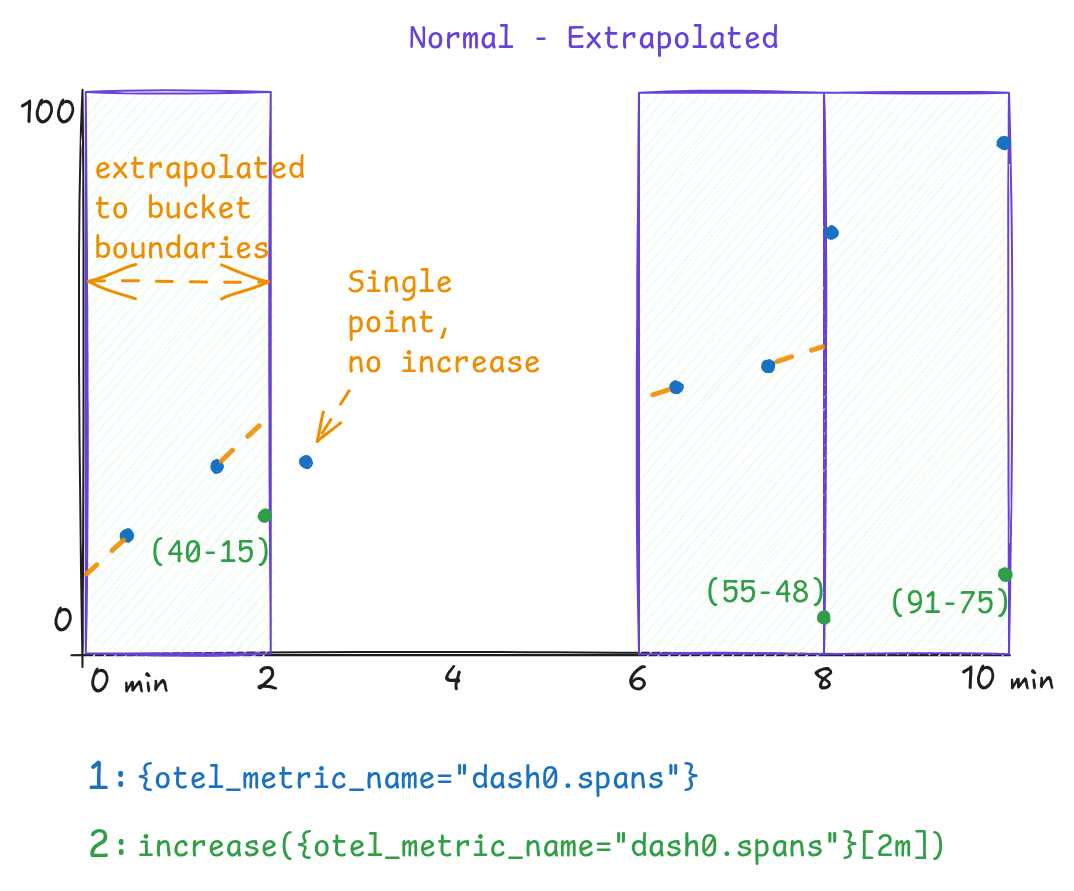
Consider a time-series dash0.spans which emits data-points at a 1 minute interval. Using a step-size of 2 minutes,
this will mostly capture two data-points within a step (bucket). But as timestamps are not exactly on the boundaries of
the bucket, Prometheus would extrapolate these values -as if they appeared exactly on the boundary-. While in this
example values shift to exact integer values, in most scenarios those would even be floats meaning you likely see
increase() results being 24.8, 7.2, etc.
The Fix
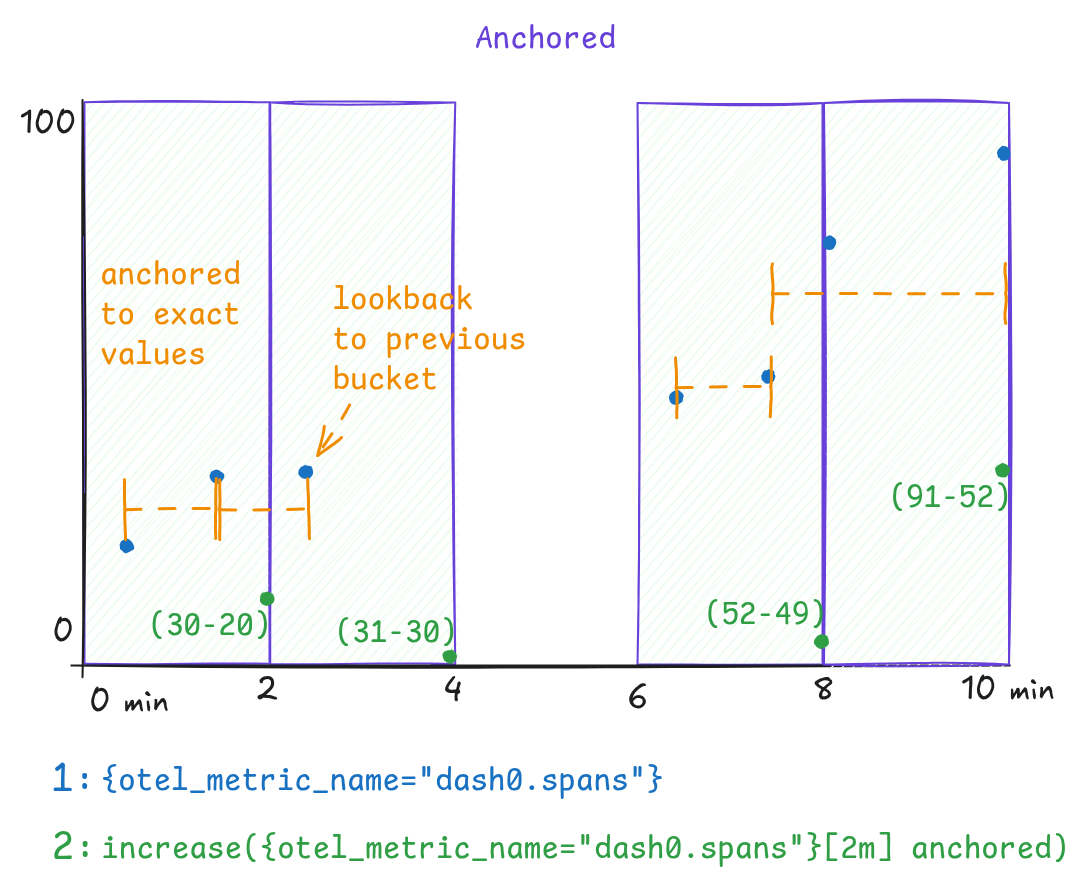
Recently Prometheus added support for the anchored keyword which does two things;
- prevent extrapolation of values
- initially look back to the last value in the previous bucket, otherwise take the first value of the existing bucket
The effect is seen in the below chart, where now increase() results would match the actual increase of the counter as
observed over time.
To make use of 'anchoring' for the data-points, an initial PromQL expression:
1increase({otel_metric_name="dash0.spans"}[2m])
needs to set the anchored keyword after the range selector and becomes:
1increase({otel_metric_name="dash0.spans"}[2m] anchored)