
Last updated:
Use the Service Details View
Open the Service Details sidebar from the Service Map to inspect resource attributes, failed checks, operations, and resources.
The Service Details View is a sidebar that lets you inspect a service without leaving the Service Map. It is distinct from the full-page Service View.
Open the sidebar
To inspect a service from the map:
- Open Monitoring → Services → Map.
- Click a service node to open its details sidebar.
- In Overview → Summary, click View service when you want to open the full Service View.
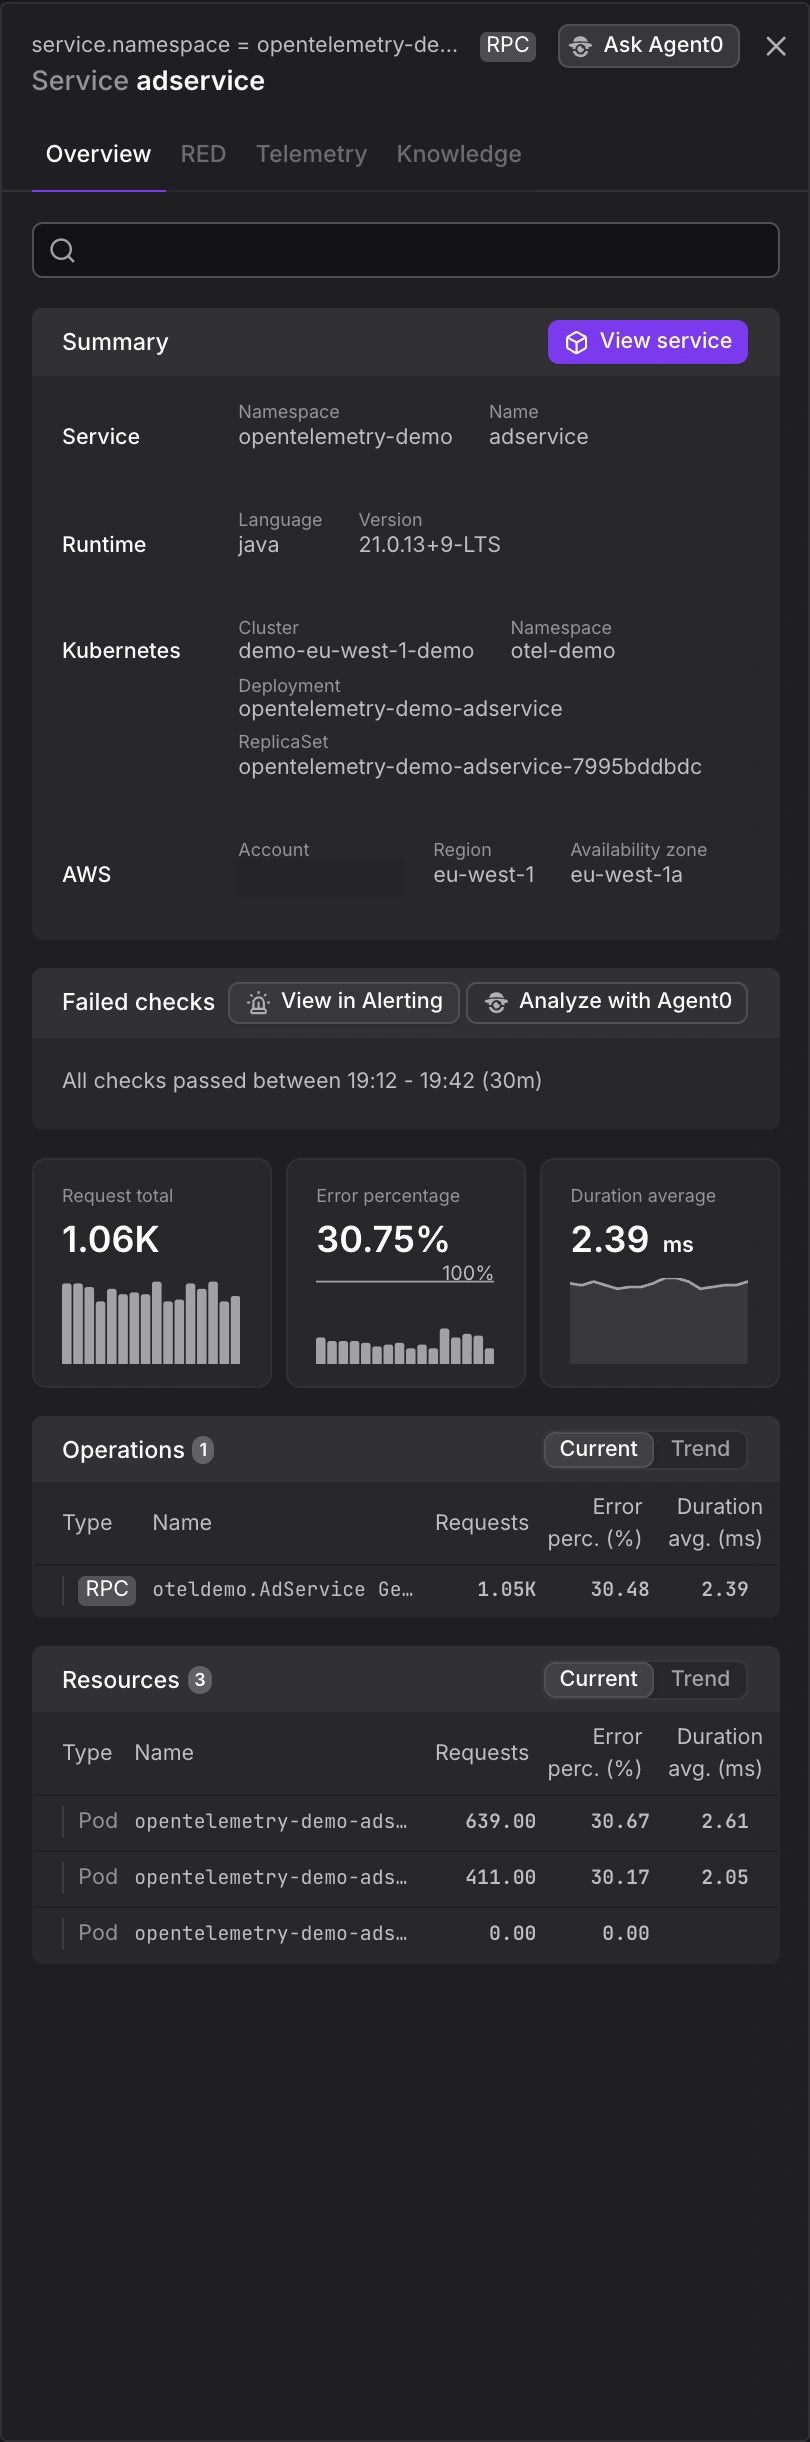
The sidebar's Overview shows resource attributes such as runtime language and version, Kubernetes cluster and deployment, and cloud region. The fields depend on the attributes reported for the service.
Health, operations, and resources
Use the rest of Overview to investigate the service:
- Failed checks: Review check status and use View in Alerting to investigate failures.
- Request total, Error percentage, and Duration average: Compare the service's performance over the selected time range.
- Operations: Compare request counts, error percentages, and average durations for individual operations.
- Resources: Compare the same metrics across resources associated with the service, such as Kubernetes pods.
Use the RED tab for performance charts and Telemetry for related spans, logs, and metrics.