Last updated: July 14, 2026
Use the Service Catalog
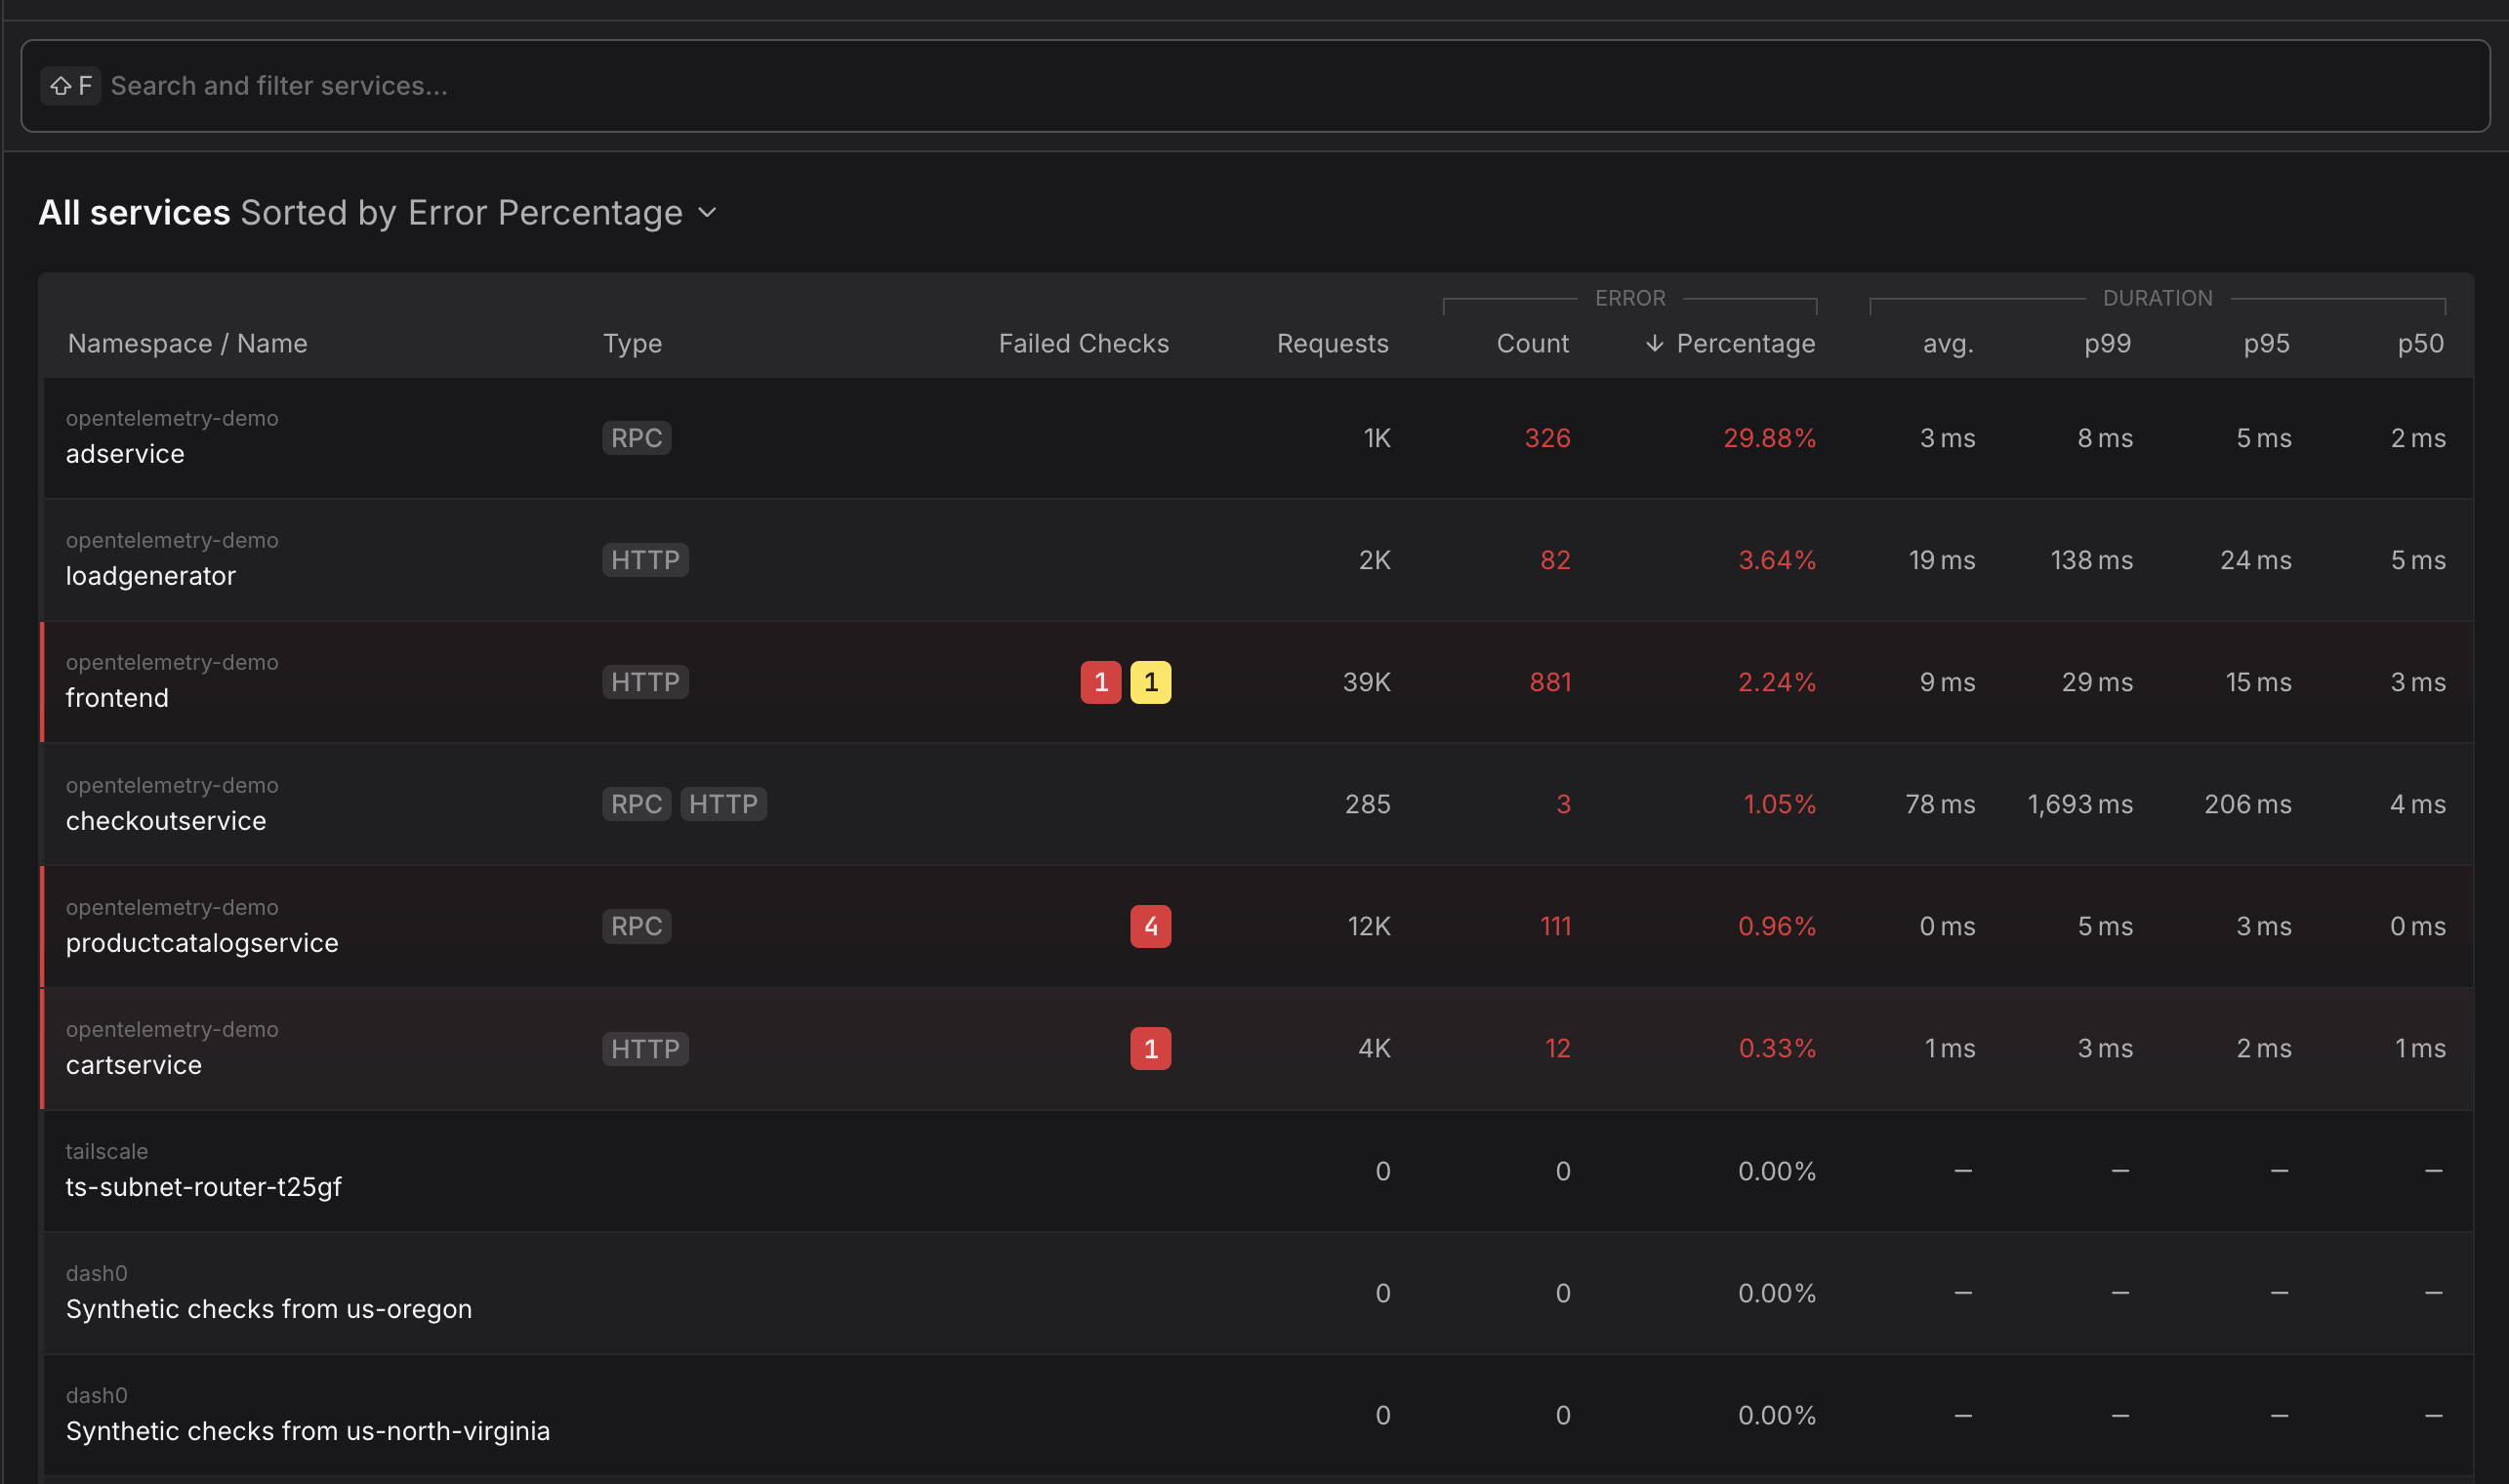
The catalog view displays each service with:
- Service name and namespace - Identification and logical grouping of services
- Request rate - Total requests over the selected time range
- Error percentage - Proportion of failed requests indicating service health
- Average, P50, P95, P99 duration - showing typical response times under different perspectives
- Visual health indicators - Quick status assessment through color-coded metrics
Search and Sorting
Search for your Service name or Namespace or sort services by request volume, error rate, or latency to quickly identify problematic services requiring attention.
Time Range Selection
Adjust the time window to analyze service behavior during specific incidents or compare performance across different periods. Metrics automatically recalculate for the selected timeframe.
Service Details
The Service Details page provides curated information about a specific service, bringing together operational metrics, infrastructure context, and dependency relationships in a single view.
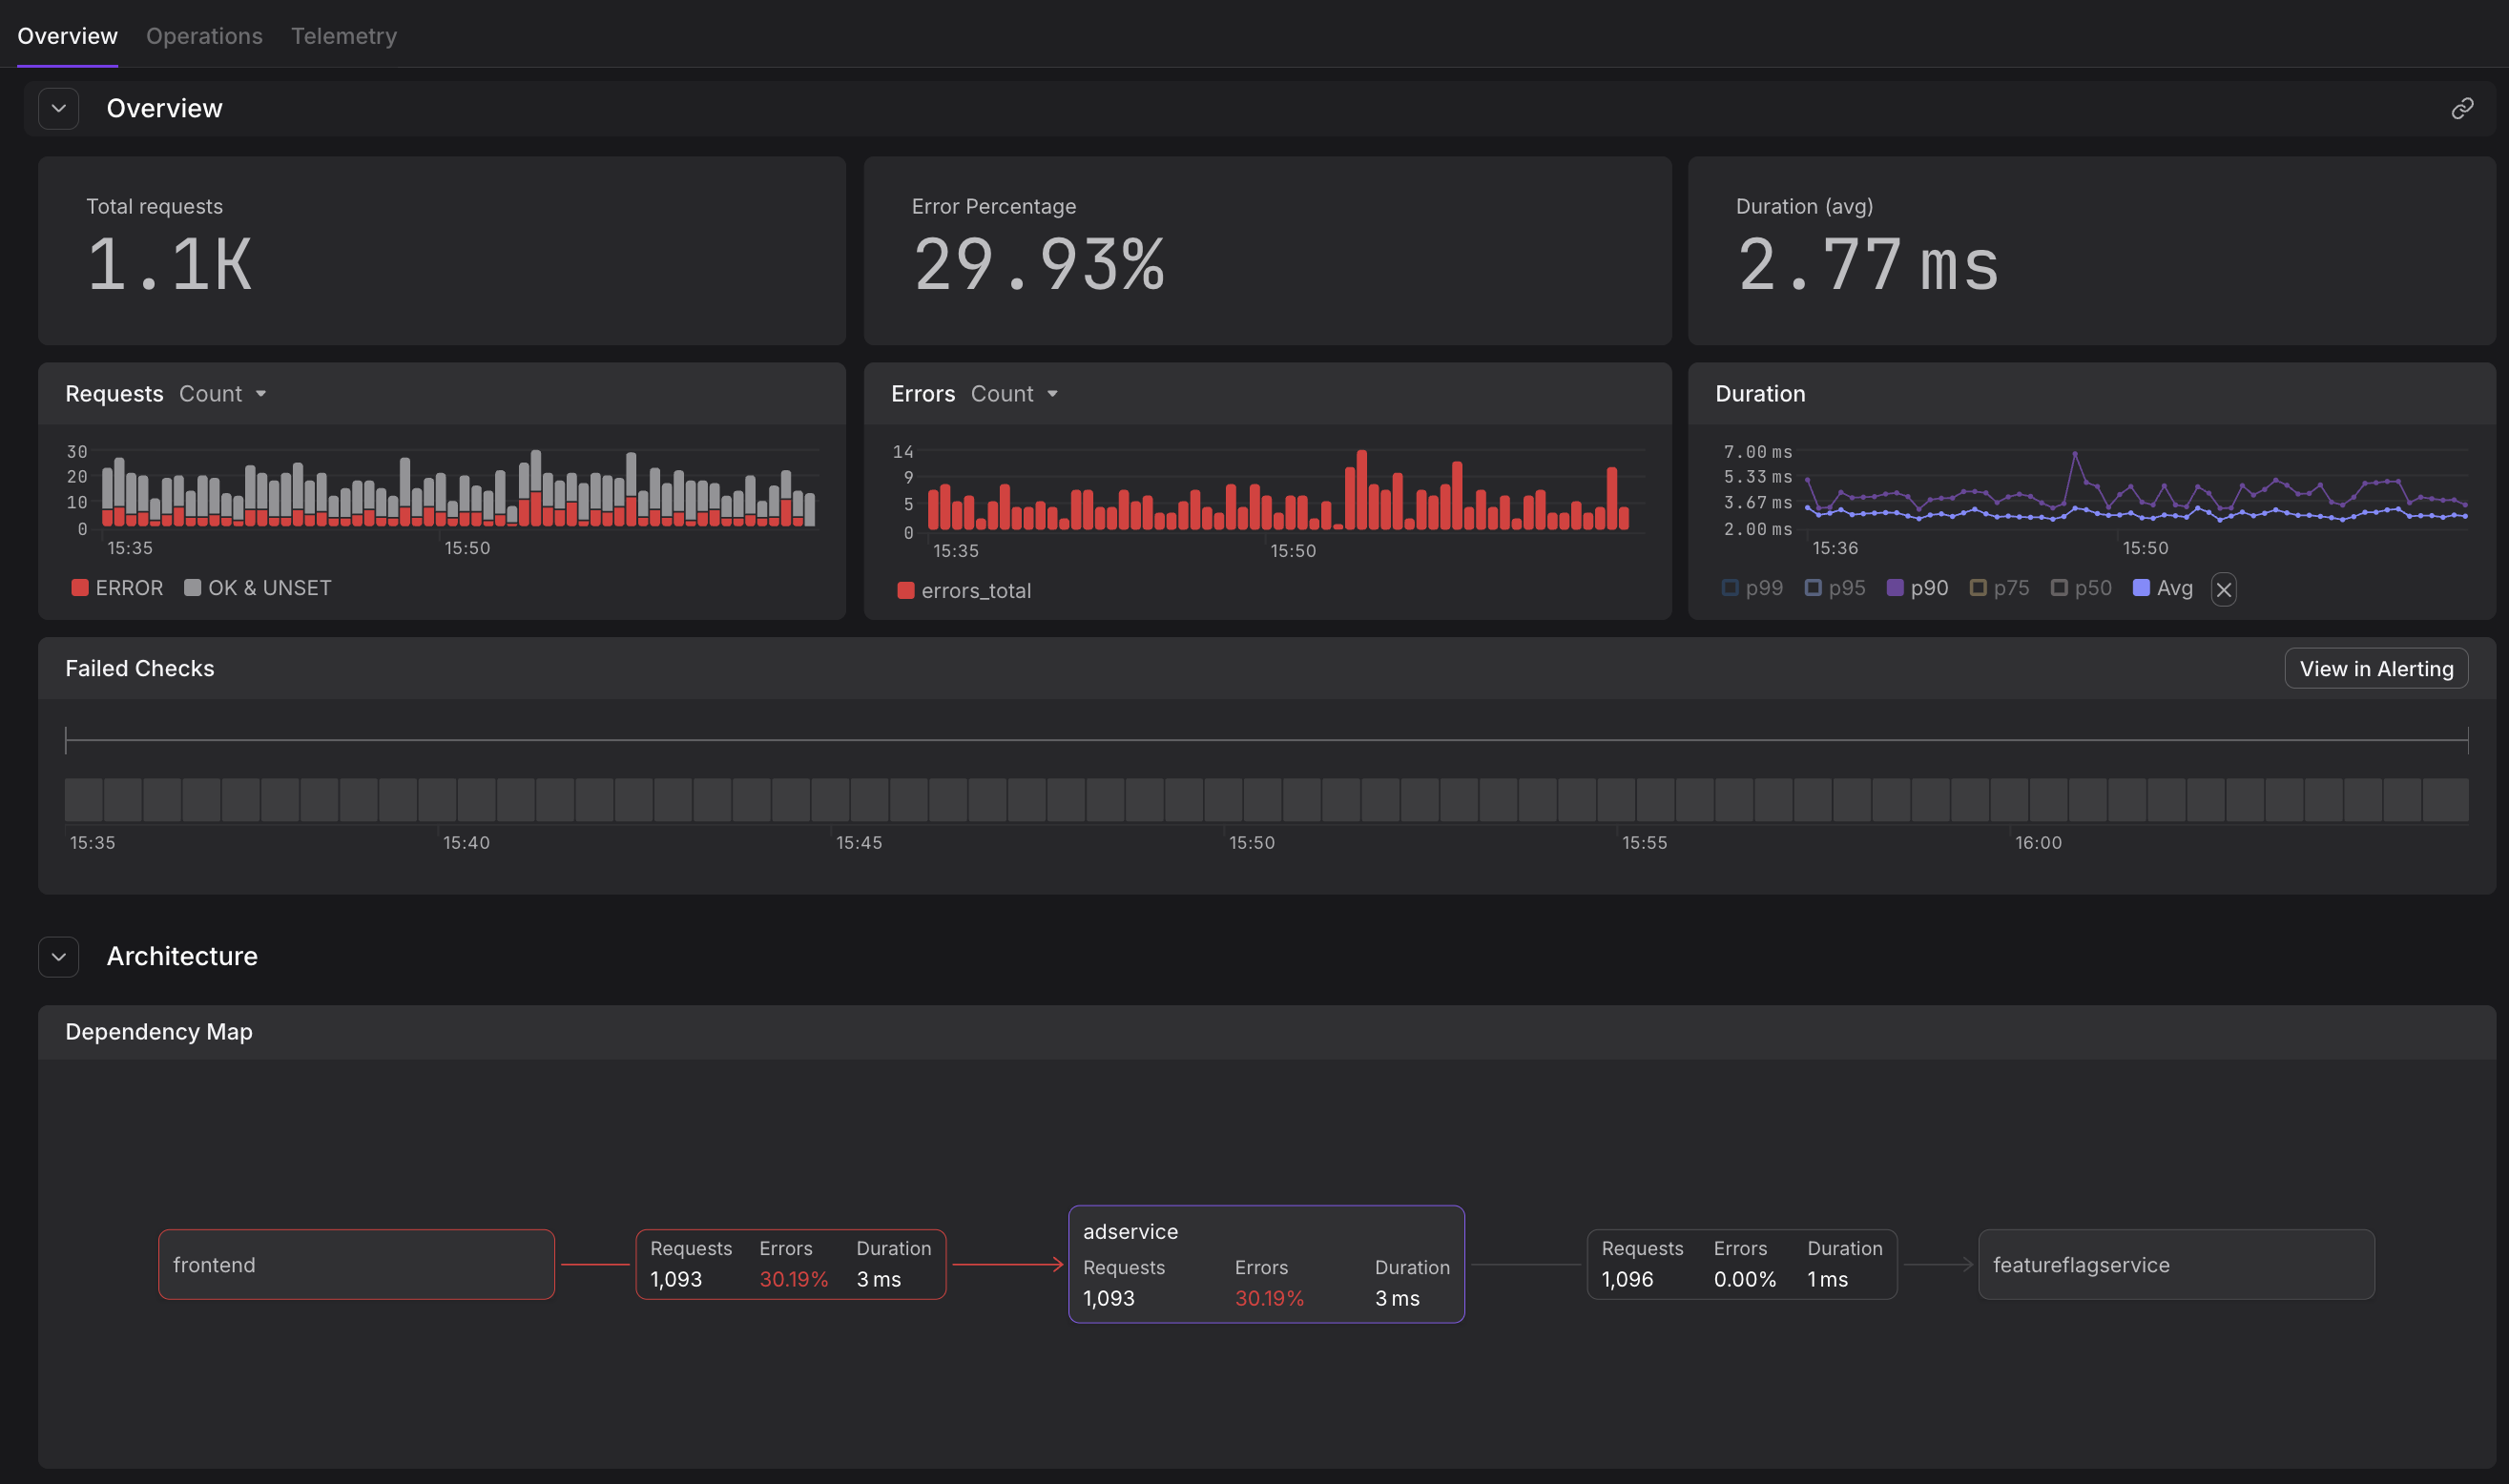
Overview Tab
The Overview section displays:
- RED metrics visualization - Time-series graphs showing request rate, error rate, and duration percentiles
- Service health status - Current operational state and recent status changes
- Key metadata - Service version, deployment information, and custom attributes
- Recent activity - Latest deployments, configuration changes, or incidents
Operations
Operations shows all endpoints and methods exposed by the service.
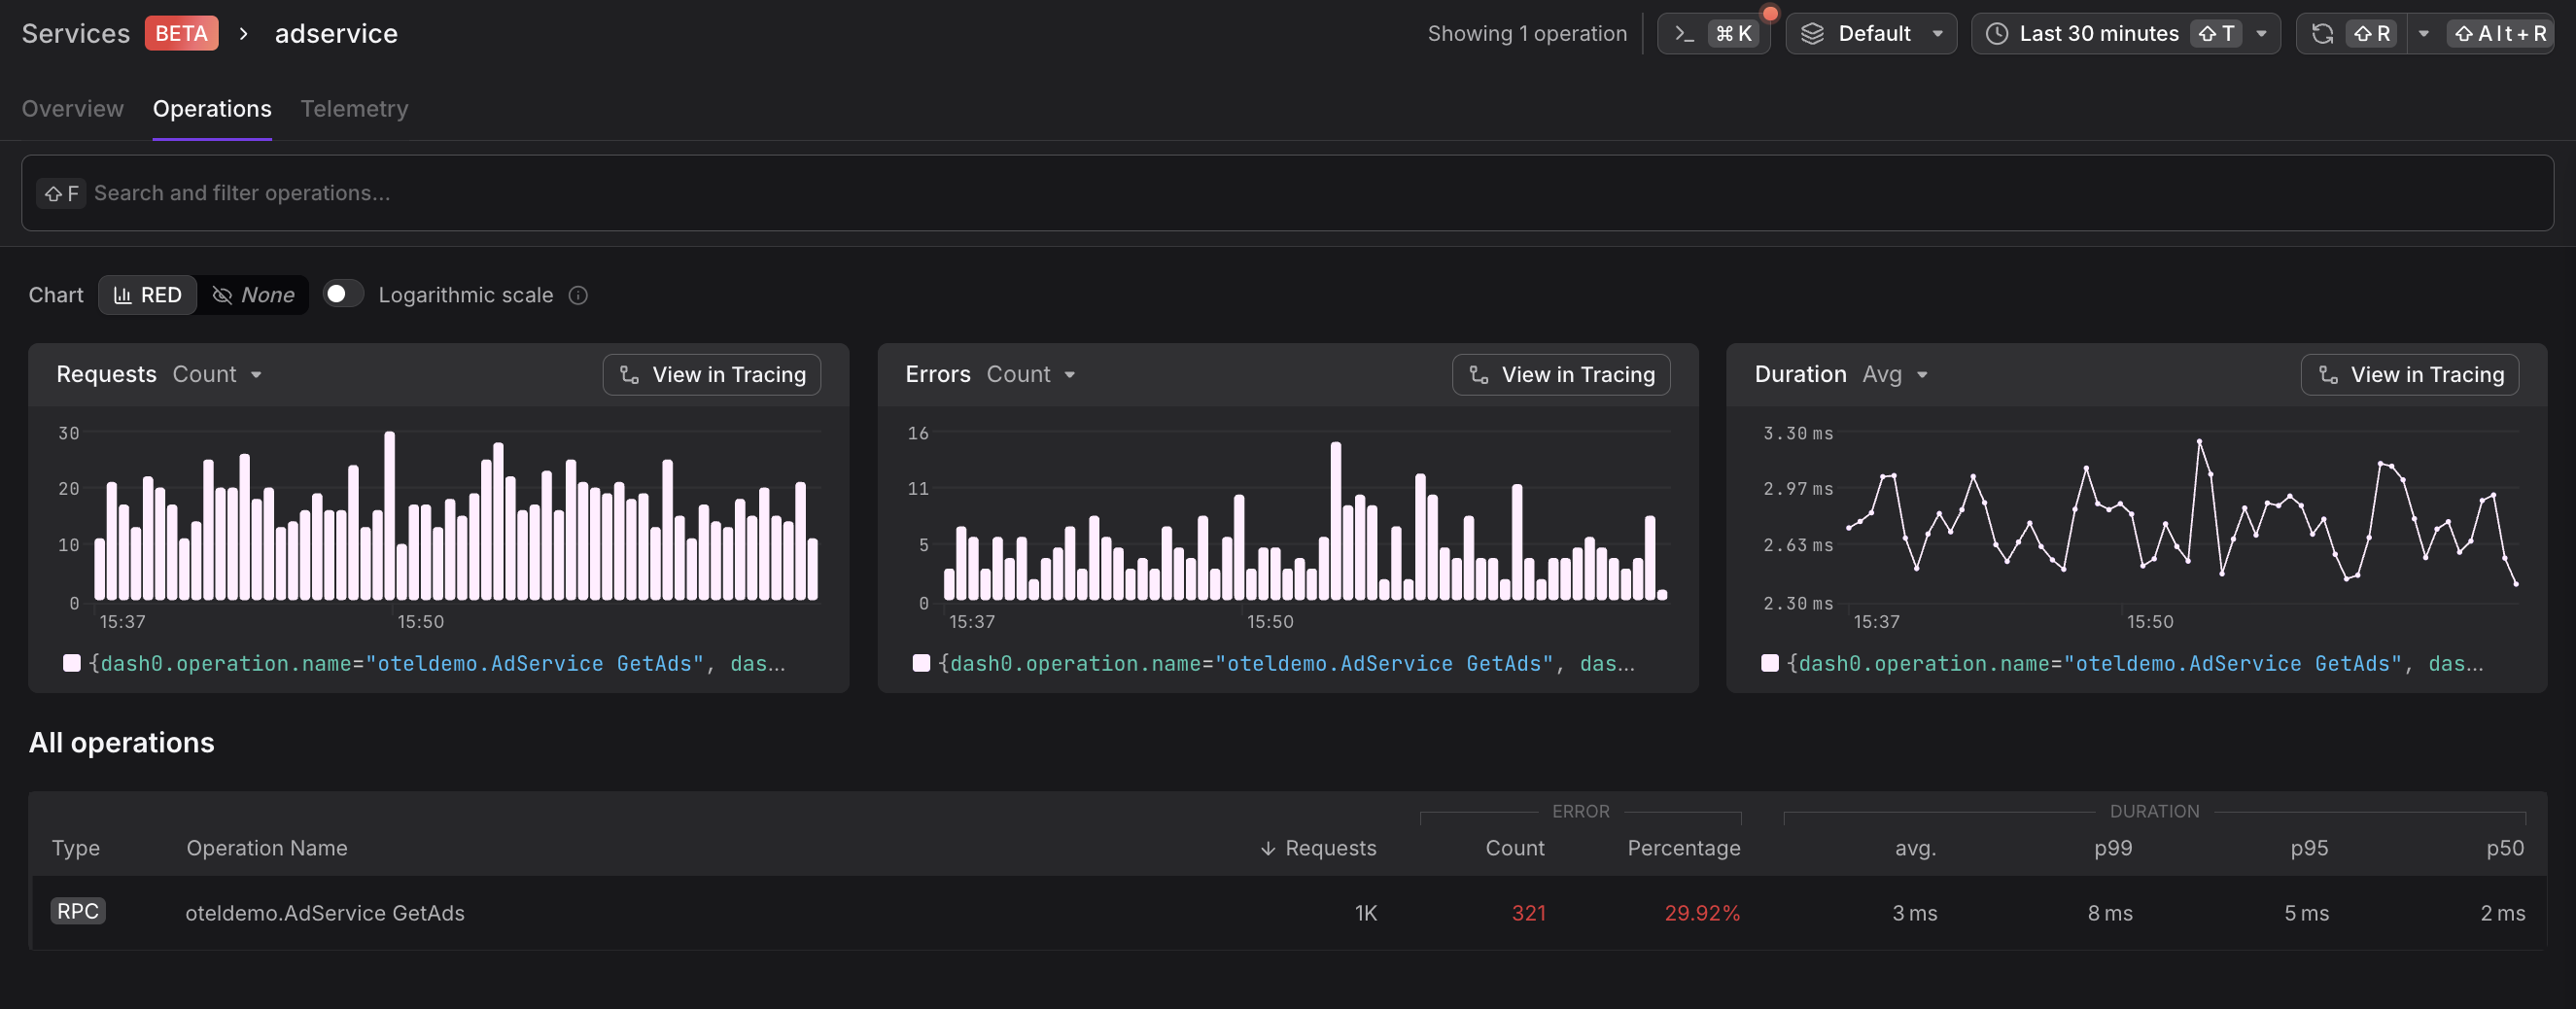
- Endpoint paths - HTTP routes, gRPC methods, or message queue consumers
- Operation-level metrics - Per-endpoint request rates, error rates, and latencies
- Performance trends - Identify slow or failing operations impacting overall service health
Sort operations by error rate to immediately identify problematic operations, or by request volume to focus on high-traffic paths.
Replicas and Infrastructure
View all running instances of the service:
- Replica status - Health and readiness of individual pods or containers
- Resource utilization - CPU, memory, and network usage per replica
- Infrastructure mapping - Kubernetes namespace, cluster, node assignments
- Version distribution - Track rollout progress during deployments
Dependencies
Understand how the service fits within your system architecture, navigate between upstream and downservices with a single click:
- Upstream dependencies - Services or resources that call this service
- Downstream dependencies - External services, databases, or APIs this service relies on
- Dependency health - Quick assessment of whether issues originate from dependencies
- Communication patterns - Request volume and error rates between services
Telemetry
The Telemetry tab makes it easy to find all related observability data for a particular service, bringing together logs, traces, metrics, and checks in a unified view:
- Logs - Filtered log records from this service within the selected timeframe, automatically scoped to the service context
- Traces - Distributed traces involving this service's operations, showing both inbound and outbound requests
- Metrics - Custom metrics emitted by the service, including business and application-specific measurements
- Checks - Active synthetic monitors or health checks configured for this service
Rather than navigating between different views and manually filtering by service name, the Telemetry tab provides immediate access to all relevant telemetry data, streamlining incident investigation and performance analysis.
Agent0 integrates directly into service views, allowing you to investigate issues with natural language queries that automatically use the current service as context. Ask questions like "why is latency high?" or "show recent errors" without manually filtering.
Best Practices
Service Identification
Ensure services are properly instrumented with OpenTelemetry semantic conventions including service.name and service.namespace attributes for accurate catalog grouping.
Monitoring Strategy
Combine Service Catalog metrics with targeted alerts to detect anomalies. Configure checks on critical services with appropriate thresholds for request rate, error percentage, and latency.
Dependency Analysis
Regularly review the Service Map to identify architectural improvements such as reducing cross-service calls, eliminating circular dependencies, or consolidating redundant services.