
Last updated: October 2, 2026
View and Analyze SLOs
Once an SLO is created, you can review it in the SLOs catalog and on a dedicated detail page.
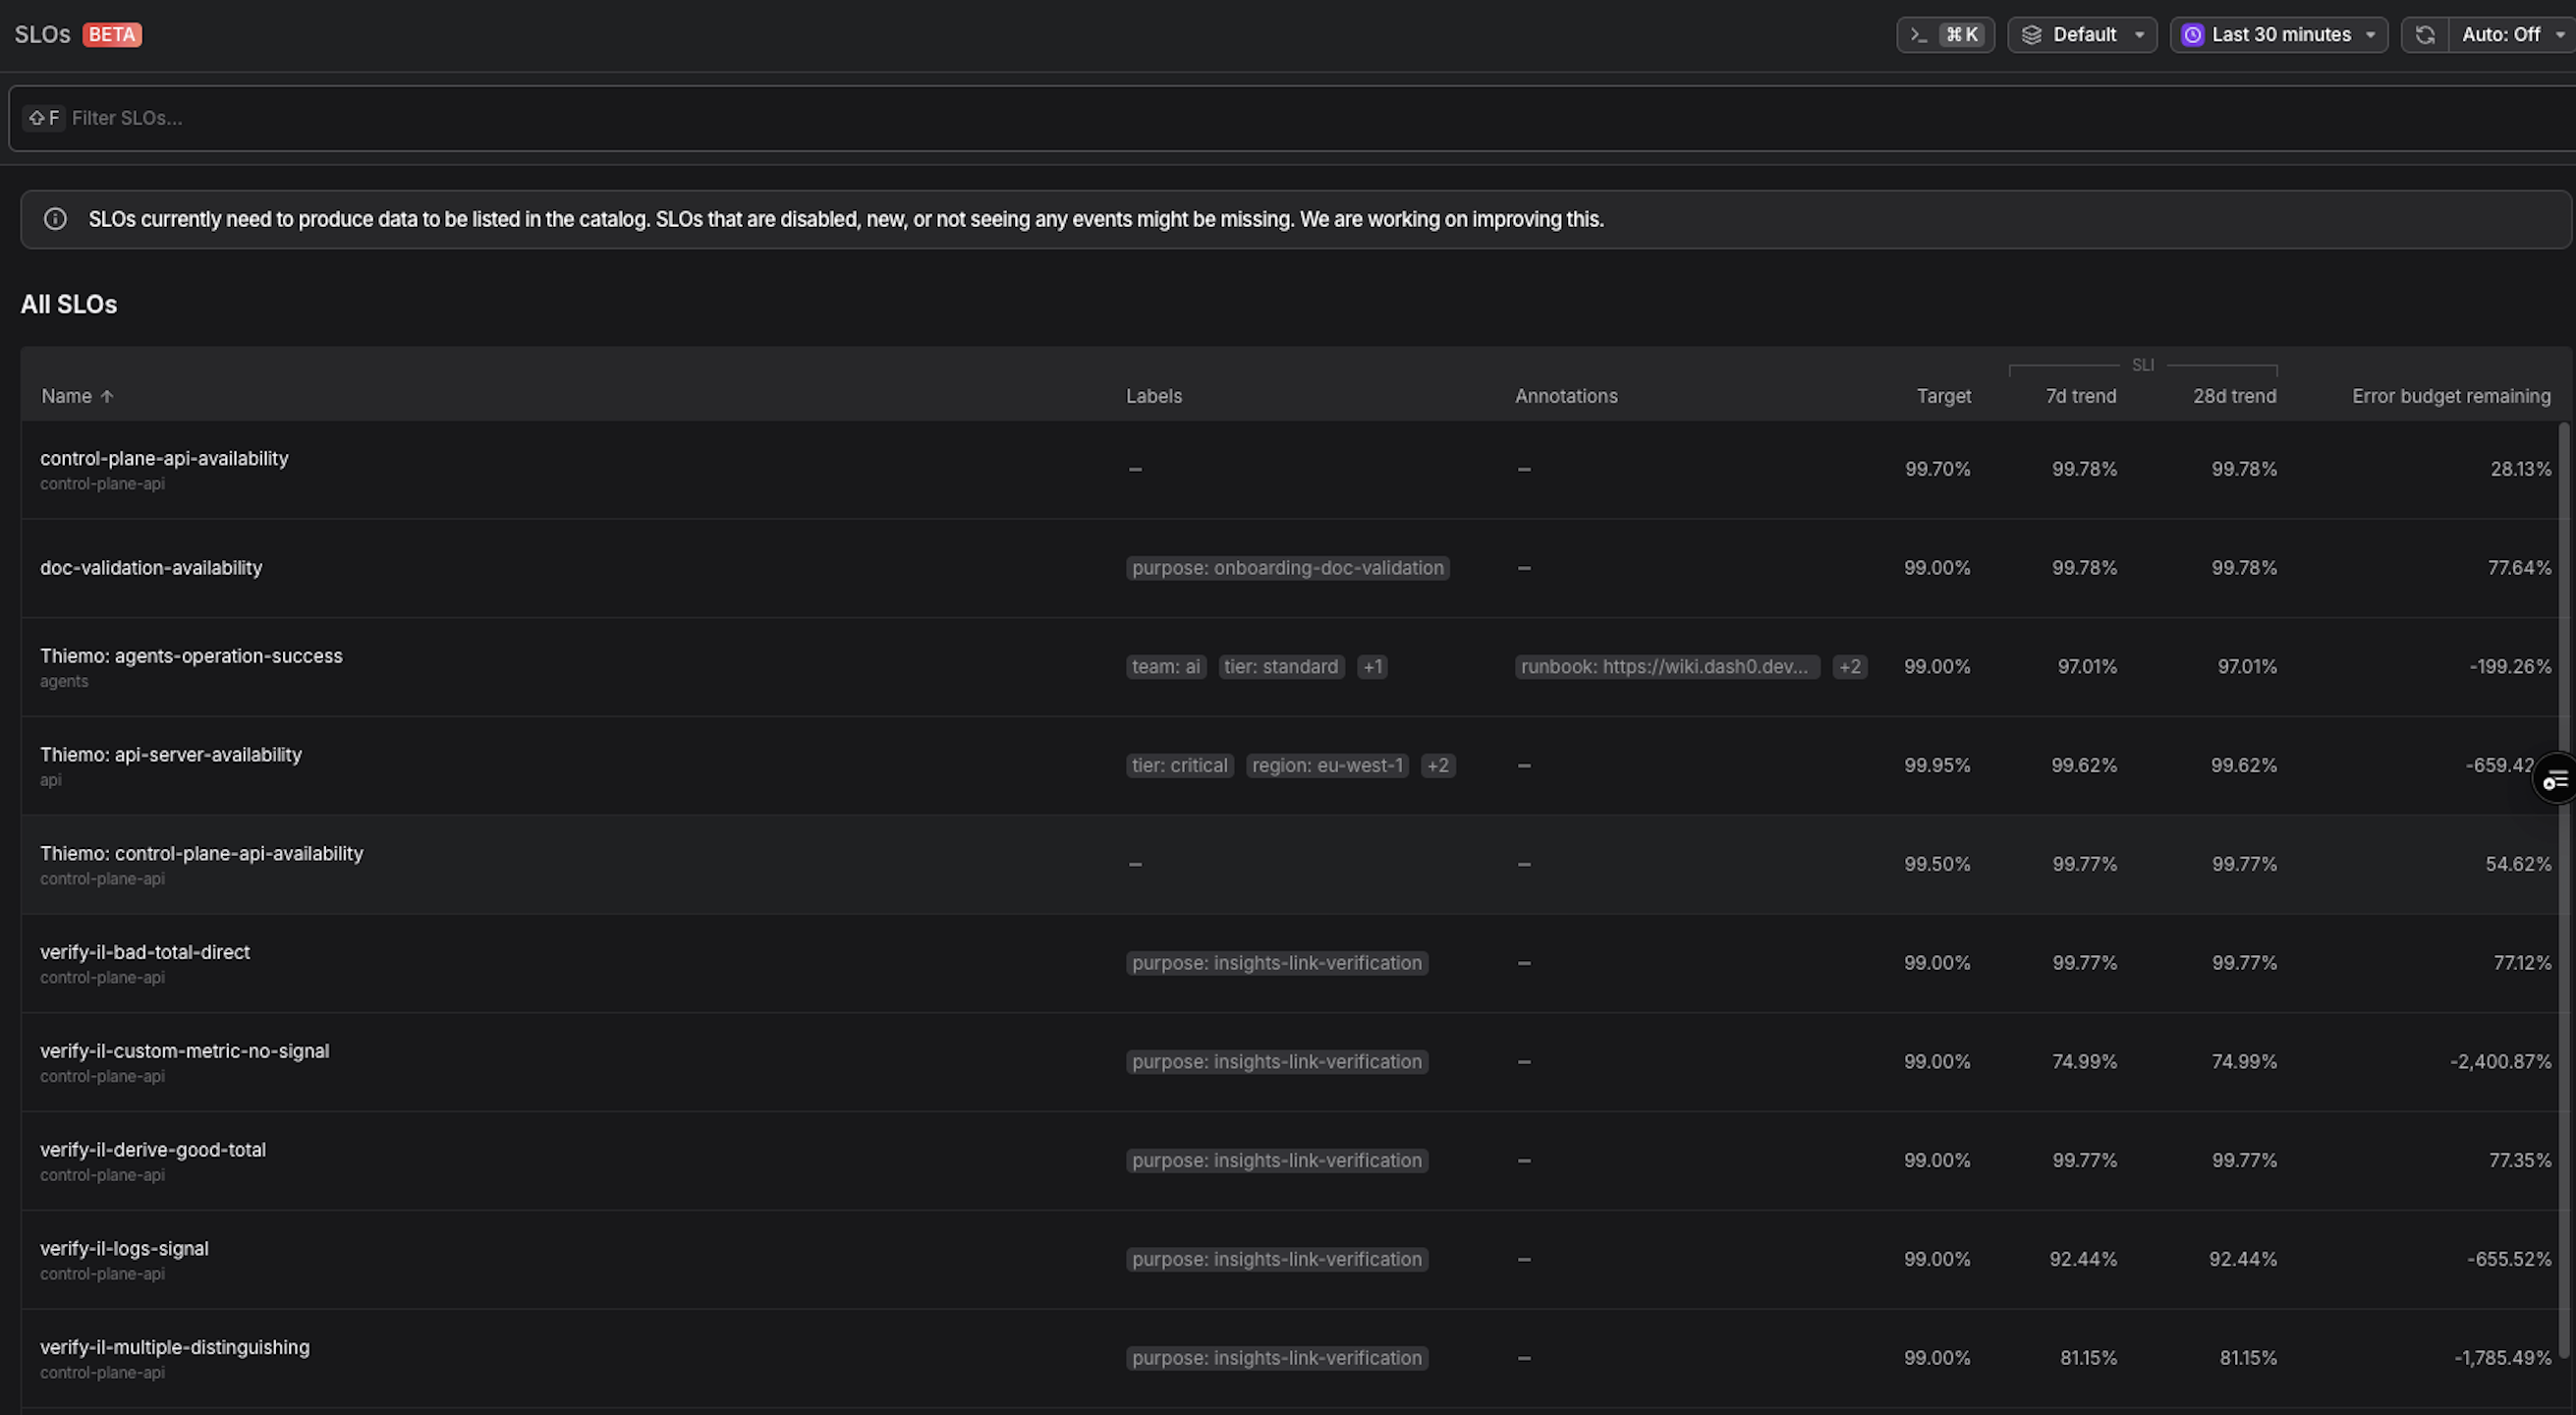
The SLOs catalog
Open Alerting › SLOs to see every SLO configured in your dataset. The catalog shows each SLO's name and service, status, labels, target, SLI trend for 7d and 28d, and error budget remaining. Use the Filter SLOs bar to filter on any label stamped on the SLO metrics; label pills open a quick filter.
Click a column header to sort by Name (the default), 7d trend, 28d trend, or Error budget remaining. Rows turn red when an SLO is BREACHED and yellow when it is AT RISK. A New badge marks SLOs created in the last hour and an Updated badge marks ones changed in the last hour. Disabled SLOs stay in the list with a Disabled badge. Save a filter as a view with the views button next to the title.
The catalog lists every SLO in the dataset, including new ones that have not recorded data yet (they show - in the metric columns and no status) and disabled ones. When a label filter is active, only SLOs that already have recording-rule data can match.
Grouping by service and sorting by status are not available yet. For detailed analysis, open an individual SLO.
The SLO detail page
Click any SLO to open its Overview. The detail page brings together everything you need to assess reliability at a glance:
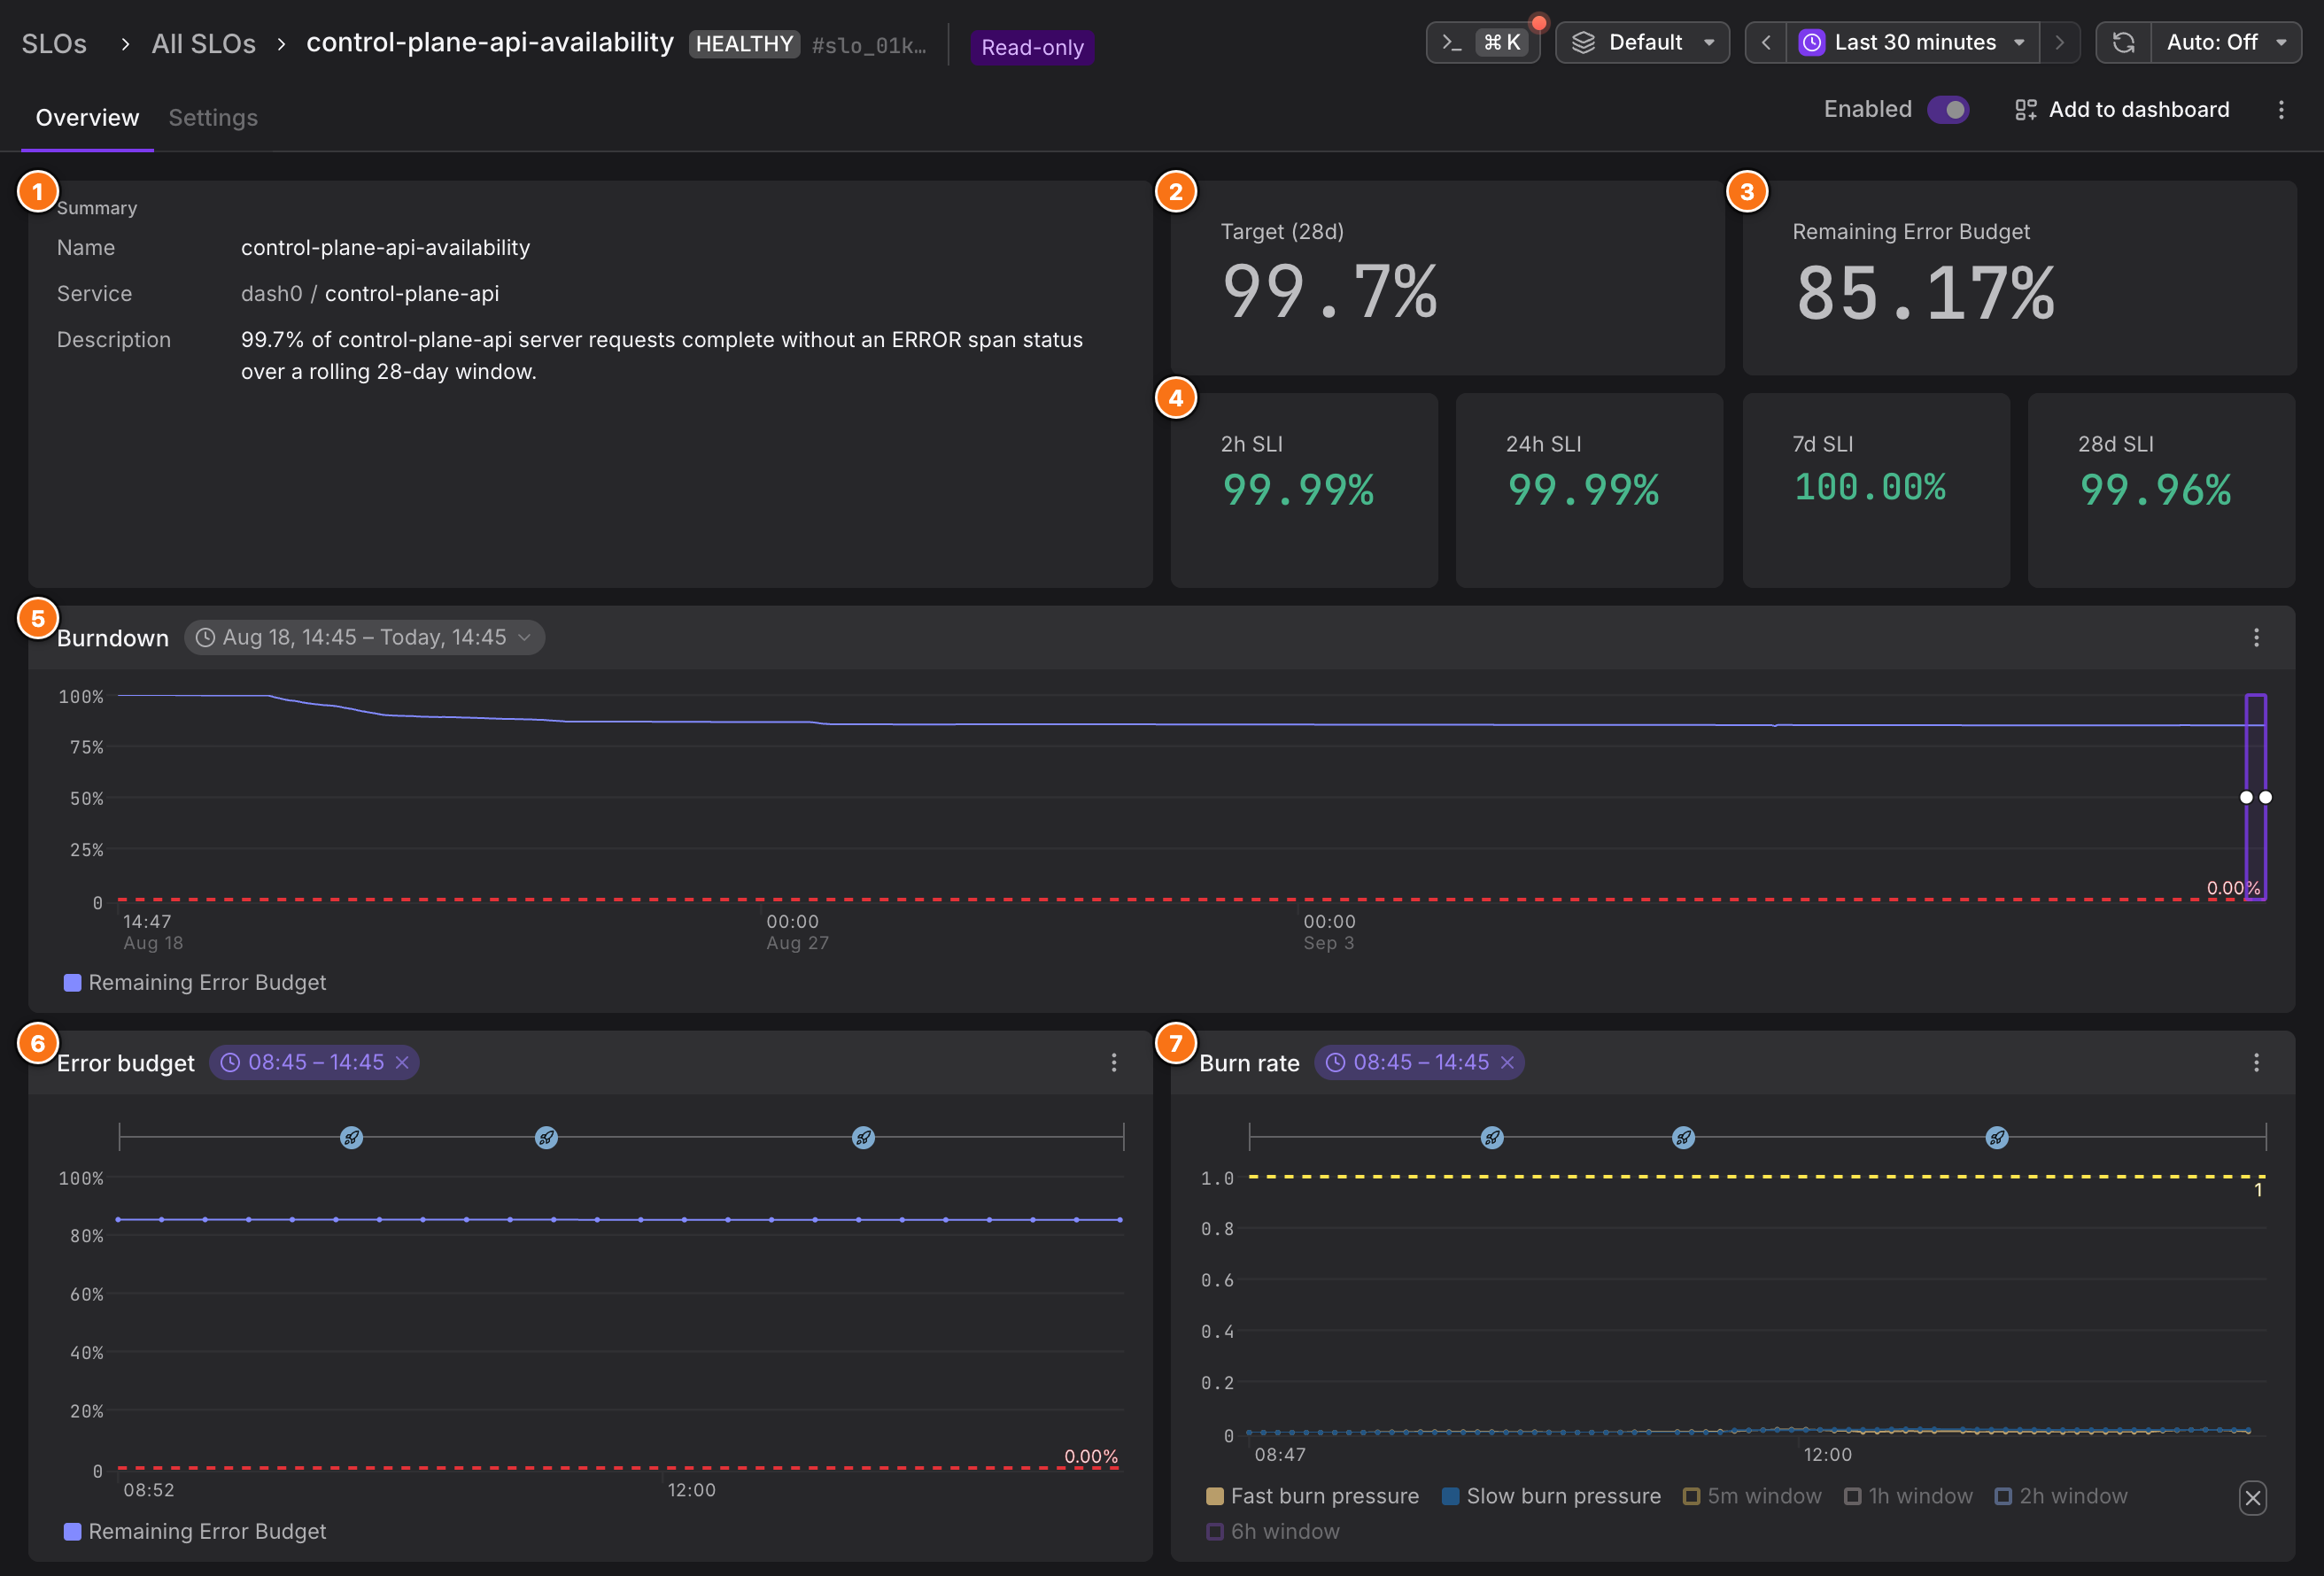
- Summary: the SLO name, the service it covers (linked to the service page), a plain-language description of its objective, and any labels. If the SLO has annotations, a View annotations button opens them in a sidebar.
- Target: the objective for the window; the tile shows the configured window in parentheses (
28d, or4wif the OpenSLO definition used that spelling). - Remaining Error Budget: how much budget is left. The catalog shows the same value in its Error budget remaining column.
- SLI tiles: 2h SLI, 24h SLI, 7d SLI, and 28d SLI show the success ratio over each trailing window, red while below the target and green once it meets it.
- Burndown: error budget over the full 28-day window. See The Burndown chart.
- Error budget chart: the remaining budget fraction over time, with a breach line at
0. - Burn rate chart: how fast the budget is being consumed. By default it plots Fast burn pressure and Slow burn pressure against a line at
1; the individual 5m, 1h, 2h, and 6h window burn rates are in the legend and hidden until you switch them on. See Burn rate for what each signal means.
The Error budget and Burn rate charts also carry deployment annotations: markers showing when the SLO's service was deployed, so you can line up a shift in burn rate with the release behind it. The markers come from deployment events; see Deployment annotations below.
The Burndown chart and Error budget remaining answer different questions. Burndown plots how the budget is consumed across the window over time, so you can see the shape and timing of the spend, and it drops below the axis once the SLO goes over budget. Error budget remaining is the single current figure: the fraction of budget still left right now (1.0 untouched, 0.0 exhausted, negative when over budget).
SLOs evaluate with a fixed 5-minute settling delay: at any moment, the SLI reflects telemetry that arrived at least 5 minutes ago. This ensures late-arriving signals are included in the SLI computation, at the cost of a small, fixed lag between live behavior and SLO state. The SLI itself is recorded every 30 seconds, the short-window burn rates every 5 minutes, and the remaining budget plus the 7d and 28d SLI every 15 minutes, so those tiles and the catalog trend columns update on a 15-minute cadence.
Recording starts when an SLO is created; Dash0 does not backfill past telemetry. A new SLO shows no data until fresh matching events arrive, and its charts fill in from creation time forward. Services that emit sparsely or in short bursts take longer to show a continuous line. This is expected, not an error.
Until the SLO is 28 days old, the remaining budget and the burndown are pro-rated by the share of the window that has elapsed since creation, so they project the traffic observed so far across the full window and firm up as the window fills. The Burndown title shows a % of window badge while this applies.
The Burndown chart
The Burndown always covers the full 28-day window, whatever the global time range, and its end follows the selected range end. Drag across it to zoom the Error budget and Burn rate charts (and their deployment markers) into that sub-range; the last 6 hours are selected by default, and a time-range badge with Clear time range override returns to the full range. The Adjust time range control shifts the window back or forward by one day or one week. Markers show when the SLO was created and when its configuration changed, and the shaded area marks the time before the SLO existed, where no data can exist.
Actions
The header offers an Enabled toggle, Add to dashboard, and, for administrators, Create check rule, which prefills a check rule on the fast and slow burn signals with a threshold of 1 (see Alerting on SLOs). The overflow menu adds Download as YAML (the SLO as an OpenSLO document), View all events and View bad events in Traces, Logs, or Web Events, Clone, and Delete. Each chart's menu offers Ask Agent0, Create check rule, Add to dashboard, Open in query builder, and the same event links.
The event links are derived from the SLI queries and appear for SLIs built on spans, logs, or web events. SLOs built on metrics or services have no events explorer to link to. The bad-events link is unavailable for raw SLIs and for good/total pairs whose queries differ in more than one filter clause.
Deployment annotations
The Error budget and Burn rate charts mark when your services were deployed, so you can see whether a change in burn rate lines up with a release. Deployments close together in time group into one marker showing how many it covers.
Annotations come from the dash0.deployment event. Emit one from your release pipeline after each deployment finishes, and it appears on those two charts. See Deployment Events for the event's required attributes and an example payload.
Markers appear only when the SLO has a service set (the Service field on the Settings tab, or spec.service in the OpenSLO definition), and only for dash0.deployment events whose service.name and service.namespace match that service exactly. An SLO service without a namespace matches only events with no service.namespace. An SLO without a service shows no markers.
SLO status
Every SLO carries a status tag, shown next to its name on the detail page and in the catalog.
| Status | What it means |
|---|---|
| HEALTHY | Budget remains and neither burn signal has reached its threshold. |
| AT RISK · FAST BURN | Fast burn pressure has reached 1. The budget is draining fast enough to be worth looking at now. |
| AT RISK · SLOW BURN | Slow burn pressure has reached 1. The budget is draining steadily enough to run out before the window ends. |
| BREACHED | The error budget is exhausted. Compliance stays below target for the rest of the window. |
Status is derived from three values: error budget remaining, fast burn pressure, and slow burn pressure. They are checked in that order, so an SLO that has run out of budget reads BREACHED even while it is also burning fast, and fast burn takes precedence over slow burn. See Burn rate for what the two burn signals measure.
An SLO with no data at all carries no status and shows no tag, which is the expected state for one that was just created.
Known limitations
- Editing in the UI. SLOs can be created, edited on the Settings tab of the detail page (service, indicator type and queries, counter flag, target, labels, annotations, name, description), enabled or disabled, cloned, downloaded as OpenSLO YAML, and deleted in the UI. Editing requires write permission on the SLO.
- Read-only SLOs. SLOs that carry a
dash0.com/originlabel, which is every SLO managed as code, are read-only in the UI. The page shows a Read-only tag naming the managing system, the Settings form cannot be saved, and the Enabled toggle is disabled; change them where they are managed. Admins can still delete them. - The catalog does not group by service yet. The service is shown under each SLO name, and the Status column is not sortable.
- Sharing is API-only for now. Read-access sharing is available through the
dash0.com/sharingAPI annotation; a fuller in-product experience is still landing. It works only with an API token on an SLO that has adash0.com/origin; requests made with a user session ignore it.