
Last updated: October 2, 2026
Create SLOs
You can create an SLO in two ways:
- In the UI: open Alerting › SLOs and click Create with Agent0 to chat with Agent0, which drafts the SLO for you. To fill out the form yourself, choose Manually from the button's More create options menu.
- As code: through the Dash0 Terraform provider or the Dash0 CLI, both of which take the same OpenSLO
SLOdefinition (apiVersion: openslo/v1,kind: SLO). See Manage SLOs as Code.
Either way, you make the same two design decisions, and this page walks through both: what to measure (your SLI) and how reliable it must be (your target).
Prerequisites
- To create in the UI: the Create SLO dataset permission, which Admins and users with the Create Check Rule permission have by default. SLOs cannot be created in demo datasets.
- To create as code (Terraform or the CLI): an auth token with the All permissions (querying, ingesting and configuring) option. Create and manage tokens in Organization Settings › Auth Tokens (Admins only).
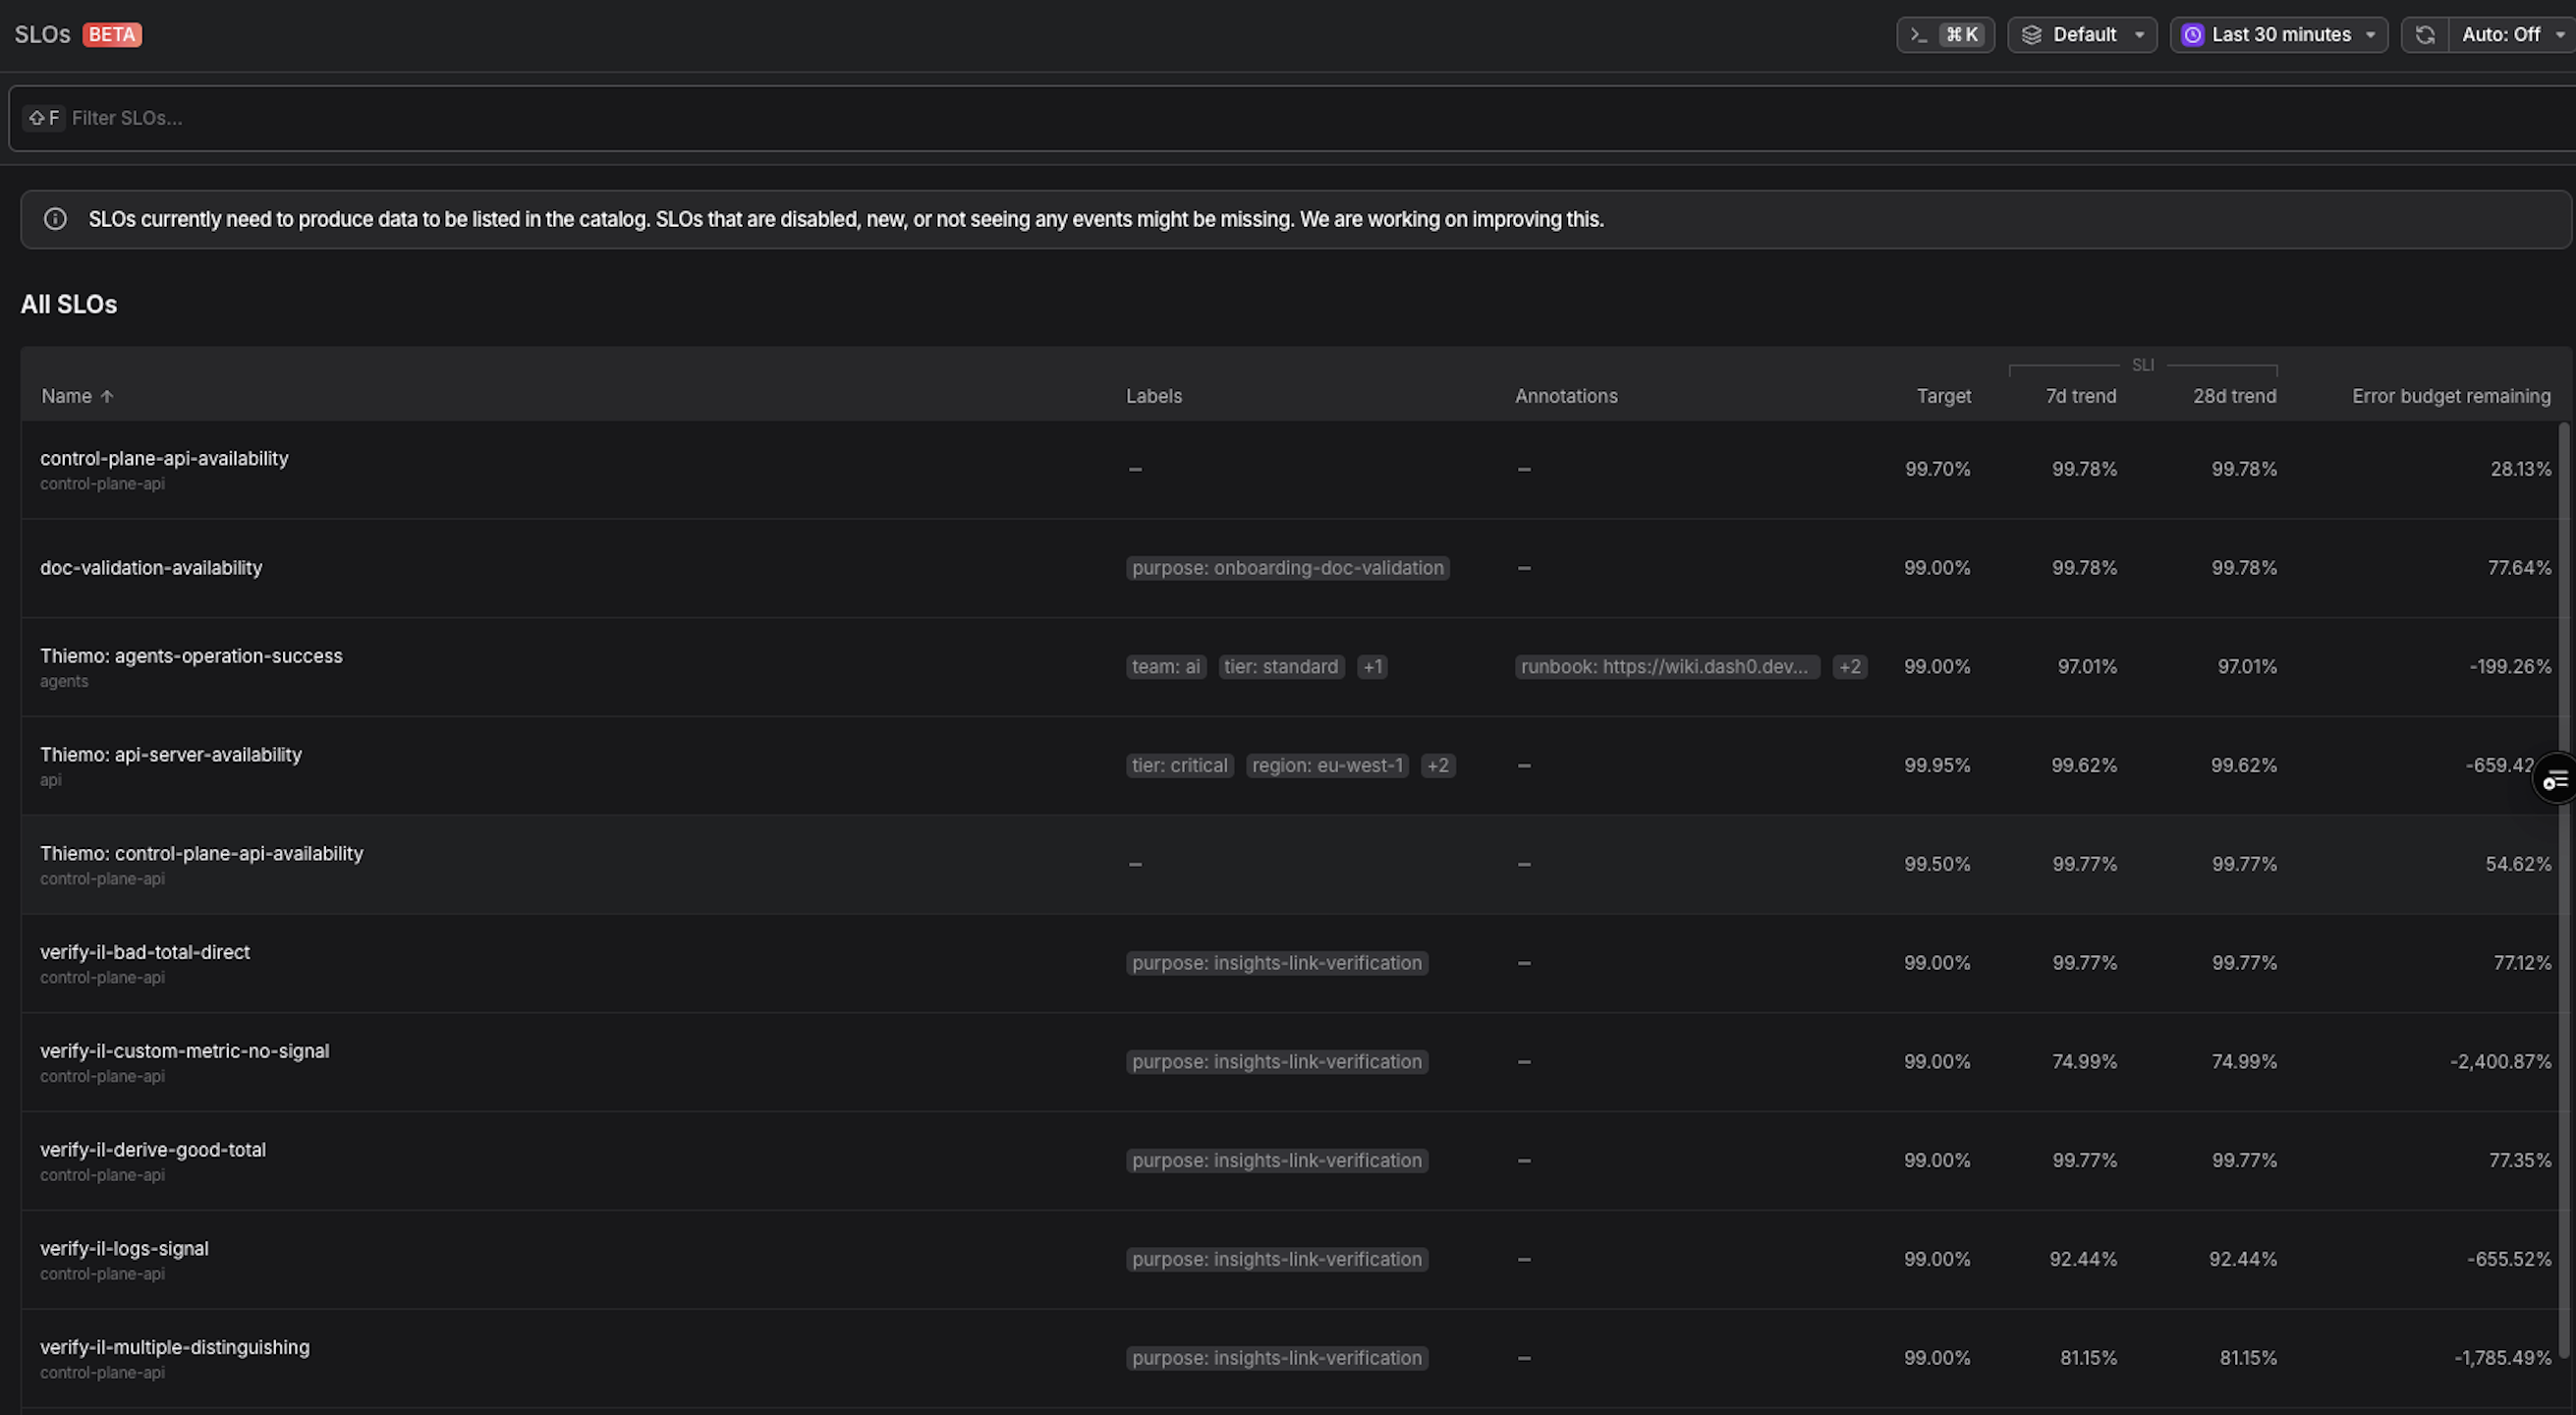
Alerting › SLOs opens the SLO catalog:
Create in the UI
The form asks for the same things this page describes: the SLI shape (Good / Total, Bad / Total, or Raw) and its queries, whether the source is a counter, the target, and the name, description, labels, and annotations. A live SLI preview shows what the queries select before you save:
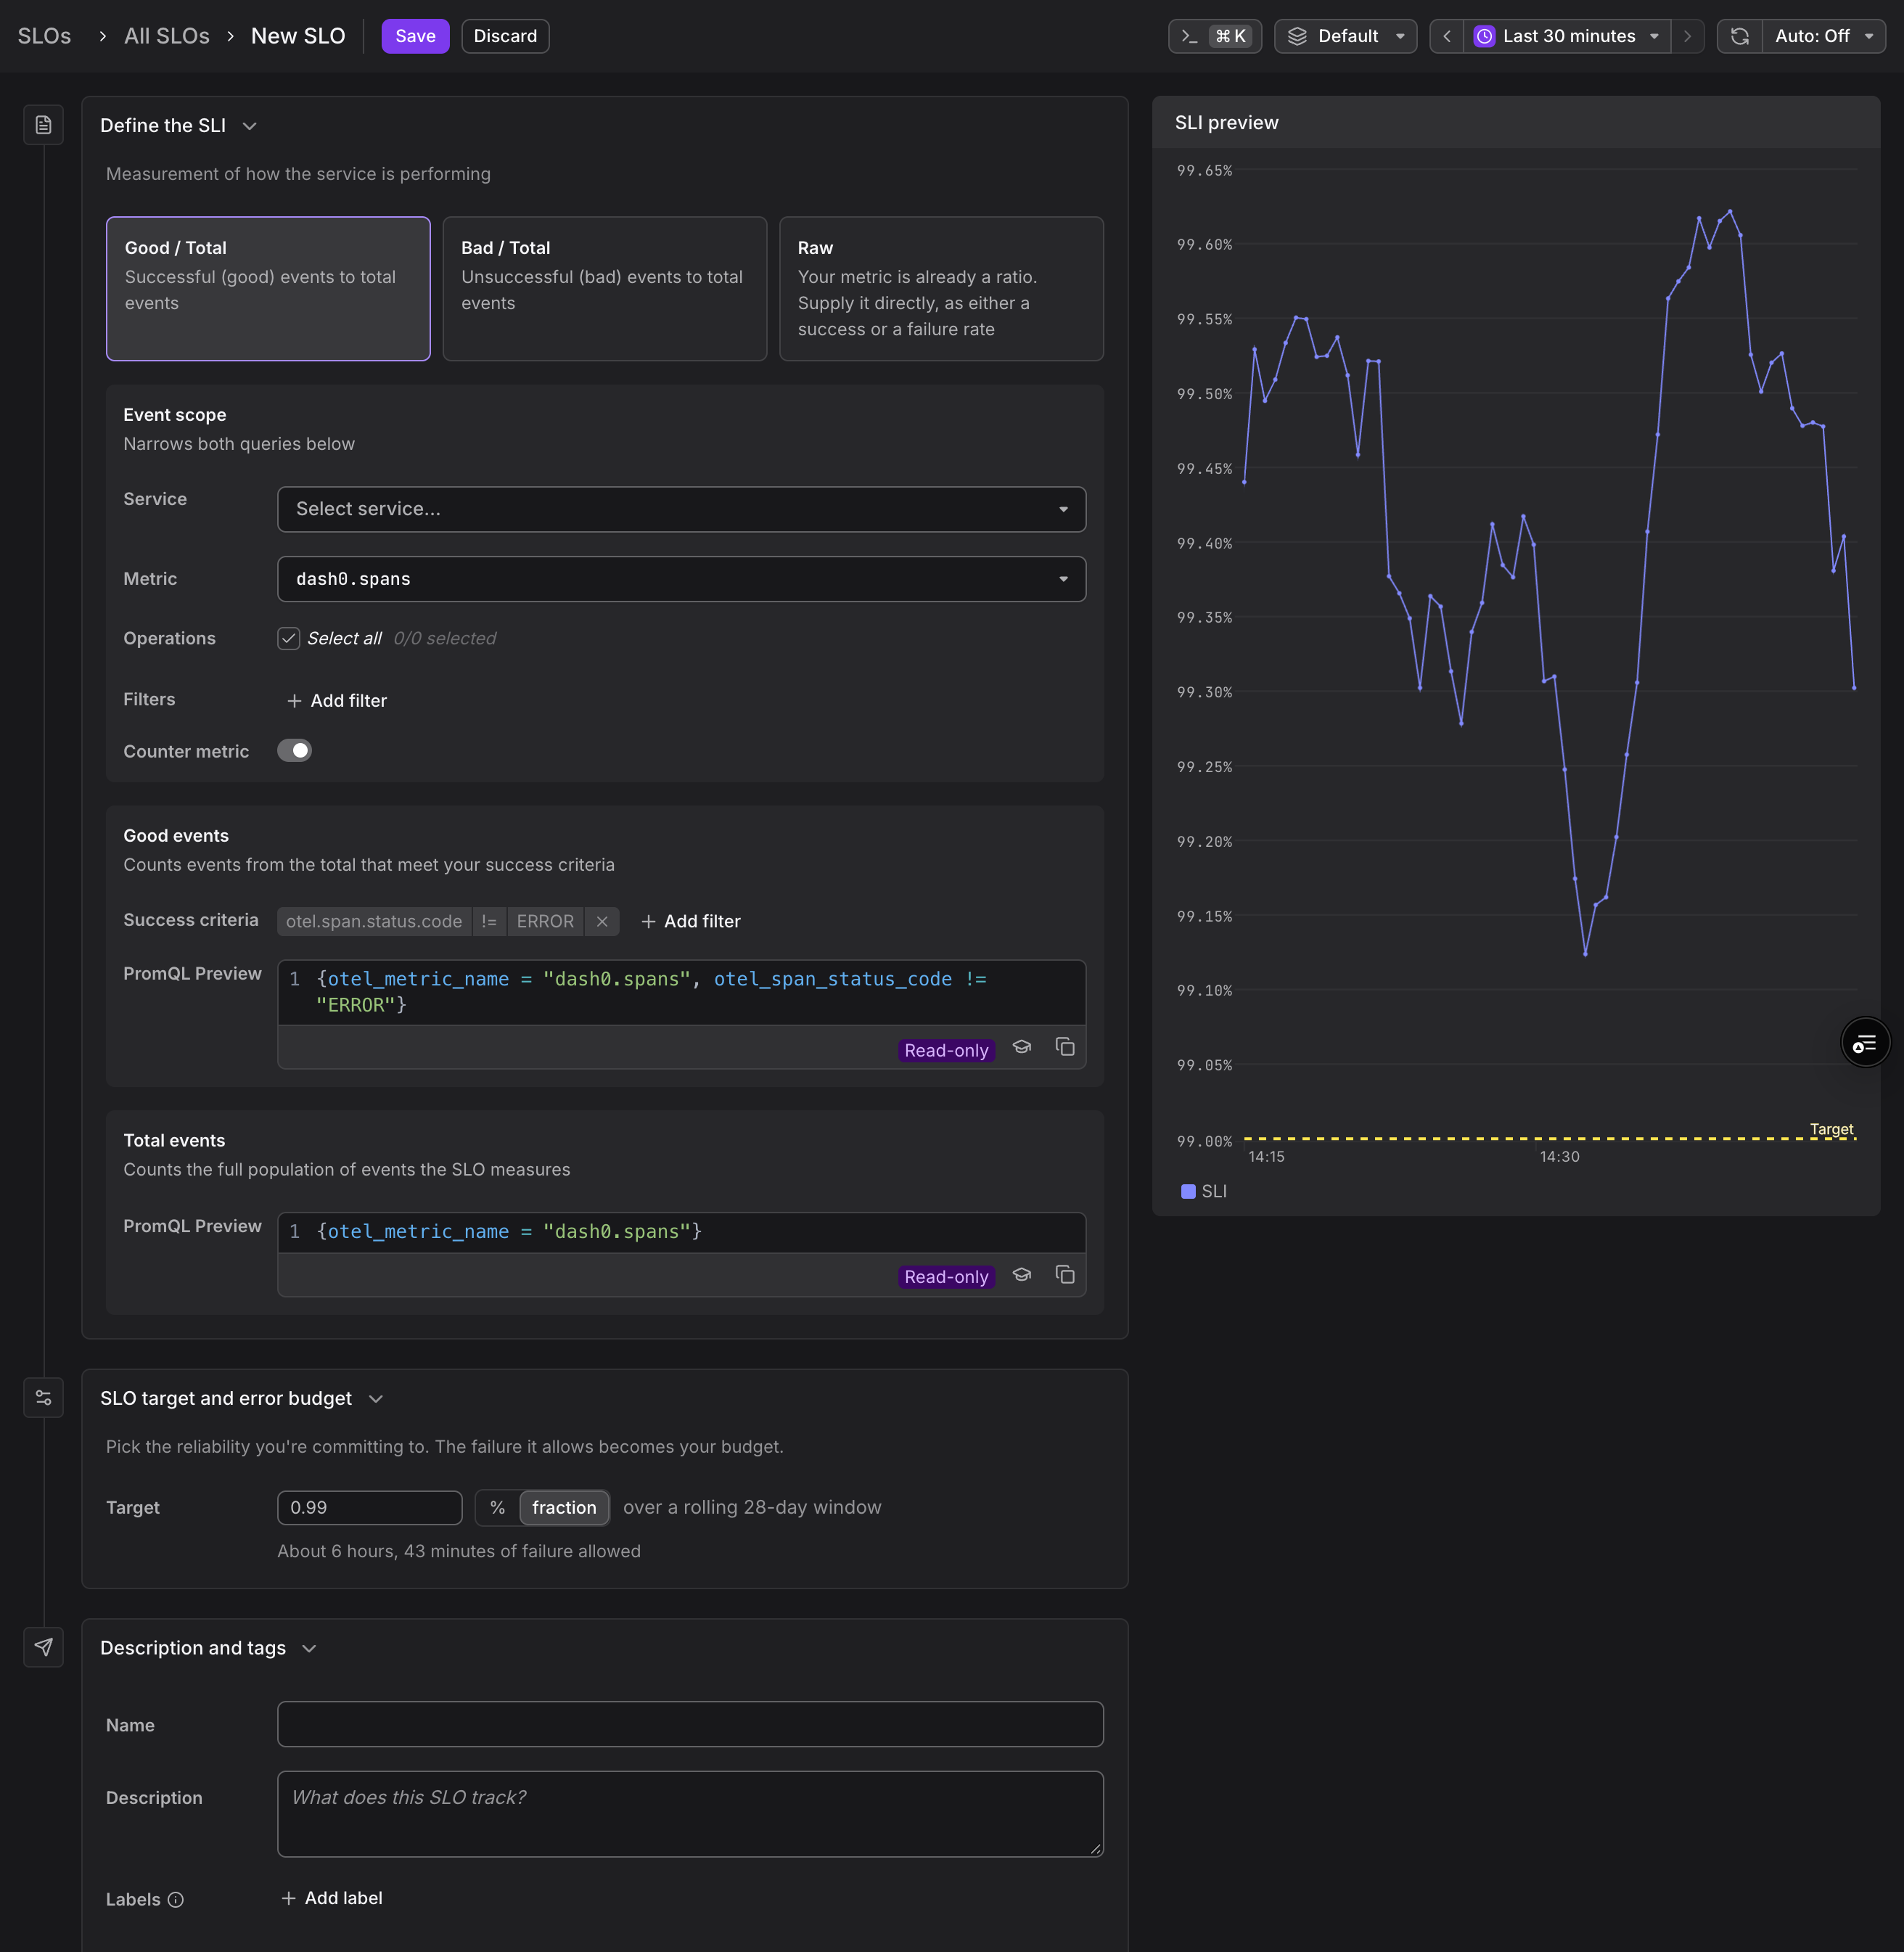
The same form is available on the Settings tab of every SLO you are allowed to edit.
Define your SLI
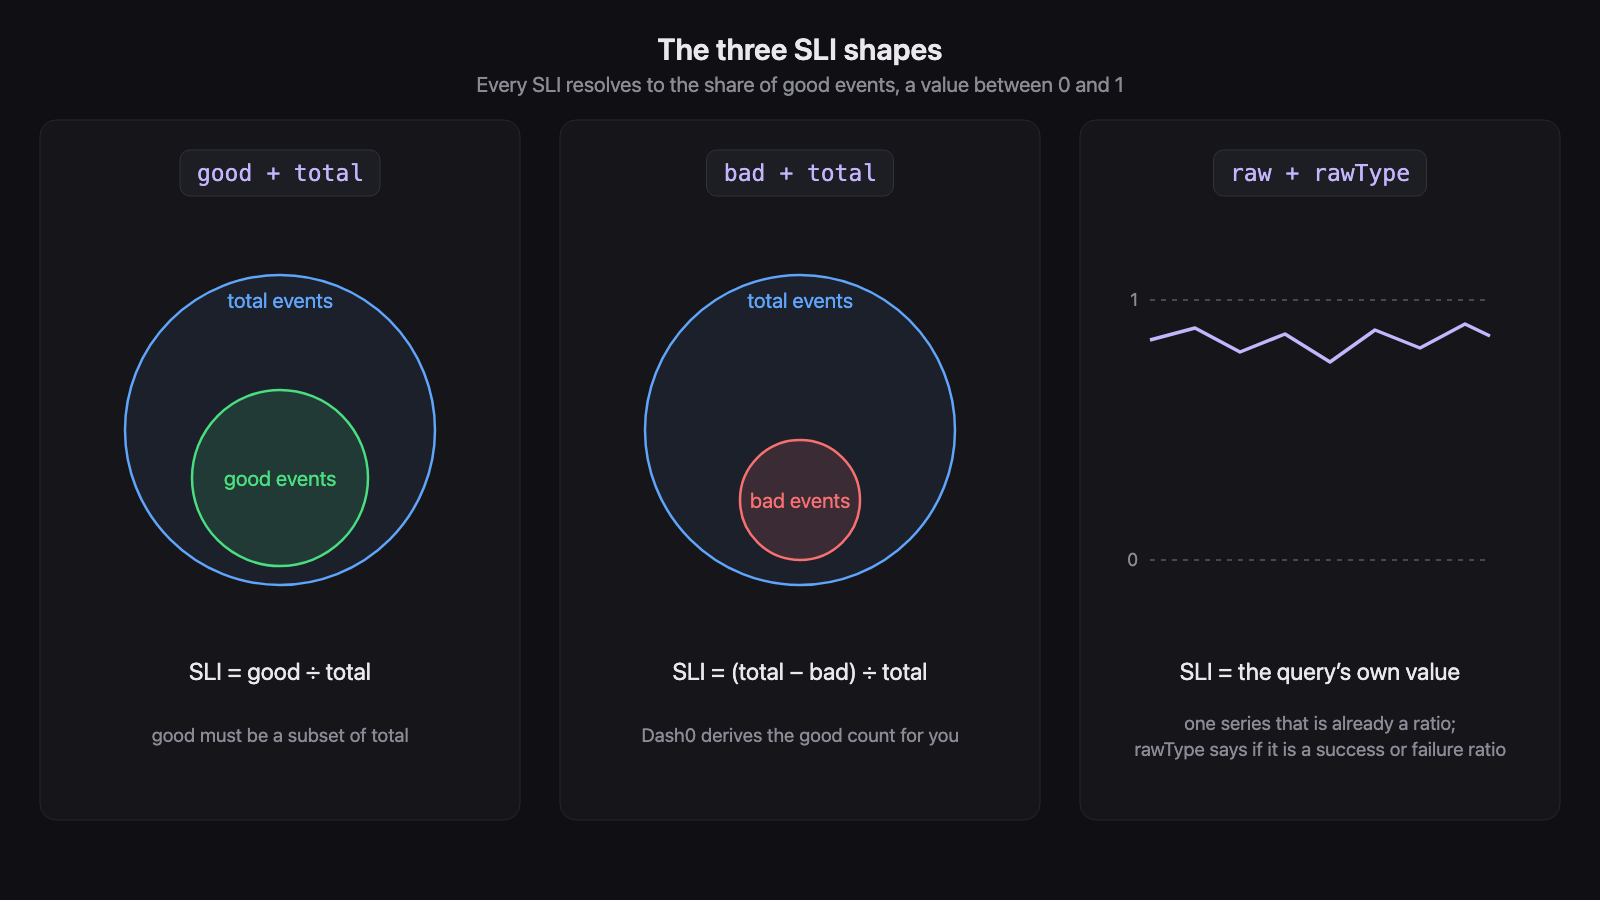
Your Service Level Indicator (SLI) is a ratioMetric, expressed as PromQL over your telemetry. In the UI form, the query builder assembles these queries for you and shows a read-only PromQL preview of each one. An SLI takes exactly one of three shapes:
- good + total — a ratio of good events to total events. Make the
goodquery a subset of thetotalquery so the ratio is well-defined. - bad + total — a ratio of bad events to total events. Dash0 derives the good count as
total - bad. - raw + rawType — a query that already returns a ratio between
0and1. SetrawTypetosuccessif the value is a success ratio orfailureif it is a failure ratio.
A good, bad, or total query must be a bare vector selector (label matchers only; functions and aggregations are rejected with a 400). A raw query may be any PromQL expression that returns an instant vector, so functions, aggregations, and operators are allowed there. The full set of supported and rejected capabilities is listed in the supported OpenSLO capabilities matrix. For an availability SLO on server spans, for example:
- good — server spans whose status is not
ERROR - total — all matching server spans
A good, bad, or total selector may match many series: Dash0 sums all matched series into one event count. Only the raw shape must resolve to exactly one time series, because the sum of several ratios can exceed 1 and the SLI then pins to 100%.
Because each good, bad, or total query is a bare selector, Dash0 handles the aggregation for you. It computes the ratio across the SLO window, including the correct counter math, so there is no need to wrap your queries in sum(...), rate(...), or similar. The counter flag tells Dash0 which math to apply: leave it on (the default) for monotonically increasing counters, where Dash0 applies increase() over 5-minute windows, and turn it off for gauges or other values that can go up and down, where Dash0 only sums the series. It is ignored for raw.
For a latency objective such as "99% of requests finish within 5 seconds", count histogram buckets using the le (less-than-or-equal) label instead of raw durations: the good query selects the bucket at your threshold (le="5") and the total query selects the le="+Inf" bucket. Use a classic histogram _bucket series for this. Exponential (native) histograms do not expose per-le buckets, so an le matcher against them matches nothing and the SLI returns no data. To build a latency SLI on a native histogram, use the raw shape instead, with a query that computes the fraction of requests under your threshold directly.
Choose a target
- Target — the reliability goal as a fraction (for example
0.997for 99.7%). In an OpenSLO document, alternatively settargetPercent(for example99.7). Set exactly one of the two; the value must be strictly between0and1(or0and100). - Budgeting method and time window — not configurable:
Occurrencesbudgeting (count-based: bad events vs. total events) over a rolling 28-day window.
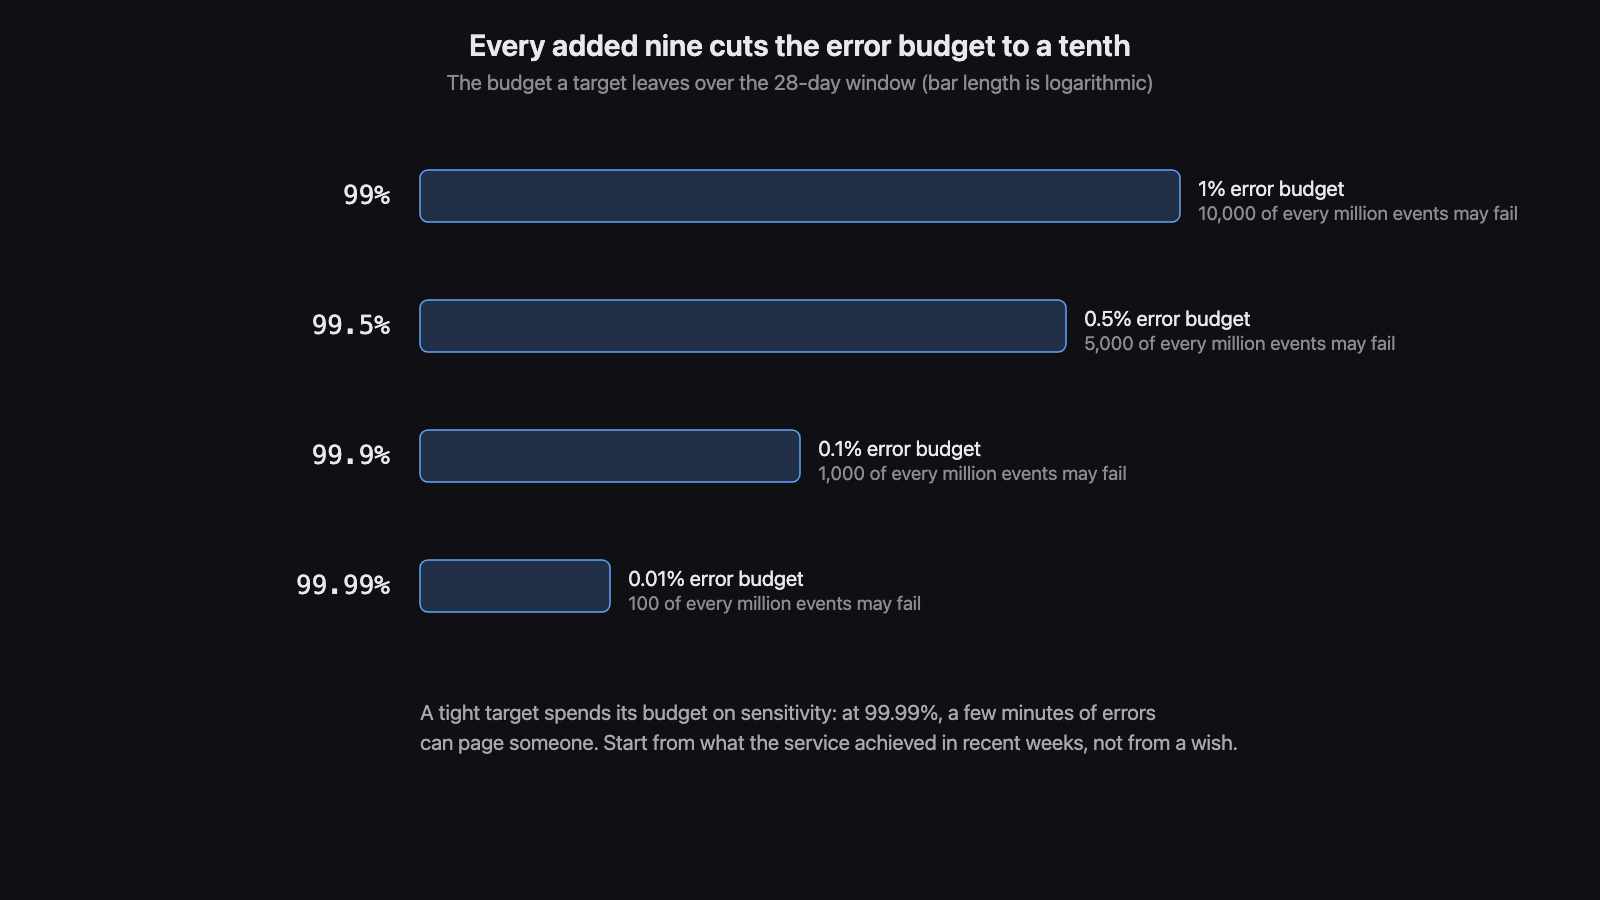
The gap between the target and 100% is your error budget, and every added nine shrinks it to a tenth:
Some guidance for picking the value:
- Start from measured reliability, not from a wish. Look at what the service actually achieved over recent weeks and set the target slightly below it. The form's live SLI preview shows the current ratio while you build the queries, and once an SLO exists, its 28d SLI tile on the detail page shows the achieved value. A target the service has never met turns the SLO into a permanent alarm that everyone learns to ignore.
- Do not pick 100%. A single failed request breaches it, and it leaves no budget for deployments, dependency hiccups, or experiments. The error budget is what pays for change; a target that allows nothing to fail forbids releasing.
- Add nines only when users notice. Each nine makes the burn-rate alerts ten times as sensitive, so a 99.99% target can page someone over a few minutes of errors. If your users are other services with retries, a looser target is usually the honest one.
- Match the caller's expectations. An SLO slightly stricter than what your consumers assume gives you room to react before they are affected. Anything far stricter just burns attention.
You can change the target later on the SLO's Settings tab.
Create as code
The same SLO is one OpenSLO v1 document, whichever tool applies it:
- Terraform: the
dash0_sloresource takes the document in itsslo_yamlattribute. - Dash0 CLI: the
dash0 sloscommand group creates, lists, gets, updates, and deletes SLOs, anddash0 apply -f <file>applies OpenSLO YAML documents from files or directories.
Manage SLOs as Code covers the workflow (stable origins, idempotent applies, exporting SLOs built in the UI), and the SLO object reference documents the definition field by field, including the optional spec.service link to a service and the dash0.com/* metadata such as display name and the enabled flag.
Verify
Open Alerting › SLOs to confirm the SLO appears in the catalog, then open it to see its target, error budget, and burndown. The SLO appears right away with a New badge and empty values; it starts showing data a few minutes later, once the first recording-rule evaluation lands. See View and analyze SLOs.
Supported OpenSLO capabilities
Dash0 implements a focused subset of the OpenSLO contract: Occurrences budgeting, a single objective, a ratioMetric SLI with inline PromQL, and a rolling 28-day window. The full matrix of supported and rejected capabilities, and the SLO limit per organization, are in the supported OpenSLO capabilities reference.