
Last updated: October 5, 2026
Alert on SLOs
SLO alerting is based on burn rate — how fast you are consuming your error budget — rather than on individual threshold violations.
Alert with check rules
Alerting on SLOs is done through Dash0 check rules. SLOs are evaluated continuously and expose a set of SLO metrics, including ready-made fast burn and slow burn signals, and you create check rules against those metrics.
A common pattern uses two signals:
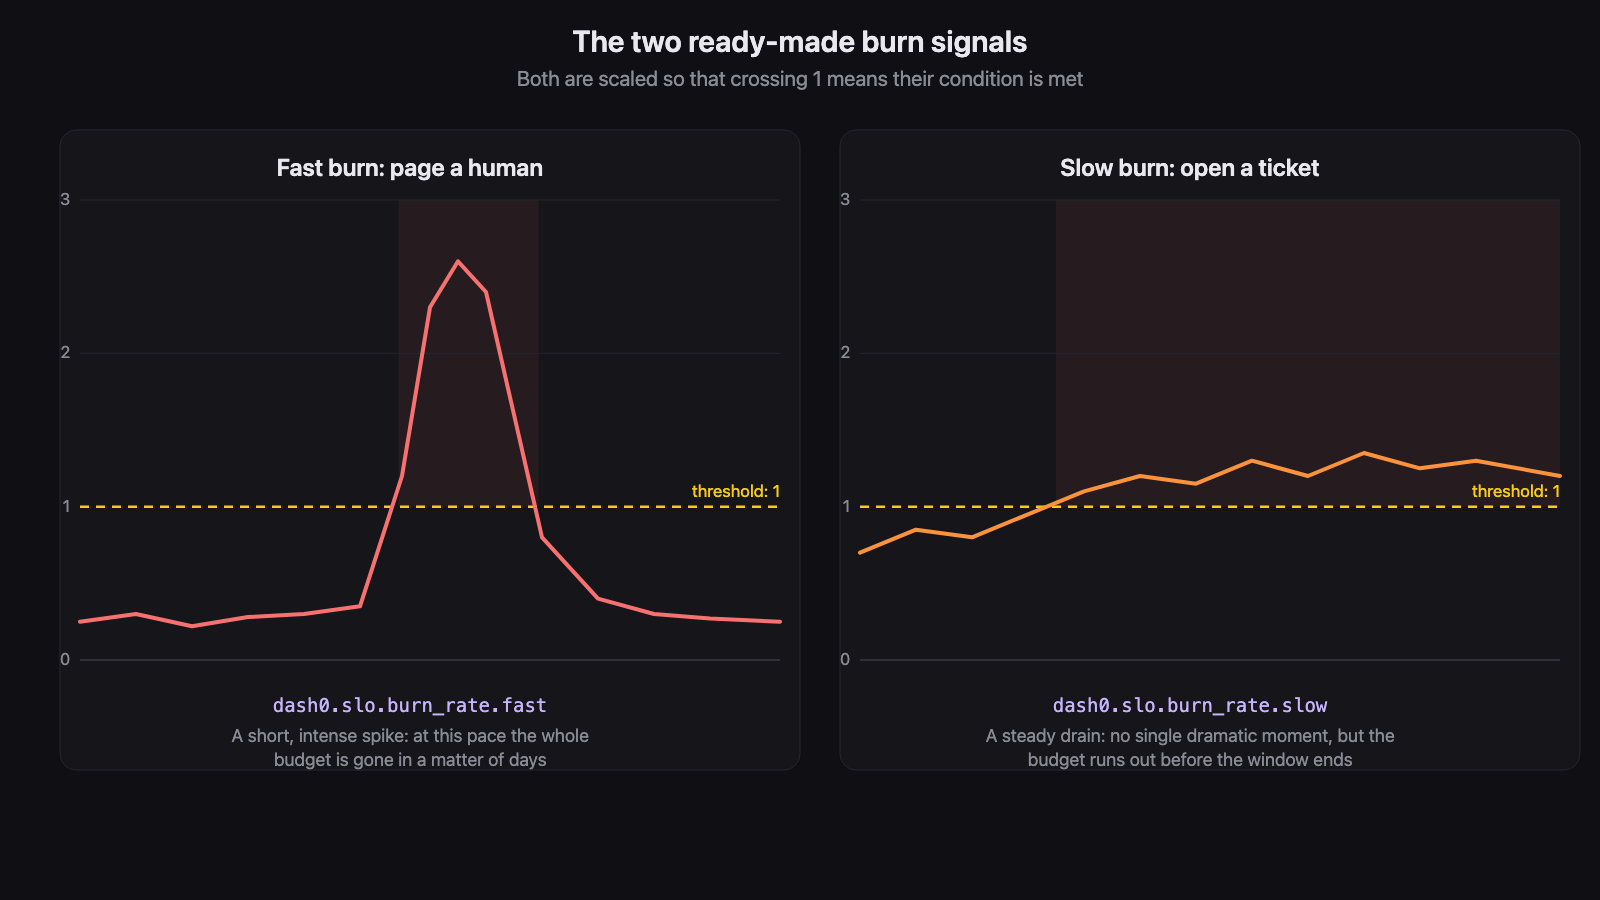
- Fast burn: the error budget is draining fast enough to consume the entire budget for the window in a matter of days. Page-worthy.
- Slow burn: the error budget is draining steadily enough that it will run out before the window ends. Ticket-worthy.
For the burn rates and windows behind each signal, see Burn rate.
Both dash0.slo.burn_rate.fast and dash0.slo.burn_rate.slow are scaled so that 1 is the point at which their condition is met, so a check rule on either one compares it against 1. They are continuous values rather than on/off flags, so a value above 1 tells you how far past the threshold the service has gone, and one below 1 tells you how close it is.
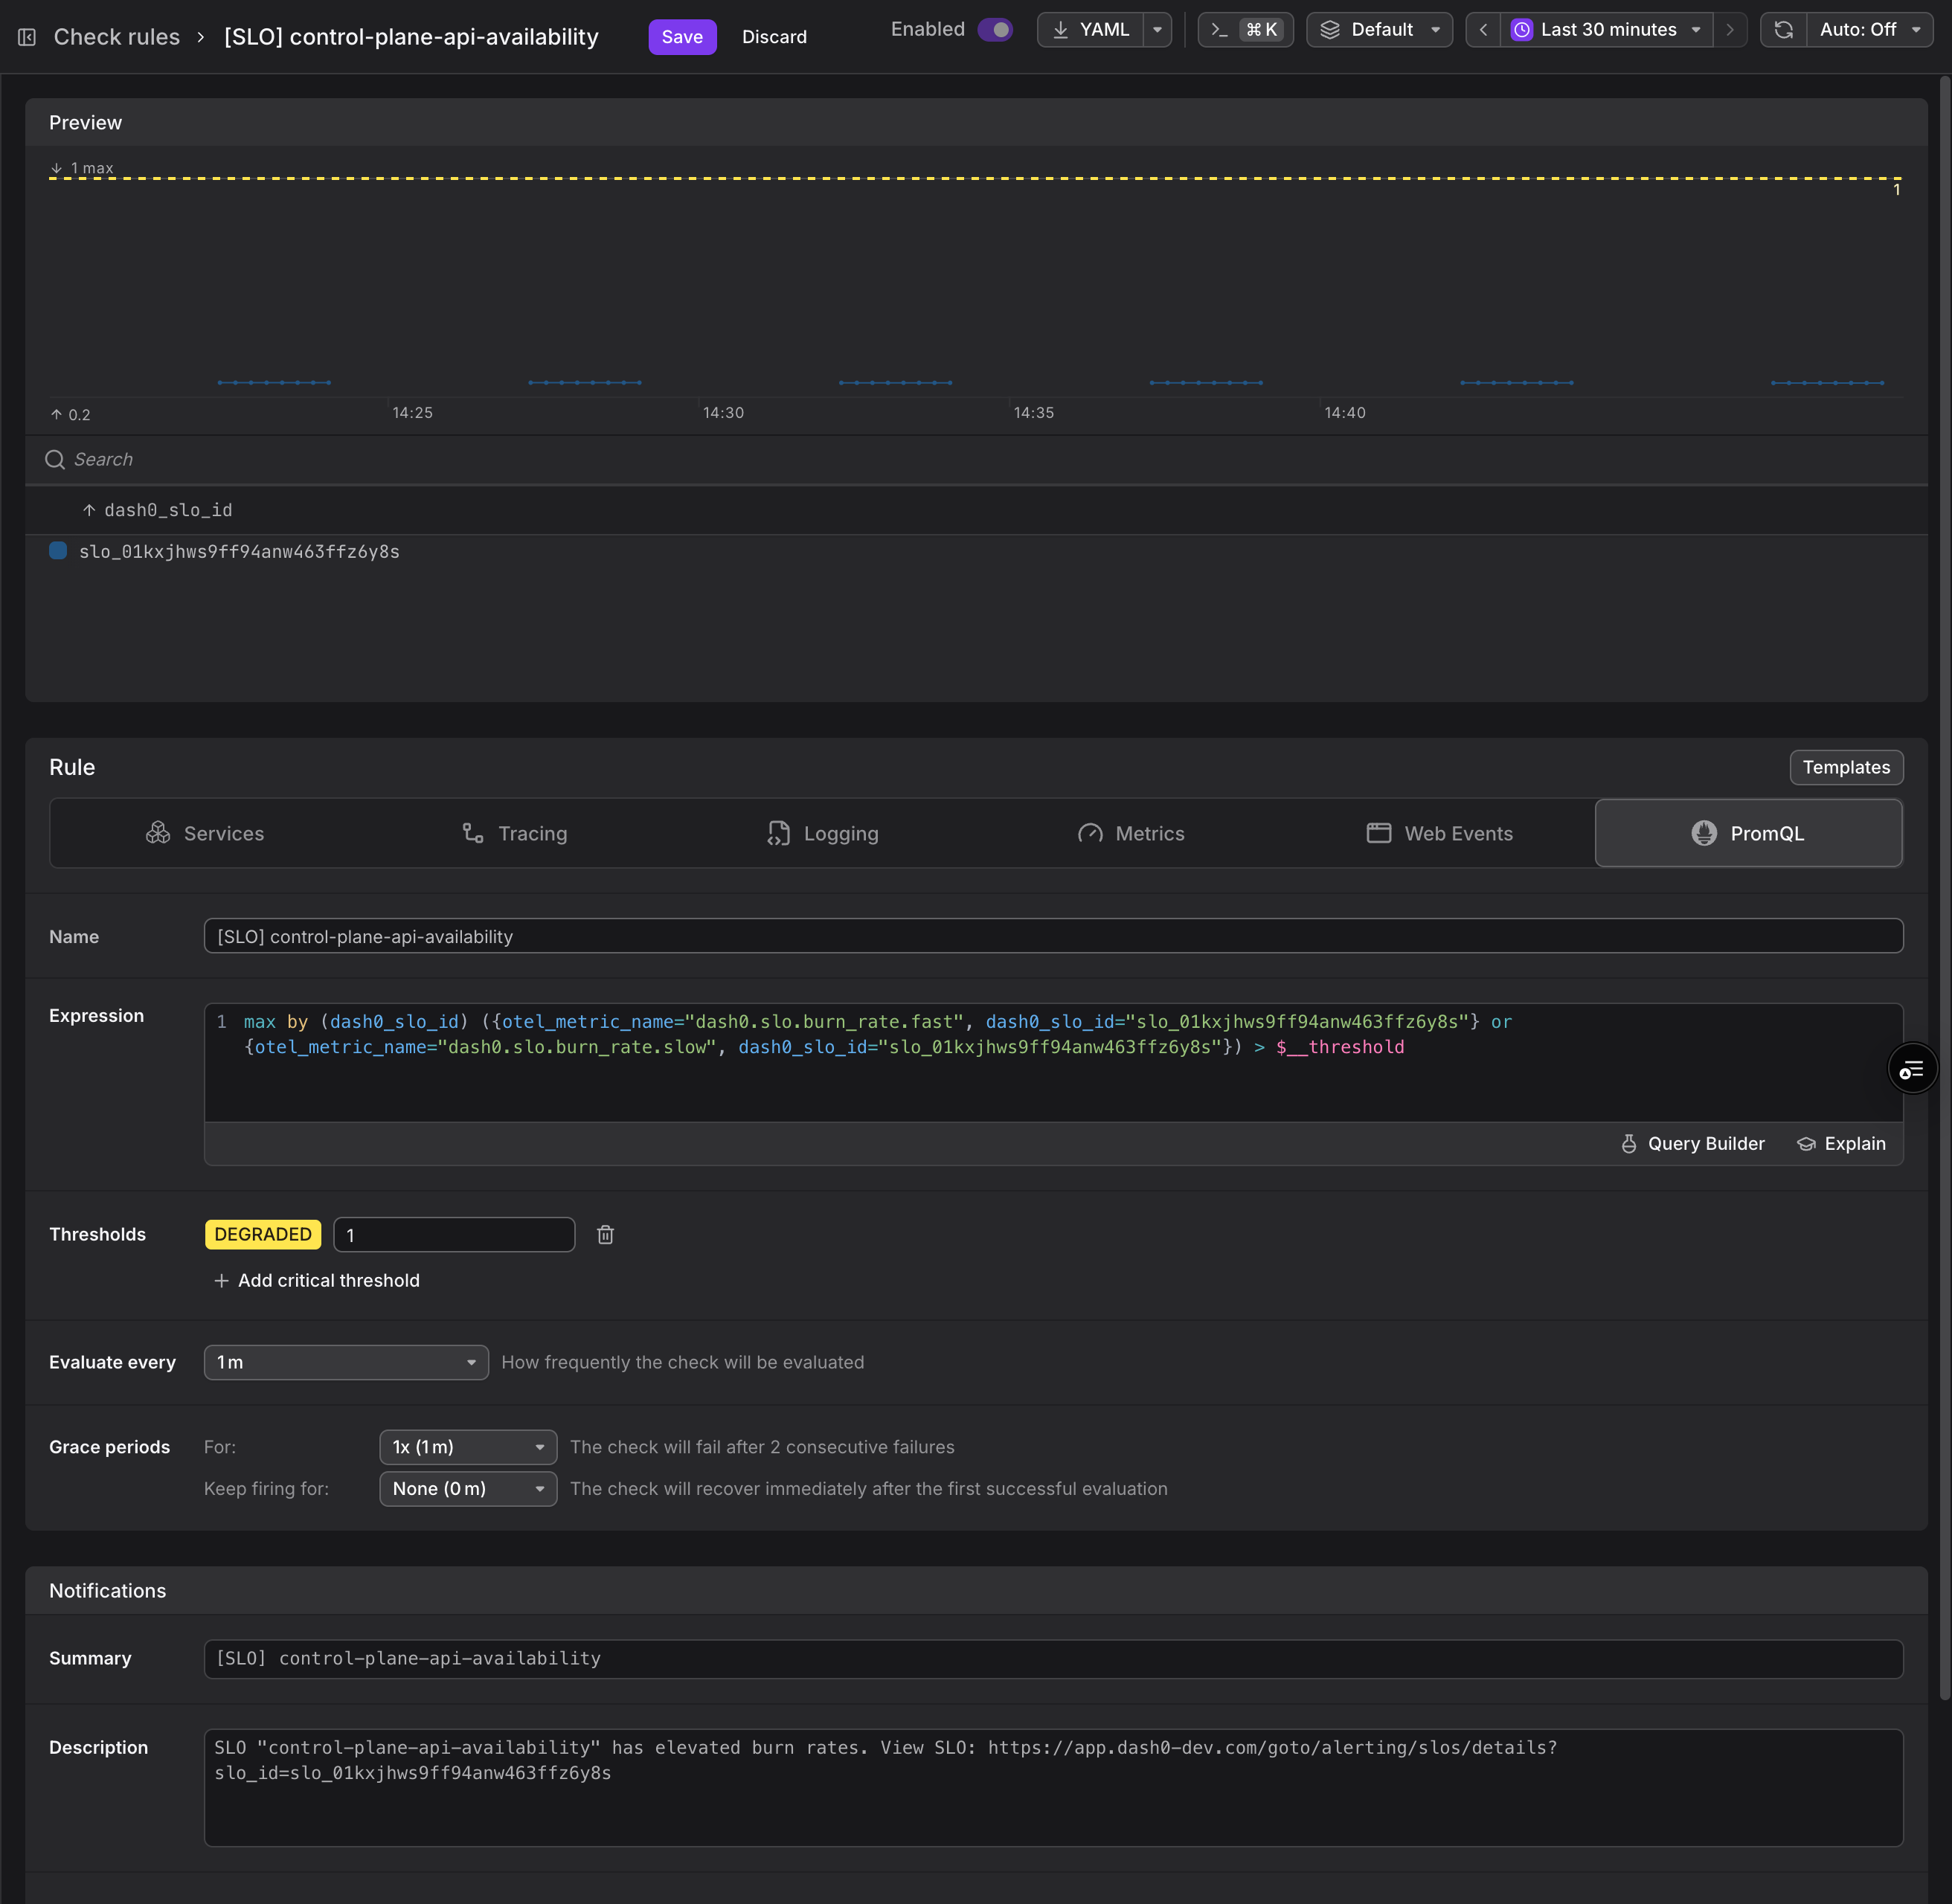
The quickest start is the Create check rule button on the SLO detail page (administrators only), also available from the Burn rate, Error budget, and Burndown chart menus. It opens the check-rule editor prefilled with the worse of the two signals:
1max by (dash0_slo_id) ({otel_metric_name="dash0.slo.burn_rate.fast", dash0_slo_id="<id>"} or {otel_metric_name="dash0.slo.burn_rate.slow", dash0_slo_id="<id>"})
together with a Degraded threshold at 1 and the labels dash0.slo.id, dash0.slo.name, and dash0.slo.link, which link the resulting issue back to the SLO. Adjust the thresholds (for example add a Critical step, or split fast and slow into two rules) and the notification channels before saving.
The dash0_slo_id value is the SLO's dash0.com/id label, visible in the SLO's YAML download. The SLO metrics also carry dash0_slo_name, set to the SLO's metadata.name, so dash0_slo_name="<name>" is an alternative selector.
The SLO metrics are at Development stability and can still change. See SLO Metrics in the Dash0 semantic conventions for the canonical definitions, and SLO metrics for what each one is used for.
If you import an OpenSLO definition that includes alertPolicies, Dash0 accepts the definition but does not store those policies: they are dropped on write and absent when you read the SLO back — the SLO still computes correctly. Configure alerting with check rules as described above.
Alert when an SLO goes silent
Burn rate only moves when events arrive. An outage that stops telemetry altogether produces no bad events, so both burn rate signals stay quiet and a broken service can look healthy. Cover that case with a check rule that fires when an SLO stops receiving data.
Which expression you need depends on what your SLI selects. Picking the wrong one silently never fires, which is the failure this rule exists to catch.
| Your SLI selects | Use |
|---|---|
Dash0 event metrics such as dash0.spans, dash0.logs, or dash0.web.events, including service-scoped SLIs | No events recorded |
| Any other metric | No data recorded |
No data recorded
For SLIs over your own metrics, the 5-minute burn rate stops being reported once the data stops, so alert on its absence:
1absent_over_time(dash0_slo_burn_rate_5min{dash0_slo_id="..."}[15m]) >= $__threshold
Set the critical threshold to 1. This stays quiet while the service is merely idle, because an idle service still reports a burn rate.
No events recorded
For SLIs over Dash0 event metrics, the event count reads 0 for an empty window instead of disappearing, so absence never triggers. Alert on a sustained zero instead:
1(sum(sum_over_time(dash0_slo_events_5min{dash0_slo_id="..."}[15m])) or vector(0)) <= $__threshold
Set the critical threshold to 0.
Tuning the rule
- The range is your detection window. Use at least
15m.30mis a good default. for:is optional damping. The range already absorbs brief gaps, so add afor:duration only if you want a further delay before the issue opens.- Expect roughly 20 to 25 minutes between the telemetry stopping and the issue opening, measured with a
15mrange.
Caveats
- A brand-new SLO has no data yet, so the rule fires at its first evaluation. Enable it once the SLO has started recording, or accept that first issue and let it close on its own.
- For spans, logs, services, and web event SLIs, no traffic and no telemetry are the same observation. The rule fires for both, and the range is how much quiet you are willing to tolerate. Services with genuinely bursty traffic need a longer range.