
Last updated: October 2, 2026
About Service Level Objectives (SLOs)
A Service Level Objective (SLO) turns "is this service reliable enough" into a number, measured against a real signal from your telemetry. That number tells your team when it is safe to keep shipping and when to stop and fix reliability instead.
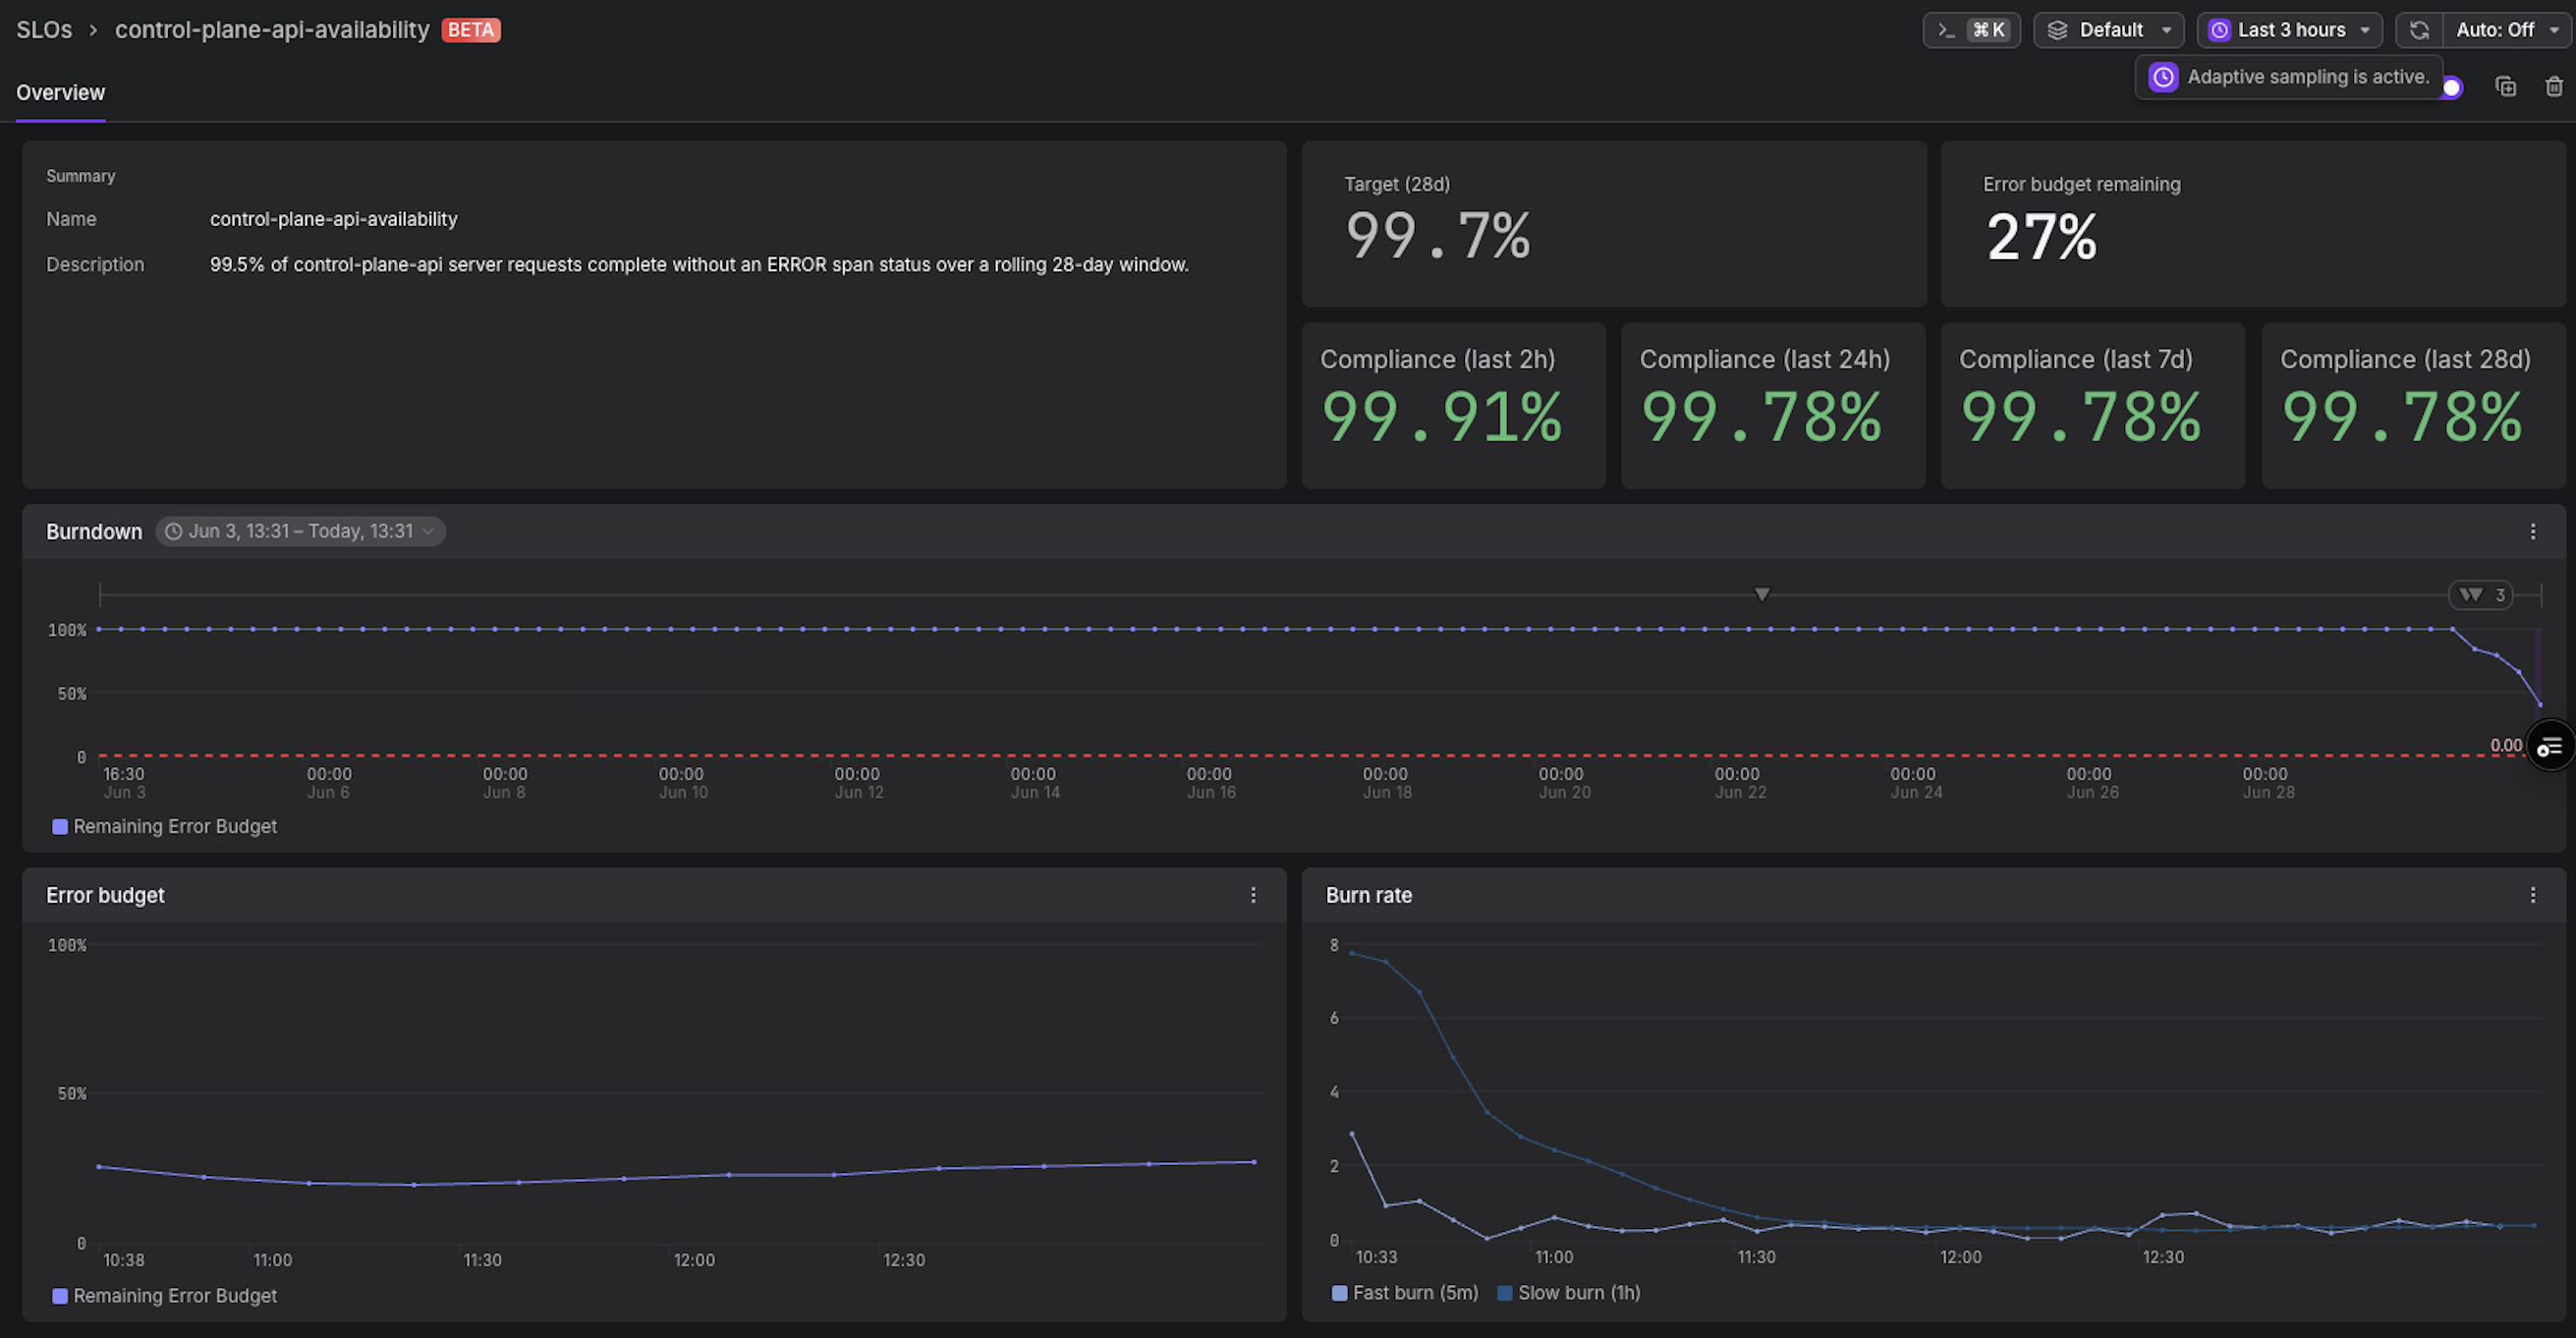
In Dash0, an SLO is built on the same evaluation engine as a check rule, but it answers a different question. Instead of firing the moment a threshold is crossed, an SLO tracks an error budget over a time window and tells you how fast that budget is being consumed. This shifts the question from "did this one request fail?" to "is the service as reliable as our users expect?"
An SLO vs. a check rule
Compared with a check rule, an SLO is:
- Visualized differently — SLO gauges, error-budget burndown charts, and burn-rate views instead of a simple pass/fail.
- Evaluated differently — alerts trigger on error-budget consumption (burn rate) rather than on each individual violation.
Because of this, SLOs have their own entry in the navigation (under Alerting).
Key concepts
| Term | What it means |
|---|---|
| SLI (Service Level Indicator) | The measurement of how the service is performing. In Dash0 this is a ratio of good (or bad) events to total events, or a precomputed ratio, expressed as PromQL over your telemetry (for example, non-error spans divided by all server spans). |
| SLO target | The reliability goal, usually a percentage (for example 99.7%). It determines how many bad events are tolerated within the time window. |
| Error budget | The allowed amount of failure (1 − target) over the time window. With occurrence-based budgeting, the method Dash0 uses, it is measured as bad events versus total events over the window. |
| Time window | The period the SLO is measured over. Dash0 uses a rolling 28-day window. |
| Burn rate | How fast the error budget is being consumed relative to the budget available. See Burn rate. |
| Fast burn | The page-worthy burn rate signal. See Fast burn. |
| Slow burn | The ticket-worthy burn rate signal. See Slow burn. |
This terminology follows Chapter 4, "Service Level Objectives", of Google's Site Reliability Engineering: How Google Runs Production Systems (O'Reilly, 2016), the book that established SLIs, SLOs, and error budgets as an industry practice.
Burn rate
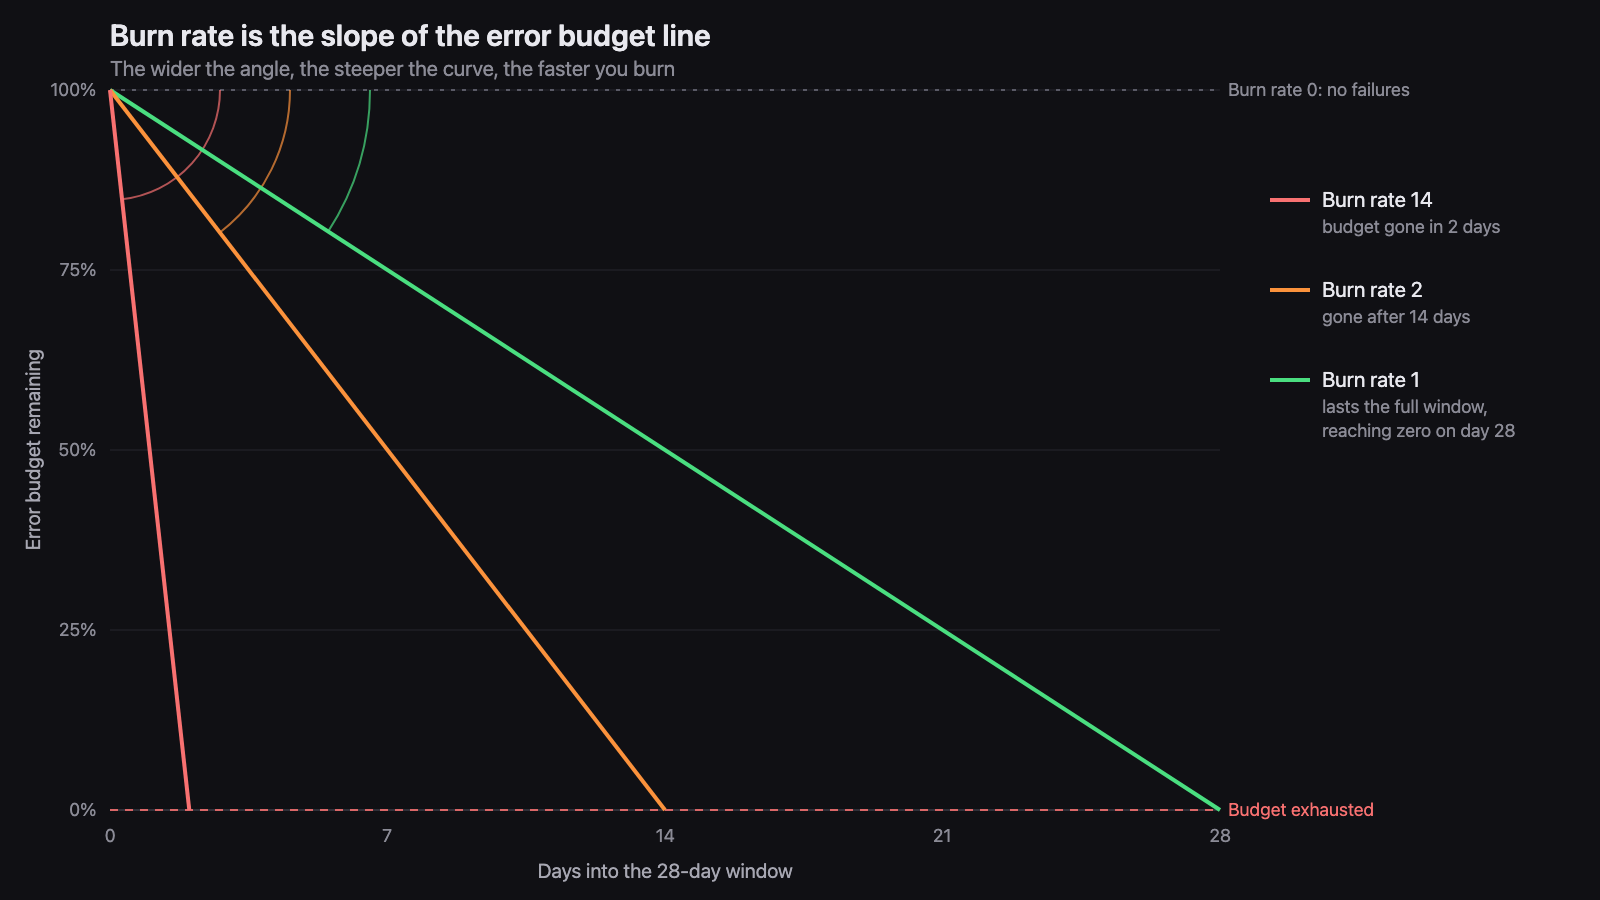
Burn rate is how fast a service is consuming its error budget. A burn rate of 1 spends the budget at exactly the sustainable pace, using it up right as the 28 day window closes. A burn rate of 10 spends it ten times faster.
Read burn rate as the slope of the error budget line: the wider the angle away from flat, the steeper the curve, and the faster the budget is gone.
Dash0 tracks two burn rate signals against every SLO.
Fast burn
Fast burn means your error budget is draining fast enough that, if nothing changes, this alone would consume the entire budget for the window in a matter of days. Something is actively broken and someone should look now.
Fast burn has two tiers. The first fires when the budget is being spent fast enough to consume 2% of the whole window's budget in an hour; the second when it is fast enough to consume 5% of it over six hours. Each tier pairs its window with a shorter confirmation window: five minutes for the first tier, thirty minutes for the second. The confirmation window makes the signal fire only while the problem is still happening and clear on its own once the service recovers.
Slow burn
Slow burn means your error budget is draining steadily rather than dramatically. No individual failure is large enough to look like an incident, but the trend is persistent enough that the budget will run out before the window ends. This is worth a ticket, not a page.
Slow burn also has two tiers, defined as spending 10% of the window's budget in a day and 10% of it over three days, each confirmed against a shorter window of two hours and six hours respectively. On the 28-day window, the three-day share works out just below the break-even rate, so the floor described below raises that tier's threshold to a burn rate of 1.
How the thresholds scale with the window
Each tier is defined as a share of the error budget rather than a fixed burn rate, so the burn-rate value that triggers it depends on the length of the SLO window. For the rolling 28-day window the fast-burn tiers work out to burn rates of 13.44 and 5.6, and the slow-burn tiers to 2.8 and 1. Every SLO uses the 28-day window today, so these are the numbers you will see. The tiers are defined as budget shares so that they stay meaningful when other window lengths become available: a shorter window makes each hour a larger share of the budget, so the thresholds fall, with a floor at 1, the break-even rate.
Why two windows
The longer window decides how much evidence is needed before the signal fires. The shorter window confirms the problem is ongoing. Pairing them gives you alerts that are quick to detect real degradation, quiet during brief blips, and quick to resolve once the service is healthy again.
Every percentage above is a share of the window's whole error budget, not of the budget you have left. Both signals measure how fast budget is being spent, and neither one knows how much remains. So if you have already spent most of the window's budget, even a slow burn will exhaust it sooner than the numbers above suggest. Check Remaining Error Budget on the SLO detail page (or the Error budget remaining column in the catalog) for that view.
When the error budget runs out
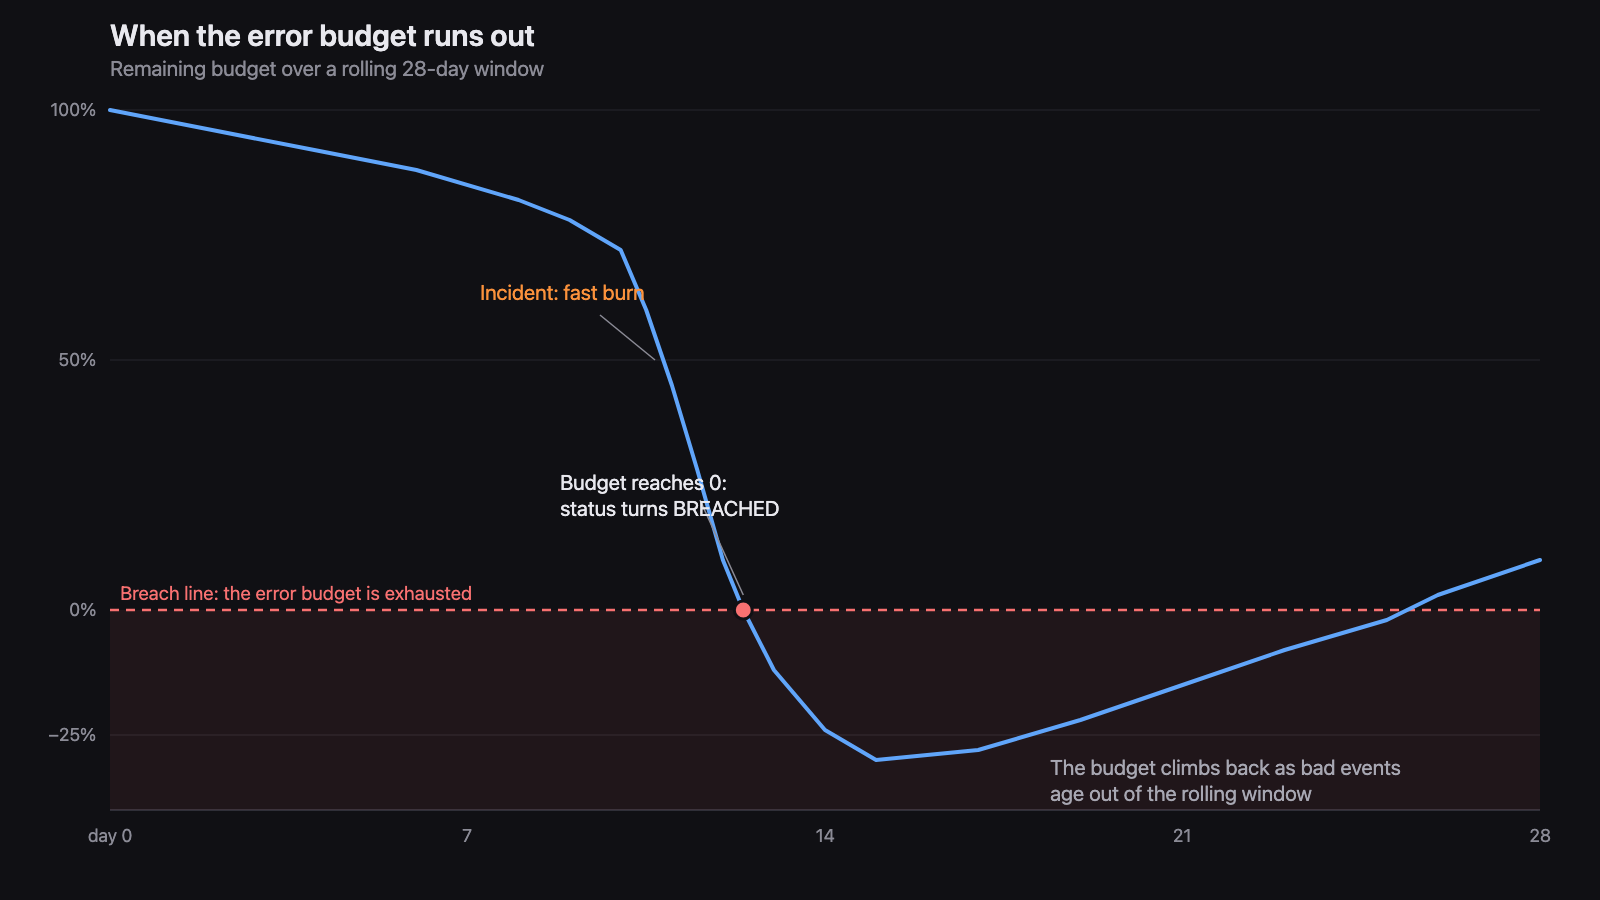
An SLO does not stop or reset when its budget is gone. Compliance sits below target for the remainder of the window, and dash0.slo.budget.remaining reaches 0 at exhaustion and keeps going negative as failures pile up past the budget, so the burndown chart can render the breach below the axis. The Burndown and Error budget charts draw a red breach line at 0, and the SLO status turns BREACHED when the remaining budget reaches 0. Dash0 does not warn ahead of exhaustion: the AT RISK statuses, driven by the fast and slow burn signals, are the early warning. If you want a low-budget warning as well, build a check rule on dash0.slo.budget.remaining with a threshold of your choice, for example 0.1.
Nothing pages you at that moment on its own. Dash0 raises no built-in alert when an objective is breached, so the check rules you build on the burn rate signals are what actually reach a person. The fastest path is the Create check rule button on the SLO detail page, which prefills a rule on the two burn signals. See Alerting on SLOs.
Until an SLO is 28 days old, the remaining budget is a projection rather than a plain "budget left" figure: Dash0 scales the consumption seen so far by the share of the window that has elapsed since the SLO was created, so early readings reflect the observed failure rate across the full window and firm up as the window fills. The detail page flags this with a % of window badge on the Burndown chart while it applies.
Because the window rolls rather than following the calendar, the budget recovers on its own. As bad events age past the 28 day boundary they stop counting against the ratio, and the remaining budget climbs back without anyone resetting it.
What can you measure
An SLI is a raw measurement of how a service is performing, pulled from your telemetry. Most SLIs measure availability, error rate, or latency. Common SLO blueprints include:
- Availability / uptime: the share of requests served without an error status over the window.
- Error rate: the same reliability question asked from the failure side. Define the SLI as bad events over total events, and Dash0 derives the good count as the remainder.
- Latency: the share of requests served faster than a target threshold.
The same model extends to more specific cases such as pipeline, database, and AI-service SLOs.
SLO metrics
Every SLO continuously emits a set of metrics. They are ordinary metrics in Dash0, so you can chart them on dashboards, query them, and build check rules on them.
SLO Metrics in the Dash0 semantic conventions is the reference for the set: every metric name, its instrument and unit, the windows it is emitted for, its value range, and the attributes each series carries. This page does not repeat that list. What follows is what the metrics are for and which parts of the product they drive.
- Compliance and budget.
dash0.slo.success_ratiois the value that decides whether the SLO met its objective and backs the 28d SLI tile; the7dsuccess ratio backs the 7d SLI tile and the two trend columns in the catalog.dash0.slo.budget.remainingbacks the Remaining Error Budget tile, the Error budget chart, and the BREACHED status. - Rolling windows. The windowed
burn_rateseries (5minthrough3d) are what the burn rate tiers compare against. Each one is the burn rate over that trailing window. The SLO overview derives its 2h SLI and 24h SLI tiles from them as1 - burn_rate * (1 - dash0.slo.target), reading both series at the same instant. - Burn rate signals.
dash0.slo.burn_rate.fastanddash0.slo.burn_rate.sloware pre-composed alert signals, one for each band described in Burn rate. Each takes the worse of its two tiers, so alerting on the two records covers all four tiers. Alert on them directly instead of combining two windows yourself; the SLO detail page offers a Create check rule action that prefills exactly that. See Alerting on SLOs. - Event counts. A single
dash0.slo.events.5minordash0.slo.events.good.5minsample is the event count for the trailing 5 minutes, which gives you raw volume alongside a ratio. A success ratio of0.5means something very different across 4 events than across 40,000. The1hcounterparts are rolling sums of the 5-minute samples, which overlap, so they read roughly 10x the hourly volume; they exist to feed the longer-window ratios and should only be used in ratios against each other. Summing either series over time over-counts in the same way.
The metrics are recorded on three cadences: every 30 seconds for the event counts and the 5-minute burn rate, every 5 minutes for the target, the 30-minute to 1-day burn rates, the fast and slow signals, and the hourly event counts, and every 15 minutes for the success ratios, the remaining budget, and the 3-day burn rate. The SLI runs with a fixed 5-minute settling delay. When you chart or alert on a 15-minute record such as dash0.slo.budget.remaining or dash0.slo.success_ratio, wrap the read in last_over_time(...[30m]) or use a range of at least 15m, otherwise an instant read lands between samples and shows gaps.
The two burn rate signals are continuous values, not on/off flags. They are scaled so that 1 is the point at which their tier's condition is met: below 1 you can see how close the tier is, and above 1 you can see how far past it the service has gone. The Burn rate chart on the SLO detail page plots them as Fast burn pressure and Slow burn pressure against a line at 1.
These metrics are at Development stability, so they can still change. Metrics for SLO types Dash0 does not support yet, such as threshold SLIs and time-slices budgeting, are not emitted.