
Last updated: October 11, 2026
Create Check Rules from Charts
You can create check rules directly from any chart or timeline in Dash0. This approach automatically captures the query and filters from the visualization, making it faster to set up monitoring for metrics you're already viewing.
Creating check rules requires Admin privileges or a Maintainer role in the dataset. See About Alert Monitoring for details on access restrictions.
How It Works
When you create a check rule from a chart, Dash0 automatically:
- Captures the PromQL query from the chart.
- Preserves all filters (service names, labels, resource attributes).
- Opens the check rule editor with the query pre-populated.
- Converts the visualization to a time series chart suitable for threshold monitoring.
This eliminates manual query writing and ensures your check rule monitors exactly what you were viewing in the chart.
Check Rules Always Use Time Series Charts
Regardless of the source chart type, check rules always use time series visualizations. This is because alerts monitor changes over time, not point-in-time snapshots. A pie chart or gauge shows the current state, but an alert needs to track whether a metric crosses a threshold and stays there for a specified duration.
When you create a check rule from a non-time-series chart (such as a pie chart, stat chart, or gauge), Dash0 converts the underlying query to a time series format automatically.
Create a Check Rule from a Chart
You can get started creating check rules from several locations in Dash0.
From the Query builder
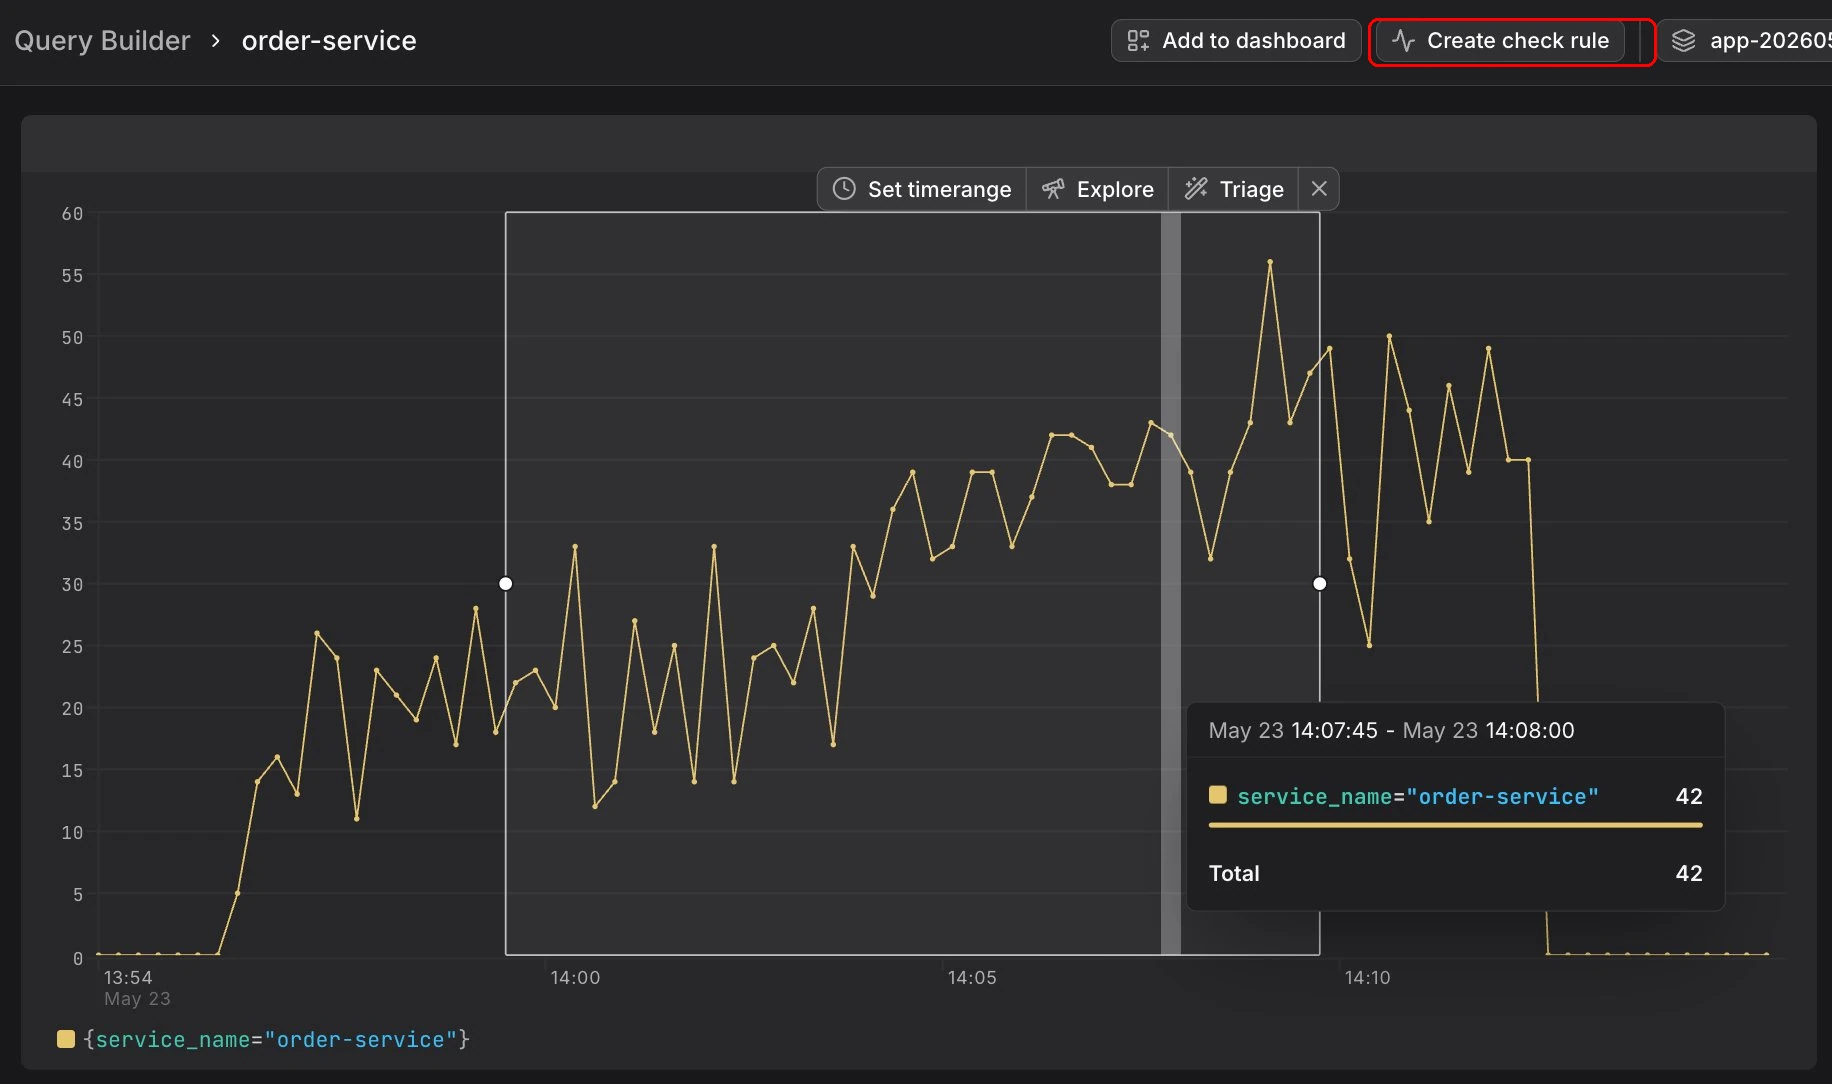
From the Query Builder, click the Create check rule button in the top-right toolbar, after selecting a relevant filter and timeframe.
The check rule editor opens with the query pre-populated from the chart.
Configure the remaining settings as described in Create Check Rules from Scratch.
The check rule becomes active immediately and begins evaluating at the configured interval.
From Explorers
Click and drag to select a region of a chart in an explorer, such as in the Log Explorer below. Whether you have created a time selection or not, you can click Create check rule above the chart.

This lets you set up alerting on patterns you've already identified — such as error spikes or unexpected severity changes — without configuring the rule from scratch.
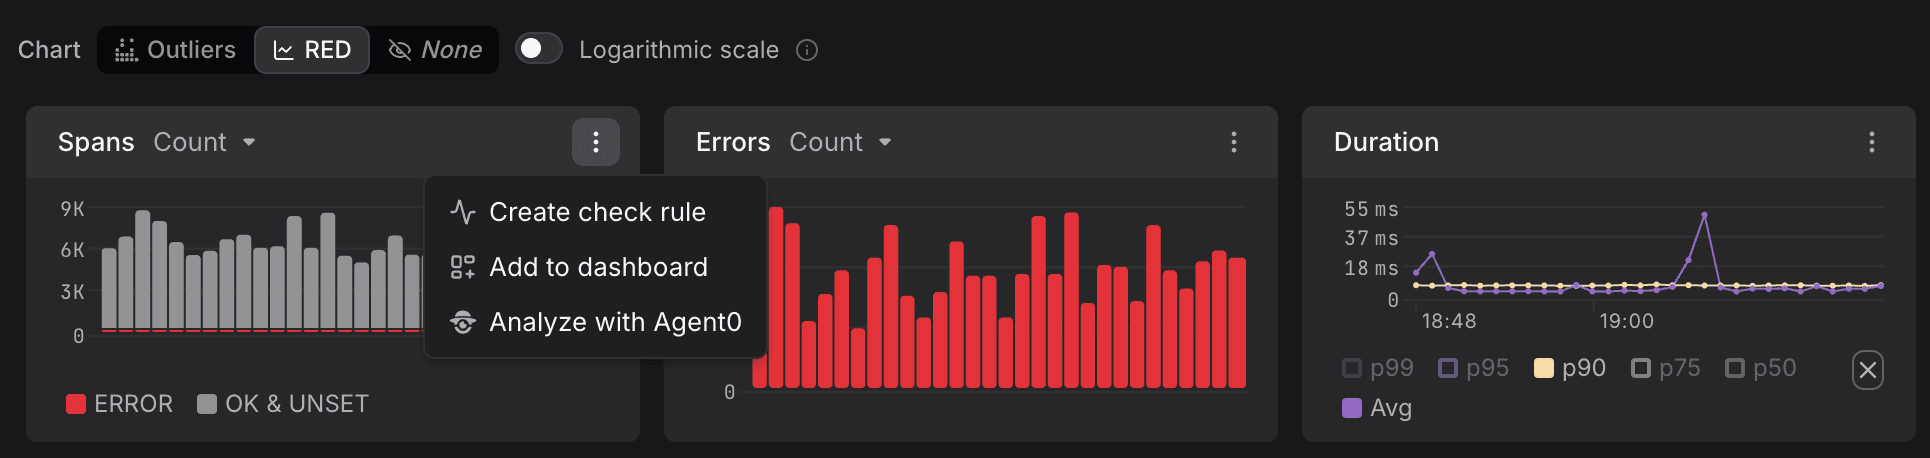
It is not possible to create a check rule from the Outliers Map of the Tracing Explorer, because it is a four-dimensional visualization (time, duration, concentration of spans and concreation of errors). You can, however, create check rules from the RED charts that the Tracing Explorer provides.
The check rule editor opens with the query pre-populated from the chart.
Configure the remaining settings as described in Create Check Rules from Scratch.
The check rule becomes active immediately and begins evaluating at the configured interval.
From Dashboard Panels
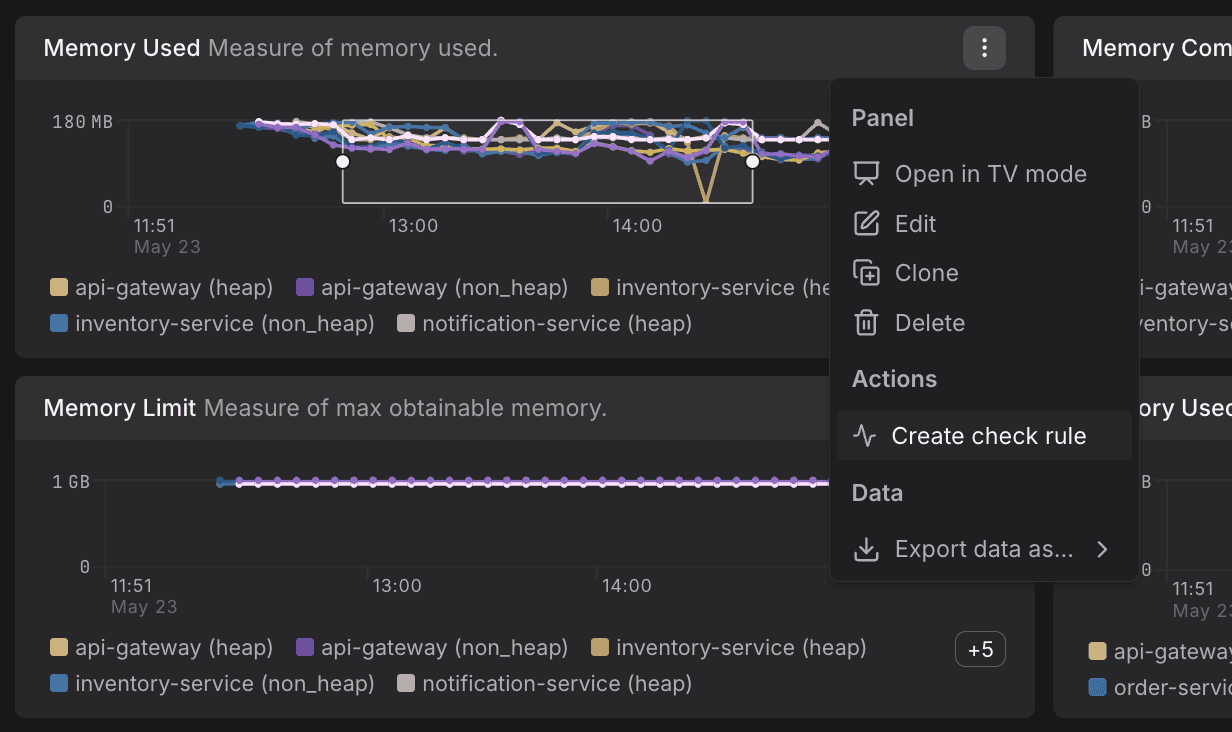
On any dashboard panel, click the three-dot menu (⋮) and select Create check rule, after selecting a relevant filter and timeframe.
The check rule editor opens with the query pre-populated from the chart.
Configure the remaining settings as described in Create Check Rules from Scratch.
The check rule becomes active immediately and begins evaluating at the configured interval.
Supported Dashboard Panel Types
Not all dashboard panel types support check rule creation. The Create check rule option is available for:
- Time Series Chart — line and bar charts showing metrics over time
- Pie Chart — proportional distribution charts
- Stat Chart — single metric value displays
- Gauge Chart — gauge visualizations
The following panel types do not support check rule creation:
- Heatmap Chart — four-dimensional visualization (time, duration, concentration)
- Tree Map Chart — hierarchical proportional area charts
- Time Series Table — tabular time series data
- Log Table — log entry tables
- Dependency Map — service relationship graphs
- Hierarchy Map — service/resource hierarchy views
- Geo Map — geographic visualizations
- Issues Timeline — issue tracking timelines
- Markdown — static text content
These panel types either lack the time-based metric queries required for alerting, or represent multi-dimensional data that cannot be reduced to a single threshold-based alert.
Example Workflow
Here's a typical workflow for creating a check rule from a chart:
- Explore your data in the Metric Explorer or a dashboard.
- Identify an issue or pattern you want to monitor (e.g., error rate spike).
- Apply filters to focus on the specific service, namespace, or resource.
- Verify the query shows the metric you want to alert on.
- Create check rule using the button (Query Builder) or three-dot menu (dashboard panels).
- Set thresholds based on the values you observed in the chart.
- Configure notifications to alert your team when the threshold is exceeded.
- Save and the check rule begins monitoring immediately.
Tips for Chart-Based Check Rules
- Use the preview chart to verify your query returns expected data before creating the check rule.
- Apply filters first - All filters on the chart are captured in the check rule query.
- Check the time range - The chart's time range doesn't affect the check rule; set evaluation frequency separately.
- Verify aggregations - Ensure
sum byoravg byclauses are appropriate for alerting (they control how many separate alerts are created). - Test with realistic data - Use production or representative data to set accurate thresholds.
After Creation
Once created, the check rule:
- Appears in the Check Rules list.
- Evaluates at the configured frequency.
- Fires when thresholds are exceeded.
- Sends notifications to configured channels.
- Appears in the Failed Checks View when it has fired at least once in the current global timeframe.
You can edit, disable, or delete the check rule at any time from the Check Rules list, provided that you have sufficient permissions.
Further Reading
- Create Check Rules from Scratch - Full control over every configuration setting
- Generate Check Rules with Agent0 - Use AI to generate check rules
- About Query Builder - Learn more about building queries
- Create Check Rules - Complete check rule configuration reference