

You can have a healthy application and still have an unhealthy delivery system.
Builds slow down, tests turn flaky, and a deployment goes out clean, then ten minutes later latency starts climbing. By the time anyone notices, Kubernetes has already replaced the pods that would've shown you why. Whoever picks up the page ends up with metrics in one system, pipeline history in another, and a commit they're not sure is the culprit.
That's why DevOps monitoring tools need to cover more than production metrics. The useful feedback loop runs from CI/CD and deployments through infrastructure and applications to the customer experience and incident response. Tools like GitHub Actions, Jenkins, and Argo CD are sources of that delivery data, not the subject of this guide; what follows covers platforms whose job is monitoring and observability, judged on how well each one connects those lifecycle signals back to production, starting with whether it sees your CI/CD pipeline at all.
What DevOps monitoring actually covers
A useful DevOps monitoring setup needs visibility into three things. You need to see what changes production, what runs production, and whether those changes actually worked.
| Area | What you need visibility into |
|---|---|
| CI and testing | Workflow duration, failed jobs, test failures, pipeline bottlenecks |
| Delivery and change | Deployments, versions, releases, configuration changes |
| Infrastructure | Hosts, cloud services, containers, Kubernetes, networks |
| Applications | Latency, errors, dependencies, logs, metrics, traces |
| User experience | Availability, synthetics, browser and frontend behavior |
| Reliability | Alerts, SLOs, incidents and ownership |
| Monitoring itself | Agents, Collectors, sampling, storage, ingest and cost |
The monitoring platform doesn't have to perform every activity in that lifecycle. It does need enough context to answer useful questions when something goes wrong.
A deployment marker is more valuable when it includes the affected service and version, not just a timestamp. CI telemetry only helps if you can trace a failing workflow back to the software it produces. And runtime telemetry becomes far more actionable once the platform knows which team actually owns the affected service.
What makes DevOps monitoring hard
The first problem is change correlation.
Production systems change constantly. Deployments, feature flags, configuration updates, infrastructure modifications, autoscaling, dependency upgrades, and Kubernetes rollouts can all alter system behavior. A latency graph tells you that something changed. A useful DevOps monitoring platform should help you work out what changed.
The second problem is dynamic infrastructure. Static server inventories have given way to pods, containers, managed cloud services, autoscaling nodes, and short-lived workloads. Monitoring has to discover those resources automatically and preserve enough metadata to understand what they were doing after they disappear.
The third problem, and the one most comparisons skip, is a CI/CD blind spot. A lot of the tools you already have, infrastructure monitors, cloud-native monitors, even some full observability suites, stop at the deployment marker. They can tell you a new version went out and correlate that with a production regression, but they have no visibility into the pipeline that produced it: which job failed, which test flaked, how long the build queue was, or whether the deploy that broke things even passed CI cleanly. That gap is exactly why "DevOps monitoring" and "production observability" aren't quite the same category, and several tools in this list are honest examples of it: strong on infrastructure, silent on delivery.
Then there's telemetry volume. Rich metrics, logs, and traces make debugging easier, but they also create more data to process, retain, and pay for. At scale, you will filter or sample something. What matters is whether the platform lets you cut low-value data without stripping away the context you need mid-incident.
Finally, monitoring has its own operational footprint: Agents consume resources, OpenTelemetry Collectors need sizing, tail sampling can require stateful processing, and self-hosted systems need upgrades and capacity planning. Those realities cut across every tool in this comparison, so instead of treating them as a weakness specific to one vendor, we'll fold them into the evaluation criteria below.
We'll compare each tool on:
- CI/CD depth: whether the tool observes your build and pipeline systems directly, or only the deployment that comes out the other end
- Change and ownership context: whether versions, deployments, repositories, and teams connect to production behavior
- Infrastructure and Kubernetes: cloud resources, containers, orchestration, and ephemeral workloads
- Application visibility: metrics, logs, traces, dependencies, and APM
- Incident workflow: alerting, investigation, and movement between signals
- Monitoring as code: APIs, Terraform, GitOps, or version-controlled configuration
- Telemetry model: proprietary agents, OpenTelemetry, or a mixture
- Cost model: what actually causes spend to increase
At a glance
The numbering below is for navigation, not a ranking. The right choice depends on whether you prioritize CI/CD visibility, infrastructure breadth, OpenTelemetry portability, operational ownership, or cost, and those trade-offs don't collapse into a single ordered list. AWS CloudWatch, Azure Monitor, and GCP Cloud Monitoring are treated as one entry rather than three, since they occupy essentially the same architectural position: the default you already have on that cloud.
| Tool | CI/CD depth | Runtime coverage | Telemetry model | Monitoring as code | Cost driver | Best fit |
|---|---|---|---|---|---|---|
| Prometheus + Grafana OSS | DIY — none packaged | Excellent metrics; add logs/traces separately | Prometheus + OTel-compatible components | Strong | Infrastructure + engineering | If you want control |
| Dash0 | Partial — GitHub Actions (CI) + ArgoCD/FluxCD (GitOps CD); no other CI systems yet | Strong cloud-native full-stack coverage | OpenTelemetry-native | Strong | Telemetry signals | Kubernetes/GitOps shops standardizing on OTel |
| Datadog | Deep — CI, test, deployment, and runtime visibility | Very broad | Datadog agents + OTel | Strong | Multiple product and usage meters | Broad managed monitoring |
| Dynatrace | Structured lifecycle — SDLC events, releases, rollout health | Very broad | OneAgent + OTel | Strong | Capability-specific consumption | Large enterprise estates |
| Coralogix | Partial — CI telemetry from GitHub Actions, Jenkins, and others | Broad | Strong OTel support | Strong | Usage units by volume and priority | If you want CI plus runtime telemetry |
| New Relic | Change-tracking native; pipeline detail is DIY via OTel | Broad | New Relic agents + OTel | Strong | Data ingest + access/compute | Broad SaaS monitoring |
| Grafana Cloud | DIY — via OTel, none packaged | Broad, backed by Mimir/Loki/Tempo/Pyroscope | OTLP accepted, converted to Prometheus/Loki/Tempo formats | API and Terraform support | Per-signal, multiple independent meters | If you're already fluent in PromQL/LogQL/TraceQL |
| Elastic Observability | Partial — CI monitoring + deployment annotations | Broad | Elastic agents + OTel | Strong | Ingest, retention, resources | Search/log-heavy use cases |
| Splunk Observability Cloud | Partial — delivery events and CI/CD-oriented workflows | Broad hybrid coverage | OTel Collector-centric | Strong | Host or usage units | Existing Splunk enterprises |
| Honeycomb | Change-only — deployment and feature-flag markers | Application-first | OpenTelemetry-first | API-oriented | Events + metric data points | Distributed-system debugging |
| AWS CloudWatch / Azure Monitor / GCP Cloud Monitoring | None/thin — only if your CI is also native to that cloud | Very strong for first-party services on that cloud | Cloud-native agents and diagnostic pipelines | Varies by cloud | Multi-axis, per-cloud metering | If you're single-cloud and want the zero-setup default |
| Zabbix | None | Strong traditional infra, network, and Kubernetes via templates | Agent/proxy-based; OTel planned for 8.0 LTS (Sept 2026 roadmap) | Moderate | Infrastructure + engineering | Traditional/hybrid infra estates |
1. Prometheus + Grafana OSS
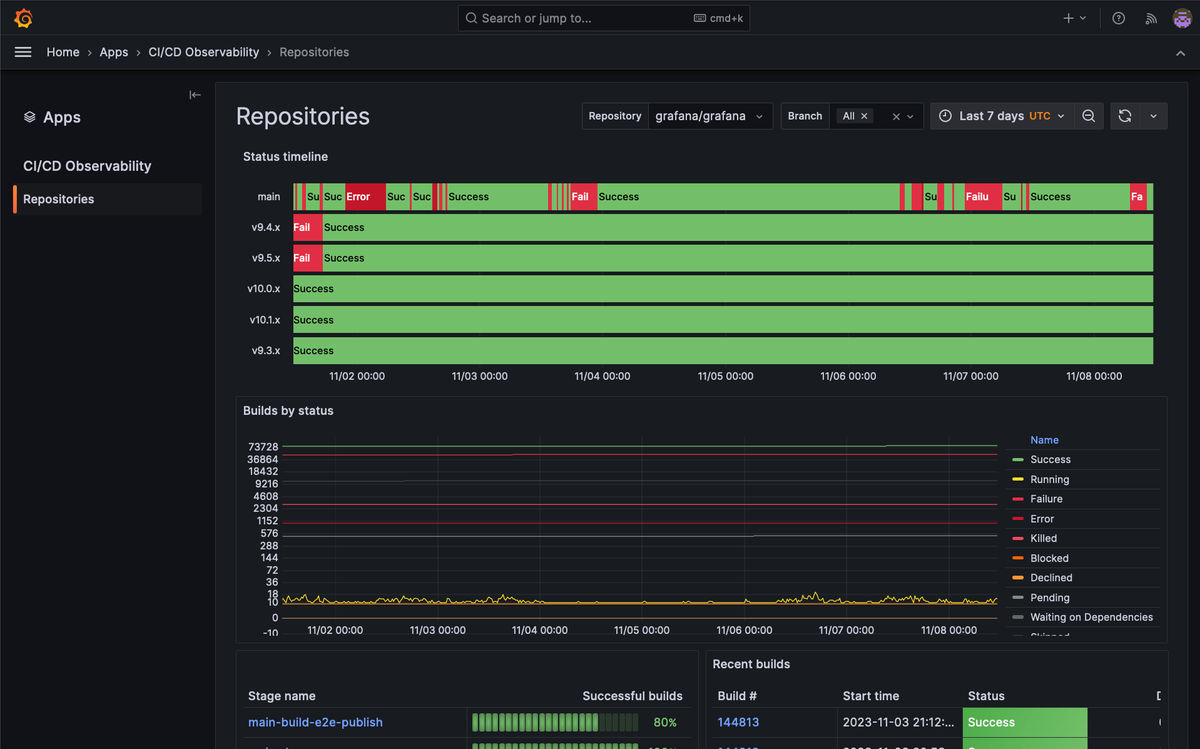
Prometheus and Grafana are the build-your-own baseline in this comparison rather than a directly equivalent SaaS product. Prometheus provides the metrics model, PromQL, service discovery, and alerting foundation; Grafana provides dashboards and a broader investigation interface. You'll commonly add separate logging and tracing backends as your needs grow.
What's good
- Kubernetes is a natural fit: Prometheus service discovery handles dynamic targets well, which is why it's a common cloud-native default.
- PromQL is excellent for operational analysis: Rates, ratios, histograms, SLOs, and alerts all fit naturally into the same query model.
- Monitoring as code comes naturally: Rules and configuration live in files, while Grafana resources can be provisioned through code and Terraform.
- You control the architecture: Storage, retention, alerting, collection, and backend choices are all yours to make, for better or worse.
The catch
The lifecycle model is mostly yours to build. If you want CI failures, deployments, versions, or configuration changes visible beside runtime metrics, you have to ingest and model those events yourself. Nothing here observes your CI/CD pipeline out of the box.
The same applies to multi-signal observability. Prometheus is fundamentally a metrics system. Logs, traces, long-term storage, and centralized querying usually mean adding more components, and more operational ownership.
Pricing model
There is no commercial per-host Prometheus license. What you pay for is the infrastructure underneath the stack, compute, memory, storage, network traffic, additional telemetry backends, plus the engineers operating it.
That can be highly economical when you already have a capable platform team. It's a lot less free when monitoring infrastructure becomes somebody's unplanned second job.
The verdict
Pick Prometheus and Grafana when control and composability are explicit requirements. They remain an excellent cloud-native foundation, but you're choosing to build more of the DevOps monitoring experience yourself.
2. Dash0
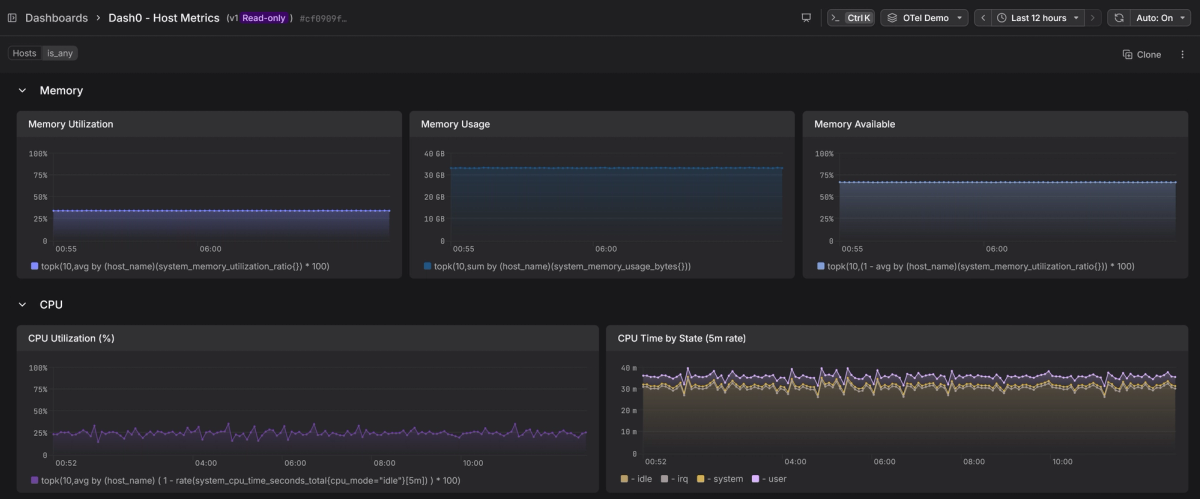
Dash0 is an OpenTelemetry-native observability platform for cloud-native environments. It covers Kubernetes and infrastructure monitoring, metrics, logs, traces, APM, alerting, SLOs, synthetics, and web monitoring.
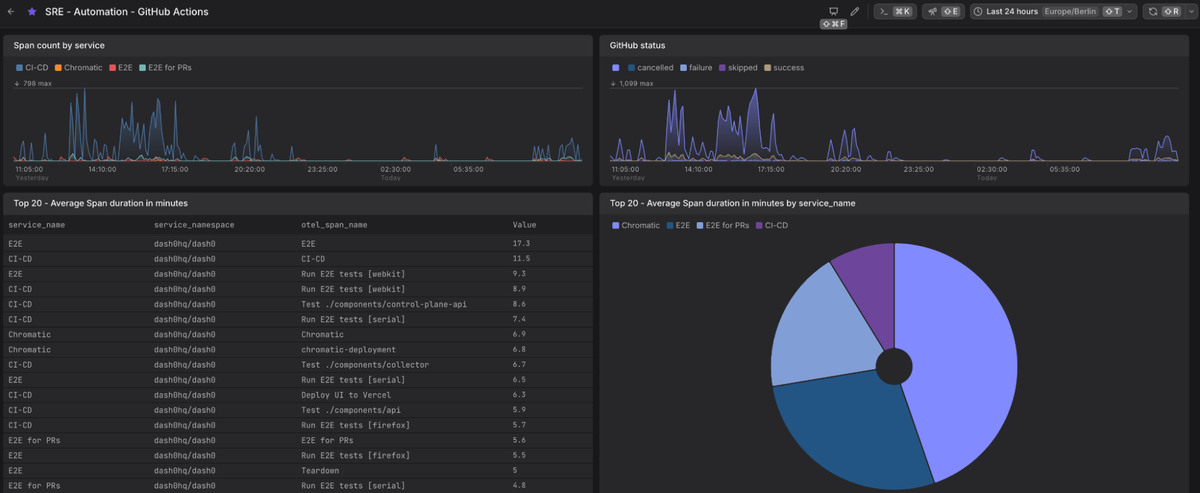
Dash0 can also bring delivery telemetry into the same backend through GitHub Actions instrumentation on the CI side and a packaged ArgoCD integration on the CD side, plus structured deployment events more generally.
What's good
- Dash0 is OTel-native, not just OTLP-compatible: telemetry is stored and queried as the OpenTelemetry data model itself, preserving the model and its attributes through ingestion and querying rather than translating them into a separate proprietary schema the way some platforms do.
- Delivery telemetry can connect to production on both the CI and CD side: GitHub Actions workflows can emit OpenTelemetry traces and metrics, and a packaged ArgoCD integration ships pre-built dashboards and check rules for sync status, deployment health, and out-of-sync or failed-sync applications, so GitOps deployment state is monitored, not just guessed at.
- No proprietary query language required: metrics use standard PromQL, and logs, spans, and web events can be queried with full SQL, joins and aggregations included, so there's no vendor-specific query syntax you have to learn just to use the product.
- Monitoring can be managed as code: Dashboards, checks, notification channels, synthetics, and other resources can be managed through Terraform, the Kubernetes Operator, or CLI.
- Alert routing covers the real incident stack: Notification channels include PagerDuty, Opsgenie, incident.io, Jira Service Management Ops, Slack, Teams, and email, so the paging side of incident response is already wired up, even though Dash0 itself isn't an on-call scheduler.
The catch
Dash0's packaged CI/CD coverage is uneven across the two halves of that term. On the CD side, GitOps deployment monitoring is real: ArgoCD and FluxCD both have packaged integrations. On the CI side, coverage today is specifically GitHub Actions; other CI systems aren't packaged yet. If your build system is Jenkins, GitLab CI, Azure DevOps, or something homegrown, you'd be instrumenting it yourself with OpenTelemetry rather than flipping on a supported connector. That's real work, though OpenTelemetry gives you a known pattern to follow rather than a blank slate.
That's a natural consequence of being a younger platform. Dash0's integration catalog is smaller than more established platforms and still growing, and the gaps are most likely in legacy middleware, network appliances, or setups that fall outside a fairly standard Kubernetes-on-a-major-cloud pattern. Worth checking the integration catalog against your specific stack before assuming coverage exists.
Pricing model
Dash0 pricing is based on telemetry consumption, metric data points, spans, log records, web events, and other published signal units. The core observability model doesn't add separate per-host, per-seat, or base-platform charges.
There's no separate billing dimension based on cardinality itself. Usage is measured through the platform's published telemetry units, not an added tax for how many distinct label combinations a metric has.
Spam filters can reject low-value telemetry before storage and billing, though filtered data is permanently discarded.
The verdict
Dash0 is especially strong for cloud-native teams that want CI and GitOps delivery context feeding into an OpenTelemetry-native production monitoring stack. Its main limitation compared with broader incumbents is integration breadth, particularly outside GitHub Actions and common Kubernetes/GitOps environments.
If you have a mix of delivery systems or a longer tail of legacy infrastructure, check the integration catalog against your specific stack before committing, rather than assuming it's covered.
3. Datadog
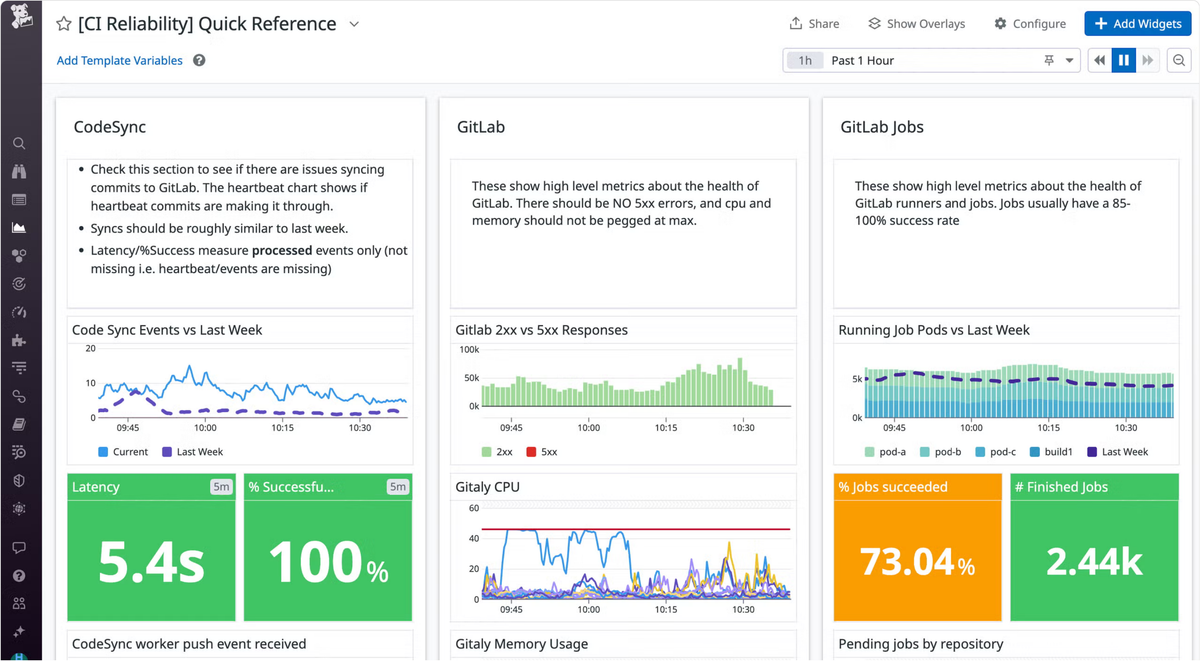
Datadog is broad in a way few tools here can match. Infrastructure, Kubernetes, and APM all live in the same product as logs, network and database monitoring, serverless, RUM, synthetics, CI pipelines, and test visibility.
The advantage isn't the length of the feature list. It comes from years spent connecting those areas through shared service and tagging models.
What's good
- CI/CD is a real monitoring surface: CI Visibility tracks pipeline and job behavior rather than treating software delivery as a deployment annotation.
- Runtime coverage is exceptionally broad: Infrastructure, applications, databases, networks, cloud services, logs, traces, and user experience can all feed into a single investigation.
- Cross-signal workflows are mature: Shared tagging and service context cut down on manual correlation during incidents.
- Monitoring as code is extensive: Datadog's Terraform provider covers monitors, dashboards, and many other platform resources.
- Incident response has a real product behind it, not just routing: Datadog's own Incident Management lets you declare an incident, build a timeline, and run a postmortem inside the platform, on top of paging out to PagerDuty, Opsgenie, or ServiceNow for the actual on-call rotation.
The catch
Breadth introduces complexity, and a lot of it shows up in the custom metrics mechanism. Metrics that aren't emitted by a built-in Datadog integration are generally billed as custom, and custom metric cost is driven by cardinality, the unique combination of a metric name and every tag value attached to it. A handful of tags with a handful of values each multiplies out fast, and it's easy to add that cardinality during a launch without noticing the billing consequence until later, since Datadog's custom-metric rules have enough exceptions and integration-specific handling that the exact line isn't always obvious in advance.
OpenTelemetry improves instrumentation portability, but the operational experience remains Datadog-specific, and OTel-sourced metrics can also count toward custom-metric billing depending on how they're classified. Dashboards, monitors, service models, CI workflows, and investigations all create switching cost on top of that.
Pricing model
Datadog uses different units across its products. Infrastructure, APM, logs, custom metrics, CI visibility, RUM, and other capabilities don't collapse into one simple consumption number, and each one is a separate line to model before you commit, not after.
That works reasonably well when your requirements are stable and understood. It's the products that scale with usage rather than a plan tier, custom metrics, log ingestion and indexing, and RUM sessions chief among them, that are worth stress-testing against a real traffic spike or a Kubernetes autoscaling event before you sign an annual contract, not after the first surprising invoice arrives.
The verdict
Datadog is one of the strongest options when your definition of DevOps monitoring genuinely spans software delivery, infrastructure, applications, and user experience.
The trade-off is commercial complexity. Price the complete monitoring footprint you expect to use, not a single entry-level SKU.
4. Dynatrace
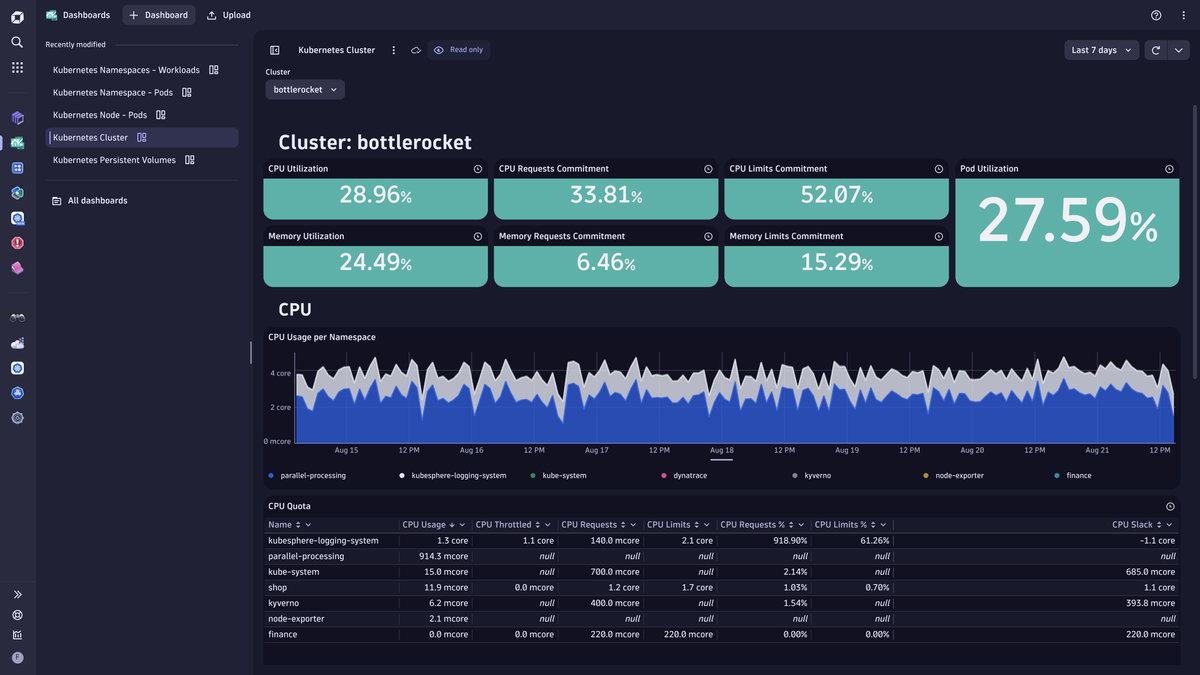
Dynatrace combines deep automatic discovery with an increasingly structured approach to software-delivery monitoring.
Its SDLC event model can represent pipeline activity, deployments, and related delivery events, while release monitoring connects versions and rollout activity to production behavior.
What's good
- Lifecycle events are modeled explicitly: Pipeline and deployment data can become structured operational information rather than arbitrary dashboard annotations.
- Automatic topology is a real strength: Dynatrace pays off most when the service and infrastructure estate is too large to map by hand.
- Release monitoring connects delivery and runtime: Deployed versions, Kubernetes rollout status, and production problems can be investigated together.
- Configuration as code is mature: Terraform and Dynatrace's own configuration tooling support version-controlled observability management.
- Davis AI does real correlation before a human opens a ticket: It groups related problems into a single incident, ranks a probable root cause, and can trigger Workflows, Dynatrace's own automation engine, to page the right team through PagerDuty, Opsgenie, or ServiceNow rather than firing a wall of separate alerts.
The catch
Some of Dynatrace's newer pipeline-specific experiences are still evolving, so buyers should distinguish the mature underlying platform from newer delivery-oriented workflows.
The platform is also highly opinionated. OpenTelemetry keeps application instrumentation more portable, but topology, DQL, automation, dashboards, and operational workflows remain Dynatrace-specific.
For smaller organizations with simpler environments, that depth can be more platform than they actually need.
Pricing model
Dynatrace uses different consumption units across capabilities, including infrastructure, full-stack, Kubernetes, logs, and other platform services.
The benefit is that the model can reflect different workload types more precisely than a single host license would. The downside is that forecasting requires understanding which monitoring mode each workload actually uses.
The verdict
Dynatrace is particularly strong for large or heterogeneous environments where automatic topology and structured delivery context cut real operational complexity, not just paperwork.
5. Coralogix
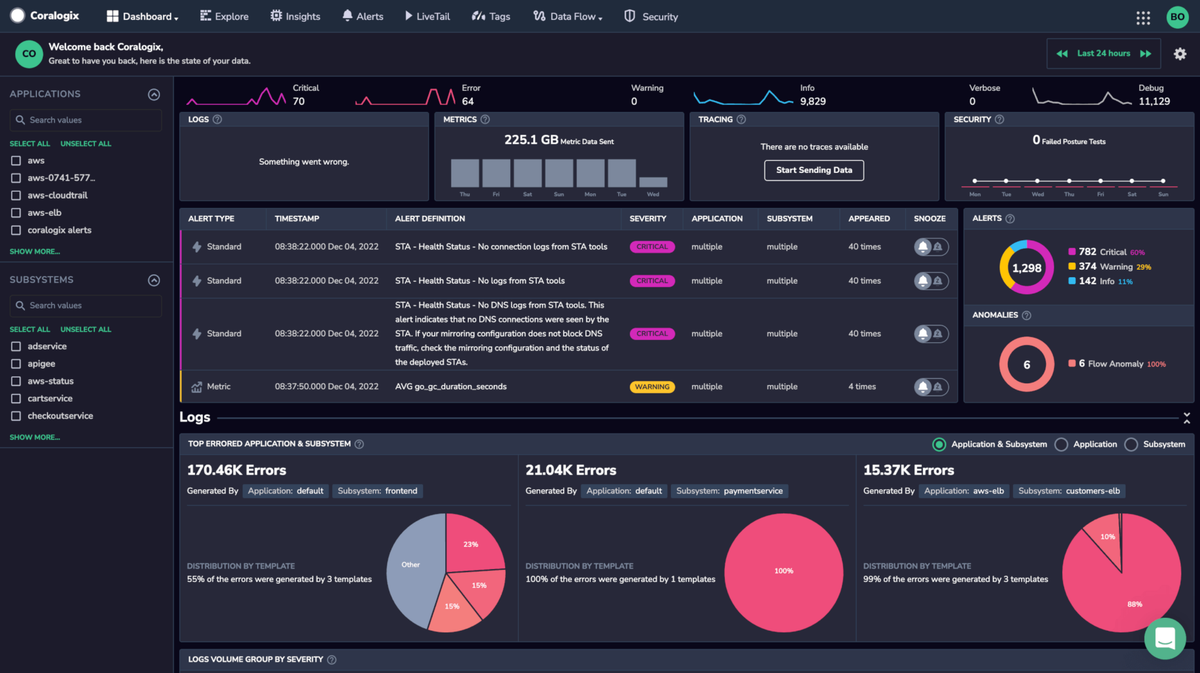
Coralogix is a full observability platform covering logs, metrics, traces, infrastructure monitoring, APM, alerting, and related workflows. Under the hood, its Streama engine runs alerting, anomaly detection, and ML baselining on telemetry as it streams through the pipeline, before any of it is indexed, then writes long-term data out to a customer-owned S3 (or GCS) bucket in Parquet instead of a proprietary index.
It earns a spot here because it has packaged telemetry integrations for CI systems such as GitHub Actions and Jenkins, rather than treating pipelines only as external metadata.
What's good
- Alert evaluation happens in-stream: Streama can evaluate detections as telemetry passes through the pipeline, rather than requiring all data to land in a conventional indexed search tier first.
- The TCO Optimizer gives explicit control over storage and search economics: Policies written in DataPrime's expression language route logs and traces into High (Frequent Search), Medium (Monitoring), Low (Compliance), or Block priorities, so you can keep full-text search on the logs that actually get queried and archive the rest to S3 without deleting it.
- DataPrime queries across signal types without a separate query language per signal: It handles nested JSON and mixed types without a predefined schema, supports joins across logs, metrics, and traces, and can query archived S3 data directly, no rehydration step required.
- Terraform support is substantial: Alerts, dashboards, SLOs, and telemetry policies can be managed as code.
The catch
Coralogix has real gaps outside the telemetry pipeline itself: no built-in on-call scheduling, escalation policies, or phone/SMS alert delivery, so you'll likely pair it with PagerDuty or Opsgenie anyway. DataPrime is also proprietary, which means every saved query, dashboard, and alert you build is written in Coralogix's own syntax, not something portable to another backend.
The TCO Optimizer is also a decision you have to get right upfront, not after the fact. Data doesn't disappear when it's routed to Medium or Low priority, both stay queryable through DataPrime, but it loses the fast, indexed full-text search that High priority gets. A policy that under-prioritizes the wrong log stream can turn a routine mid-incident query into a much slower one, right when speed matters most.
Pricing model
Coralogix bills in consumption units tied to telemetry volume, type, and which TCO priority you route data into, with no separate per-host, per-user, or per-query fees layered on top.
Data volume remains the biggest lever, but it's not the only one: the TCO Optimizer controls the bill by moving data between priorities rather than by deleting it, since even Low-priority data stays queryable through DataPrime, just without the fast, indexed path High priority gets.
The verdict
Coralogix is worth considering when CI telemetry, OpenTelemetry, and broad production observability all matter, especially if you'd rather deal with data-volume economics than host-heavy licensing.
6. New Relic
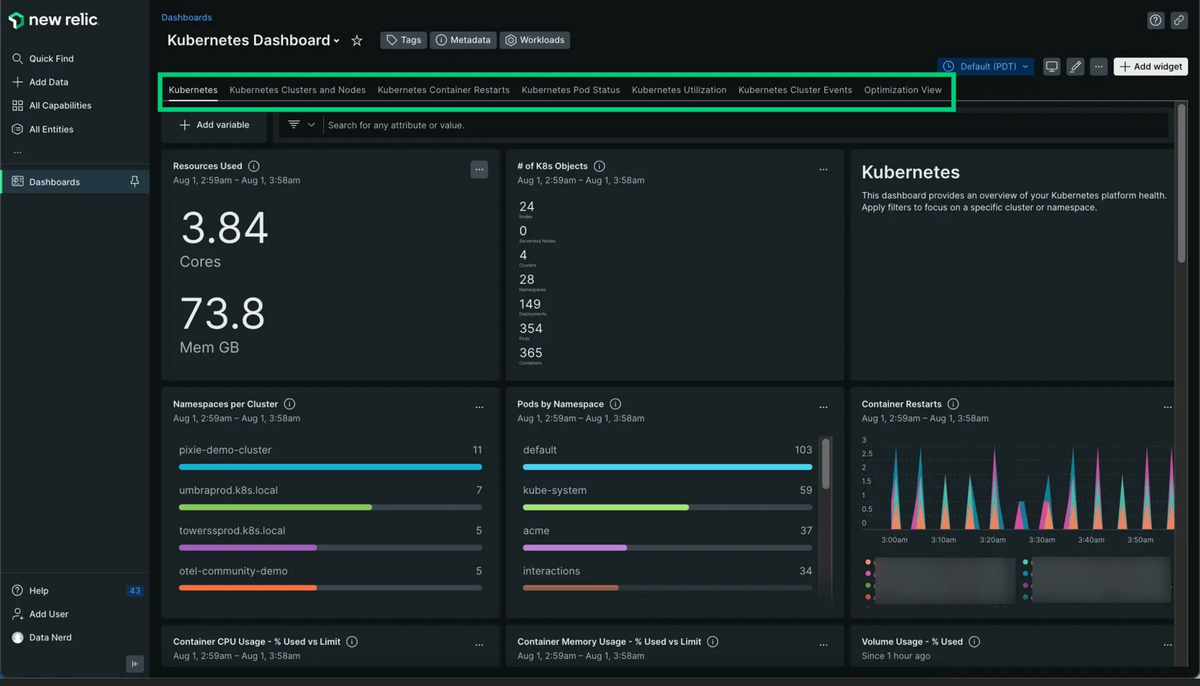
New Relic combines infrastructure monitoring, Kubernetes, APM, logs, browser monitoring, synthetics, and other observability capabilities in a single SaaS platform, with OpenTelemetry supported as an ingestion path alongside its own agents. Everything lands in one database, NRDB, and gets queried through NRQL, a SQL-like language purpose-built for observability data: joining a trace to the infrastructure metrics and log lines from the same time window is one query, not three tools and a manual correlation step.
Its lifecycle story is best understood as change tracking rather than deep pipeline observability. Deployments, feature flags, configuration changes, and other operational events can be associated with monitored entities and compared with runtime behavior.
What's good
- NRQL is a genuine cross-signal strength: Metrics, logs, traces, and events all sit in the same data model, so an engineer can write one query that spans all four instead of switching tools and stitching results together by hand.
- Change tracking is flexible: The platform can represent more than deployment events, which matters when configuration or feature changes are what actually caused the incident.
- Production monitoring is broad: Infrastructure, Kubernetes, APM, logs, synthetics, and frontend monitoring all live in the same environment.
- The free tier is genuinely usable, not a trial: 100GB of ingest per month and one full platform user, indefinitely, at no cost, which is enough for real small-scale production use, not just a proof of concept.
The catch
NRQL is also the lock-in mechanism: the queries, dashboards, and alerts you build don't move to another backend, and it only superficially resembles SQL.
New Relic's pricing combines telemetry consumption with user and access dimensions, having shifted between per-user licensing and consumption-based models over time, so forecasting requires modeling both data growth and headcount growth rather than assuming one variable determines the bill.
New Relic surfaces deployment and change events well out of the box, but seeing why a build took longer or which test flaked means wiring up OpenTelemetry for your CI system yourself, Jenkins, GitLab, GitHub Actions, whichever you run, rather than getting it from a packaged CI product the way some competitors ship one.
Pricing model
New Relic's commercial model centers on telemetry ingest, user access, and some advanced compute, with a genuinely free tier (100GB, one full user) below that. Beyond it, the standard path bills ingest per GB and users per seat, scaling independently, so it's worth modeling headcount and data growth together, not just one or the other. Eligible Pro and Enterprise customers can also opt into a compute-based model (currently in preview) that drops per-user licensing entirely in favor of paying for platform activity instead.
The verdict
New Relic is a good fit when you want one query language across metrics, logs, and traces, and a free tier that's actually usable for small production workloads, without making CI/CD itself the center of the platform. Model your expected user count and data growth against the pricing page before you scale past the free tier, since that's where the model gets more complicated.
7. Grafana Cloud
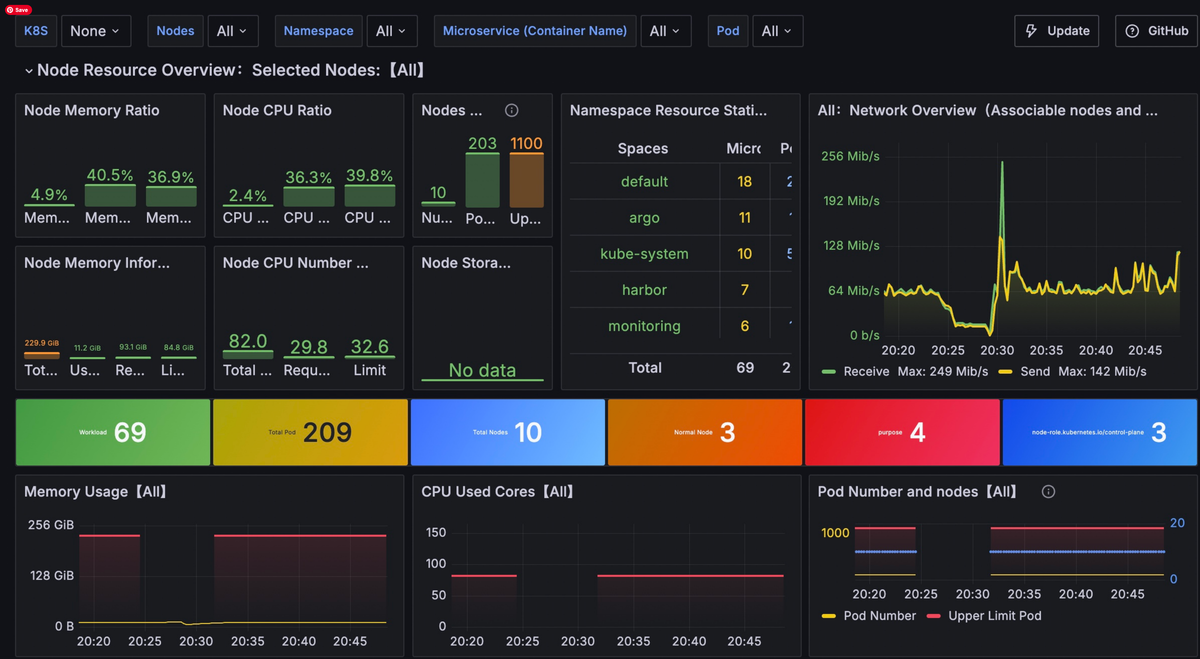
Grafana Cloud is Grafana Labs' hosted version of the open-source LGTM stack. Loki handles logs, Grafana does dashboards, Tempo handles traces, and Mimir handles metrics, and Pyroscope, IRM, and k6 round it out with continuous profiling, incident response and on-call, and load testing. It's the managed alternative to the do-it-yourself option in entry #1, if you want the same open-source query surface without running Mimir, Loki, and Tempo yourself.
What's good
- The core telemetry stack remains familiar: Grafana Cloud builds on Mimir, Loki, Tempo, and Pyroscope, so PromQL, LogQL, and TraceQL skills carry over directly. That gives you a more credible self-hosted migration path than a fully proprietary backend, even if moving the dashboards, IRM setup, and operational practices back to open source isn't automatic.
- Kubernetes Monitoring is a curated, purpose-built experience: Instead of a generic infrastructure dashboard, it ships pre-built cluster, node, and pod health views, billed by host and container hours on newer plans (some existing customers remain on older usage-based models).
- IRM and k6 close a real gap: Incident response, on-call, and load testing live in the same product as the telemetry, which most tools on this list punt to a separate vendor entirely.
- OTLP ingestion spans the whole stack: Metrics, logs, traces, and profiles can all come in over OTLP, so you're not locked into a Grafana-specific agent, though it's converted on the way in to Mimir, Loki, and Tempo's own formats rather than stored as OTel throughout.
The catch
Cost is genuinely hard to predict because each backend bills on its own independent meter. Mimir counts active series, Loki, Tempo, and Pyroscope count gigabytes, Kubernetes Monitoring counts host and container hours on newer plans, and k6 and IRM each have their own meter on top of that. Kubernetes environments in particular can generate large active-series counts, especially when high-cardinality labels survive into metrics, so what reads as one product on a sales page is really multiple independently metered products on the actual invoice. Cardinality management is an ongoing job, not a one-time setup step: labels like pod name or user ID need to be dropped or pre-aggregated before they hit Mimir, or both the bill and query latency suffer.
There's also no packaged CI/CD telemetry story. Grafana Cloud is a genuinely good place to send OpenTelemetry data once it exists, but nothing ships out of the box that instruments a pipeline the way some competitors' CI integrations do; that part is yours to build with the same OTel Collector you'd use for anything else.
Pricing model
Billing is usage-based across independent meters, per-series for metrics, per-gigabyte for logs/traces/profiles, per-host-hour for Kubernetes Monitoring, and separate meters again for k6 and IRM, tracking the natural units of the underlying open-source components. The trade-off is the same one from the catch above: the total bill is the sum of several line items, not one number to forecast against.
The verdict
Grafana Cloud fits you if you already think in PromQL, LogQL, and TraceQL and want someone else operating Mimir, Loki, and Tempo at scale, especially if having on-call and load testing in the same place is worth something. It's a weaker fit if a single packaged CI/CD story out of the box matters, since that part is still yours to build with the same OTel Collector you'd use for any DIY approach.
8. Elastic Observability
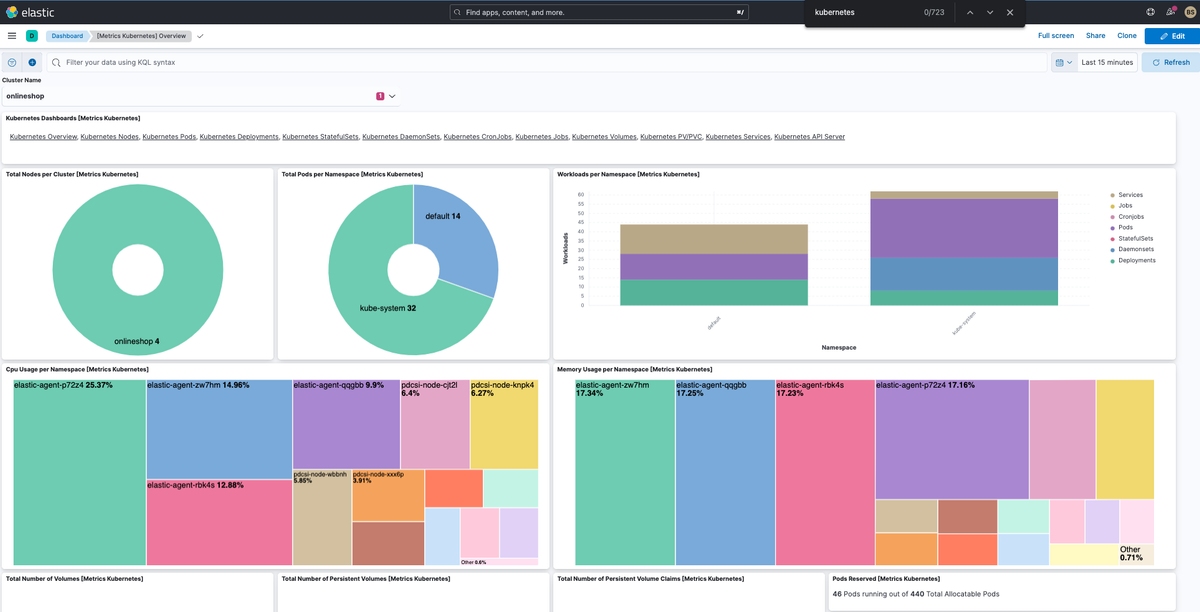
Elastic Observability combines logs, infrastructure metrics, APM, traces, synthetics, profiling, and related monitoring around the Elastic data platform.
Its traditional strength remains search, but the DevOps story also includes CI/CD monitoring and deployment annotations that connect releases to application behavior.
What's good
- ES|QL is one query language across signals, not three: You can filter, aggregate, and join logs, metrics, and traces in the same syntax inside Kibana, instead of switching between a metrics query language and a separate log search DSL depending on which signal you're staring at.
- Universal Profiling doesn't require instrumenting anything: It uses eBPF for continuous CPU profiling via stack sampling across every process on a host, including code you never touched, and correlates that data with APM traces so you can trace a CPU spike back toward the function responsible without redeploying anything.
- Search remains a real differentiator, not just a legacy strength: Elastic excels when an investigation means slicing a large, messy dataset in a way you didn't plan for in advance, which is where a purpose-built search engine still beats a metrics-first backend.
- Deployment models are genuinely flexible: Self-managed, Elastic Cloud, and serverless options let you choose how much backend ownership you want, from full control to none.
The catch
Universal Profiling has a real, budgetable storage cost: at its default 20 Hz sampling rate, expect roughly 40 MB of Elasticsearch storage per profiled CPU core per day, which adds up across a large fleet, and running it outside Elastic Cloud requires an Enterprise license.
The deployment models also behave very differently, operationally and commercially. "Elastic Observability" can mean running substantial infrastructure yourself or consuming a mostly managed serverless service, and it's worth knowing which one you're actually pricing before you compare it to anyone else on this list.
High-cardinality fields are also an easy way to blow up an Elastic bill by accident, and span attributes and log fields don't behave identically here, so it's worth checking each. Adding something like a raw user ID as an indexed field is a common mistake that spikes index size and query cost; the real fix is avoiding indexed lookups on fields that don't need them, choosing appropriate field mappings, and aggregating or reducing dimensionality before ingestion, not hashing the values, which preserves the same number of distinct entries under a different name.
Kibana's alerting connectors reach the usual incident tools, PagerDuty, Opsgenie, ServiceNow, Slack, and email among them, but that's routing, not on-call scheduling. Rotation and escalation policies still live in whichever of those tools receives the alert.
Pricing model
Elastic Observability Serverless meters ingest, retention, and egress, while hosted deployments are shaped more heavily by provisioned resources.
If you're log-heavy, that creates a direct line between telemetry verbosity, retention policy, and spend.
The verdict
Elastic is strongest when operational search and logs are central to how your engineers investigate production, with application and infrastructure monitoring built around that foundation.
9. Splunk Observability Cloud
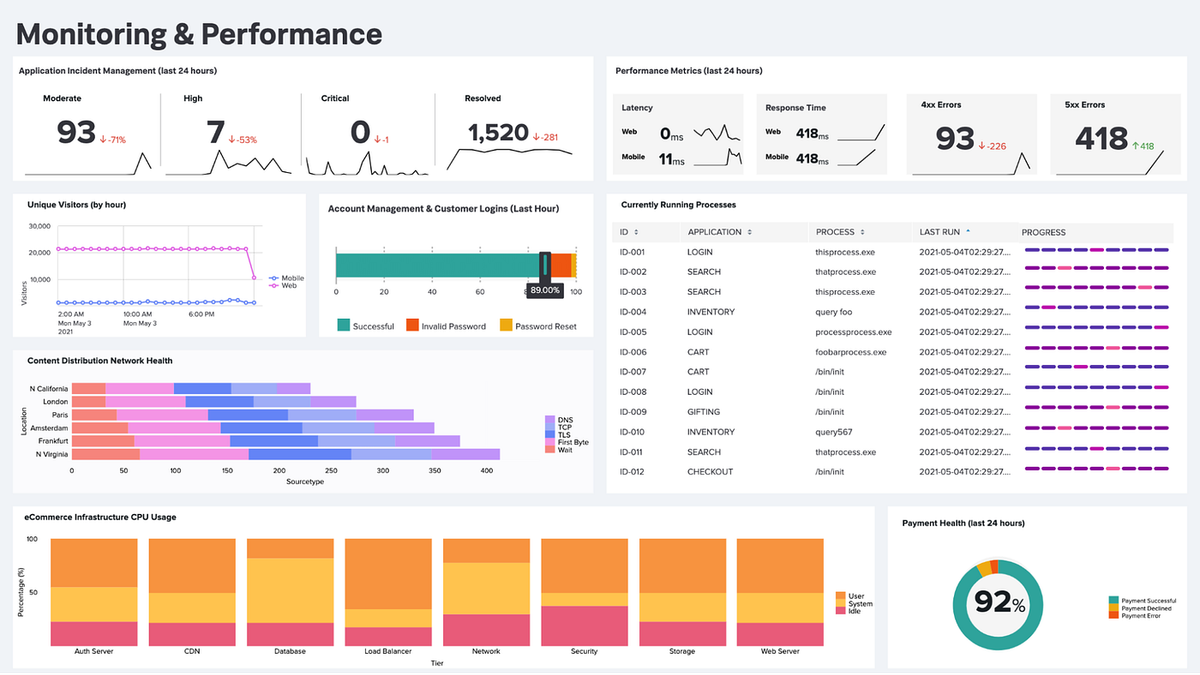
Splunk Observability Cloud covers infrastructure monitoring, APM, RUM, synthetics, databases, and related operational workflows.
Its modern collection model relies heavily on the Splunk Distribution of the OpenTelemetry Collector, which makes OTel a practical part of the deployment architecture rather than an edge integration bolted on for compatibility.
What's good
- Splunk APM is designed around full-fidelity tracing: its NoSample model avoids requiring backend sampling as the default path, so a failure that would otherwise get dropped by a sampling decision is still there when you go looking for it, as long as you haven't sampled it away upstream yourself.
- SignalFlow is a real streaming query language, not point-and-click alerting: it underpins Splunk Infrastructure Monitoring's charts and detectors, with its own syntax for windowing and aggregating time series in real time.
- AlwaysOn Profiling is wired directly into APM, not bolted on: continuous CPU and memory profiling is correlated to spans automatically, so you can pull up a flame graph for the request that triggered your investigation without switching to a separate profiler.
- Kubernetes gets dedicated navigators, not a generic dashboard: clusters, nodes, pods, and workloads each get their own view with matching dashboards and detectors.
- Splunk actually owns an on-call product, not just an integration: Splunk On-Call (formerly VictorOps) has real rotation scheduling and escalation policies, something most tools here route out to a third party for.
The catch
Splunk is also mid-migration on its own Kubernetes tooling: the classic navigator is being phased out in favor of a new "Kubernetes entities" experience, and depending on your OTel Collector version, you may need to opt in to get full support.
The broader Splunk portfolio also has several commercial models, so keep Observability Cloud pricing separate from Splunk Enterprise or Cloud Platform in your head, and note that Splunk On-Call is its own separate license too, not something Observability Cloud includes by default. Its lifecycle model is also less structured than some competitors' dedicated SDLC approaches, so delivery context can be integrated, but more of the structure is left for the customer to build.
Pricing model
Splunk meters its capabilities separately rather than under one umbrella. Infrastructure Monitoring is priced per host, APM is a distinct per-host meter layered on top (or bundled with infrastructure at a different rate), and RUM is priced per session volume instead of per host at all.
That granularity fits hybrid estates where different workloads genuinely need different products, but it also means the bill is really the sum of several meters, not one number, and forecasting requires knowing which of your services actually touch which product before you commit.
The verdict
Splunk Observability Cloud makes the most sense for enterprises that need broad hybrid monitoring, or that already have substantial Splunk investment to build on.
10. Honeycomb
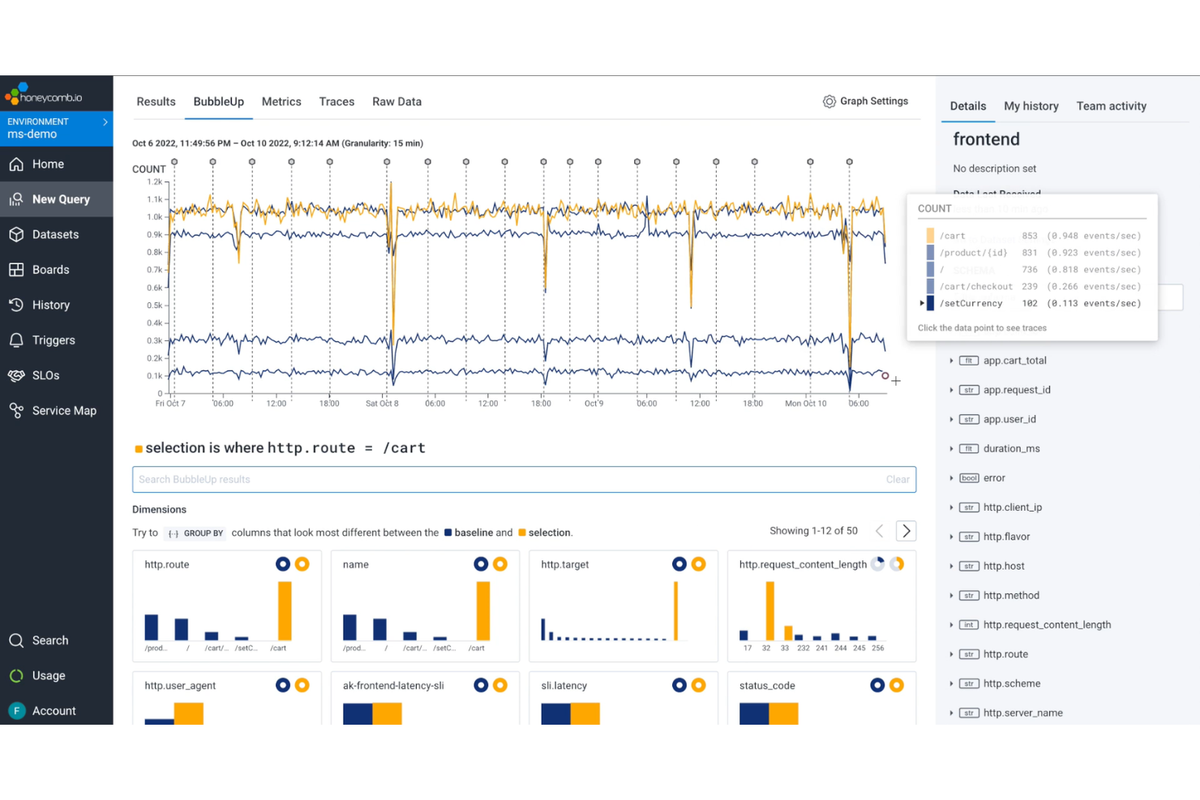
Honeycomb is the most application-debugging-focused platform in this comparison, and it's OpenTelemetry-first: rich spans and attributes map directly onto its event model without much translation. Its infrastructure story is newer and growing, though: Honeycomb Metrics, native time-series metric storage that sits alongside the event-based model, reached general availability in March 2026.
Its model favors richly structured events, distributed traces, and high-cardinality investigation. Where a lot of monitoring tools stop at "which resource is unhealthy," Honeycomb is built to answer a harder question: what's different about the subset of requests that are failing?
What's good
- BubbleUp turns "something's wrong" into "here's what's different": Point it at an anomaly and it automatically compares the abnormal traffic against normal traffic and surfaces the fields most correlated with the problem, a specific endpoint, region, user segment, or deployment, instead of leaving you to guess which dimension to slice by.
- SLOs come with burn-rate alerts, not just thresholds: You define an error budget and get alerted based on how fast it's depleting, which is more actionable mid-incident than a static threshold that either has or hasn't been crossed.
- Canvas makes investigation a shared, live surface: Multiple engineers can explore the same query, follow each other's reasoning, and work an incident together in real time instead of screen-sharing a single person's terminal.
- High-cardinality investigation is a core strength: Engineers can explore dimensions such as customer, version, region, endpoint, or feature flag without anticipating every useful query in advance.
The catch
Honeycomb Metrics is genuinely new, general availability landed in March 2026, so its infrastructure and Kubernetes coverage doesn't have years of hardening behind it yet. If you have substantial host, network, or traditional infrastructure monitoring needs, you may still want to pair it with a more infrastructure-focused platform, or the native cloud option, rather than replacing that layer outright.
Its CI lifecycle coverage is also thin: change markers can show a deployment or feature flag alongside application behavior, but there's no packaged CI pipeline integration. Alerts and SLO burn notifications route out to Slack or PagerDuty, but on-call scheduling itself is somebody else's product.
Pricing model
Honeycomb primarily charges by events and metric data points. In tracing, spans count as events, so trace depth and traffic directly affect usage, and the jump from the free tier's 20 million events per month to the first paid tier is a real step, not a gentle ramp.
The model keeps user access comparatively unconstrained while making telemetry volume the main commercial variable. Refinery, Honeycomb's sampling proxy, is the main cost-control lever: it lets you keep unusual or high-value traces at full fidelity while sampling down the routine, repetitive traffic that would otherwise dominate the bill.
The verdict
Honeycomb is a strong choice when the hardest operational problems involve understanding unusual behavior in distributed applications, rather than monitoring the broadest possible enterprise estate. Its infrastructure story is real but young, so pair it with a dedicated infra monitor if hosts and containers are a major part of what you need visibility into.
11. AWS CloudWatch, Azure Monitor & GCP Cloud Monitoring
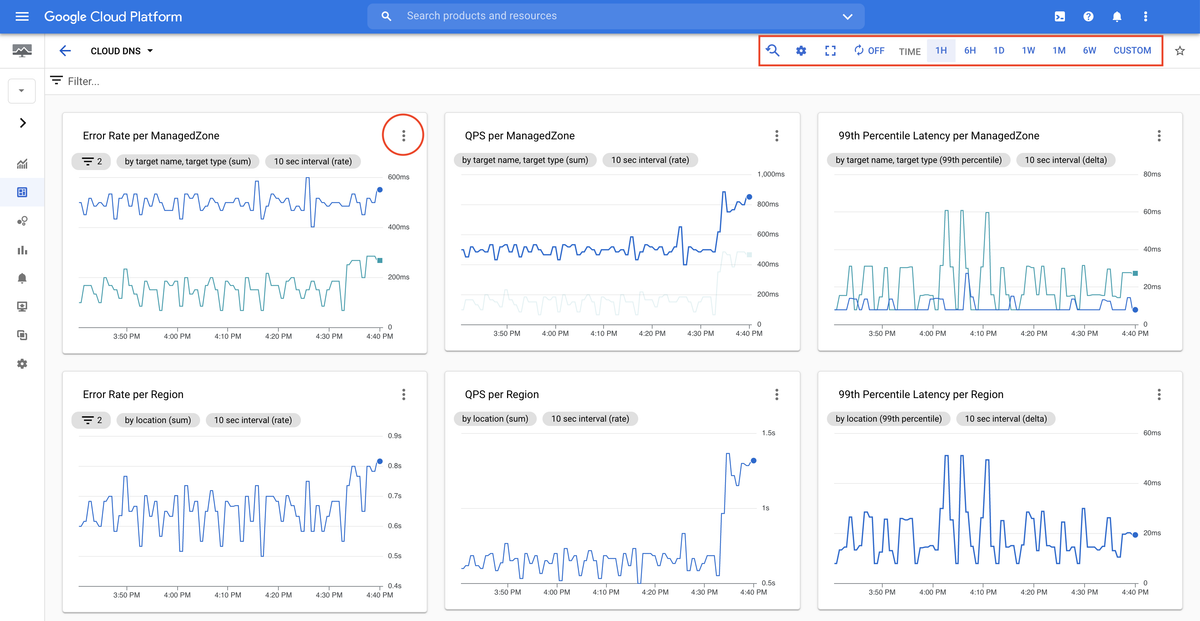
These three are grouped because they play the same role on their respective clouds: the monitoring you already have the moment you provision anything, with zero setup for first-party services. CloudWatch collects metrics and logs from AWS services automatically and correlates with X-Ray traces; Azure Monitor pulls platform logs through diagnostic settings and layers Application Insights on top for app-level telemetry, queried in Kusto Query Language; GCP's Cloud Monitoring pairs with Cloud Logging and Cloud Trace across GCP services, the modern name for what used to be Stackdriver.
What's good
- Zero-instrumentation default coverage: First-party managed services generally expose core platform metrics automatically the moment you turn them on, no agent to install for most of them. Logs and richer telemetry more often need explicit configuration, like Azure diagnostic settings, but the baseline is still real value if you don't want to own a separate monitoring stack for infrastructure you didn't build.
- Native correlation with the cloud's own audit trail: CloudTrail, Azure Activity Logs, and GCP Audit Logs are all natively integrated with their respective ecosystems, so security and ops don't need a separate tool for at least the audit layer, though wiring them into the same views as everything else can still take some configuration.
- Each has a genuinely capable query language for its own data: CloudWatch Logs Insights, Azure Monitor's KQL, and GCP's Cloud Logging query language all support real filtering and aggregation without exporting anywhere else first.
- Native CI/CD services feed the same tool, if you're using them: CodePipeline and CodeBuild metrics land in CloudWatch automatically, and Azure Pipelines can emit into Application Insights, so there's at least a thin, real thread from delivery to runtime if your CI is also native to that cloud.
The catch
All three can ingest some telemetry from outside their native cloud, CloudWatch's agent supports hybrid and on-prem servers, for instance, but their strongest integrations, resource models, and investigation workflows stay centered on their own ecosystem. A genuinely multi-cloud estate leaves you maintaining multiple monitoring models, query languages, and billing systems rather than one that's neutral across all three. Real CI/CD depth is thin and conditional too: it only exists if your build system is also native to that cloud, so GitHub Actions or Jenkins builds deploying onto AWS, Azure, or GCP hit the same blind spot every pure infrastructure monitor here has.
The query languages are also each their own dialect that doesn't transfer between clouds, so if you support more than one cloud, you're maintaining three syntaxes and three cost models, not one skill that scales. Their core monitoring services also focus on detection and notification rather than a full on-call scheduling product; alarms and notification channels forward to a third party, typically PagerDuty or Opsgenie, for the human-facing part of incident response.
Pricing model
Each cloud bills on its own multi-axis meter, metrics, log ingestion and storage, alarm evaluations, dashboards, and API calls, priced per region. At small, single-cloud scale that's usually cheaper than a third-party platform for first-party telemetry, but real cost control means understanding each cloud's specific metering, and running all three doesn't make that simpler.
The verdict
The right choice if you're single-cloud, want the zero-setup default, and your CI/CD and cross-service correlation needs are modest. The wrong choice the moment you're meaningfully multi-cloud or need CI/CD-to-production correlation, since none of the three were built to answer "what changed" the way a dedicated DevOps monitoring platform is.
12. Zabbix
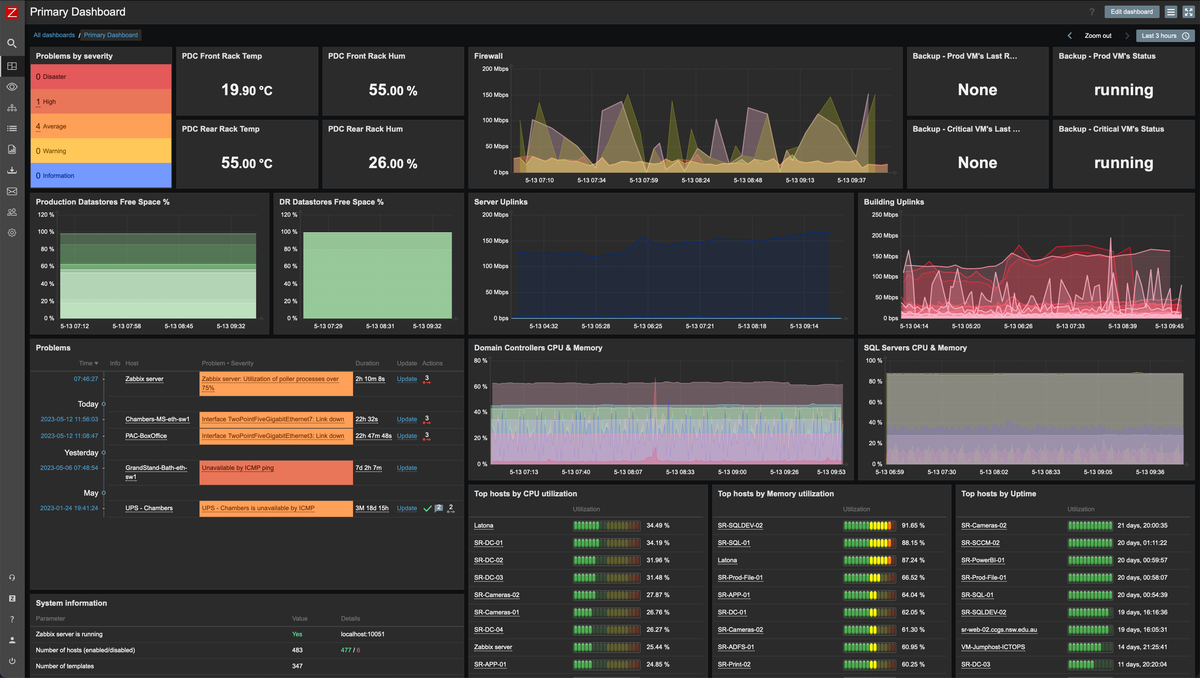
Zabbix is a long-running open-source monitoring platform under active development, built around a central Zabbix Server, optional distributed proxies for scale, and lightweight agents on monitored hosts. You'll often reach for it when the environment is heavier on traditional infrastructure, physical servers, network gear, hybrid on-prem, than cloud-native microservices, though it has real Kubernetes support too.
What's good
- Auto-discovery does the tedious part for you: Zabbix's low-level discovery (LLD) can find Kubernetes nodes, pods, and cluster components via the API and automatically create monitored hosts from prototypes, so you're not hand-registering every ephemeral resource.
- Proxy architecture is built for scale and HA: Zabbix 7.0 added proxy high availability and load balancing, plus asynchronous pollers that meaningfully speed up agent, SNMP, and HTTP checks at scale.
- Synthetic/web monitoring is built in, not bolted on: Zabbix supports multi-step HTTP web scenarios and separately offers Browser items for actual browser-based checks, both without requiring a separate monitoring product.
- It's a genuine all-in-one: Collection, storage, visualization, and alerting live in one product with declarative templates, which keeps the operational surface smaller than assembling five components yourself.
The catch
Zabbix has no CI/CD story at all today. It answers "is the infrastructure healthy" very well; "what changed in the last deploy" isn't a question it's built to answer, and there's no deployment marker or pipeline telemetry concept anywhere in the product.
It's also behind on OpenTelemetry. The current 7.x LTS has no native OTLP ingestion. OpenTelemetry data collection and a dedicated view for trace data are both listed as in development for the 8.0 LTS release, which Zabbix's roadmap currently targets for September 2026. Roadmaps shift, so it's worth checking that page directly rather than treating the date as fixed. Until it ships, getting OTel-instrumented application traces or logs into Zabbix means routing them through a community plugin or a separate OTel Collector export path, not a first-party feature.
On-call is also a gap. Zabbix Actions support multi-step escalation, notify this person, then that group, after a delay, but there's no rotation scheduling or shift calendar built in, so you'll still forward Zabbix alerts to PagerDuty or Opsgenie via webhook for the actual on-call piece.
Pricing model
Zabbix itself is free and open source under AGPLv3, so the cost structure is the familiar open-source shape, infrastructure, storage, and the engineering time to run proxies and maintain templates. Zabbix SIA sells optional paid support contracts and a hosted Zabbix Cloud option if you want the software without owning the servers it runs on.
The verdict
Zabbix is a strong pick if your estate is genuinely more "traditional infrastructure" than cloud-native, and you want one mature product instead of assembling separate logging and tracing backends. It's a weak pick if connecting CI/CD activity to production is the actual pain point, since that isn't something Zabbix does yet.
Final thoughts
Choosing among these mostly comes down to how far upstream a tool actually sees. A platform that only picks up a deployment marker can tell you production changed; one with real CI/CD visibility can tell you why the pipeline that shipped it was already unhealthy. That gap, more than feature count or dashboard polish, separates a genuinely useful DevOps monitoring setup from a production monitor with a deployment annotation bolted on.
Whatever you pick, it should help you answer three questions fast: what changed, what did it affect, and what should you do next. The first one is still the hardest for most tools here to answer above the deployment marker.
Dash0 is a great fit if you want CI and GitOps delivery context feeding into an OpenTelemetry-native production stack, without separate charges for hosts, seats, or cardinality. Give it a try today with 14 days of unlimited access.

