
Distributed tracing has quietly moved from a nice-to-have debugging aid to a foundational part of observing modern distributed systems. As architectures have shifted toward microservices, event-driven workflows, and managed infrastructure, understanding a single request now means following it across dozens of boundaries. Logs alone cannot provide that visibility, and metrics only tell part of the story. Traces are what connect intent to execution.
In 2026, a good tracing tool is not just about drawing pretty waterfall diagrams. It’s about fast root cause analysis, cost control, and knowing which parts of your system actually matter under real traffic. Teams expect traces to correlate cleanly with logs and metrics, work across clouds and regions, and handle both synchronous requests and asynchronous workflows without manual instrumentation.
The tooling landscape has matured alongside these expectations, but not in a uniform way. While OpenTelemetry has emerged as the common instrumentation layer, tracing backends still differ widely in how they store, query, and present trace data.
The real differences now show up in scalability, usability, pricing models, and how well each tool supports day-to-day debugging workflows. Some tools are built for high-cardinality, high-volume exploration, while others optimize for automation, cost efficiency, or tight integration with logs and metrics.
This list compares the best distributed tracing tools in 2026, with an emphasis on production readiness. Each entry looks at where the tool shines, where it falls short, and what kinds of teams benefit most from adopting it.
Distributed tracing and APM tools comparison for engineers
| Tool | Tracing philosophy | OpenTelemetry support | Best at | Trade-offs |
|---|---|---|---|---|
| Dash0 | Tracing-first investigation | OpenTelemetry-native | High-cardinality, trace-led debugging with full context | Requires committing to OpenTelemetry |
| Jaeger | Classic trace visualization | OpenTelemetry-compatible | Simple, self-hosted tracing backends | Manual analysis, limited correlation |
| Grafana Tempo | Trace storage backend | OpenTelemetry-compatible | Low-cost, high-scale trace retention | Weak trace exploration |
| Honeycomb | Analytical tracing | Strong OpenTelemetry support | Finding patterns across many traces | Requires event-based mindset |
| Datadog APM | APM-integrated tracing | Vendor-specific with OTel support | Fast, polished incident workflows | Cost and lock-in |
| Dynatrace APM | Automated APM tracing | Limited OpenTelemetry workflows | Hands-off root cause detection | Opaque data model |
| New Relic APM | APM-oriented tracing | Vendor-specific with OTel support | Deployment-centric debugging | Limited trace exploration |
| SigNoz | Open-source OTel platform | OpenTelemetry-native | Self-hosted modern tracing | Operational overhead |
| IBM Instana APM | Automated enterprise tracing | Partial OpenTelemetry support | Large, dynamic enterprise estates | Proprietary agents |
| AWS X-Ray | Cloud-native tracing | Partial OpenTelemetry support | AWS-native visibility | AWS lock-in, shallow analysis |
| Google Cloud Trace | Cloud-native tracing | OpenTelemetry-compatible | GCP-native workloads | Limited depth |
| Zipkin | Minimal tracing backend | OpenTelemetry-compatible | Learning and small systems | Not production-grade at scale |
In the sections below, we’ll break down each tool in more detail to see who they’re best for.
1. Dash0
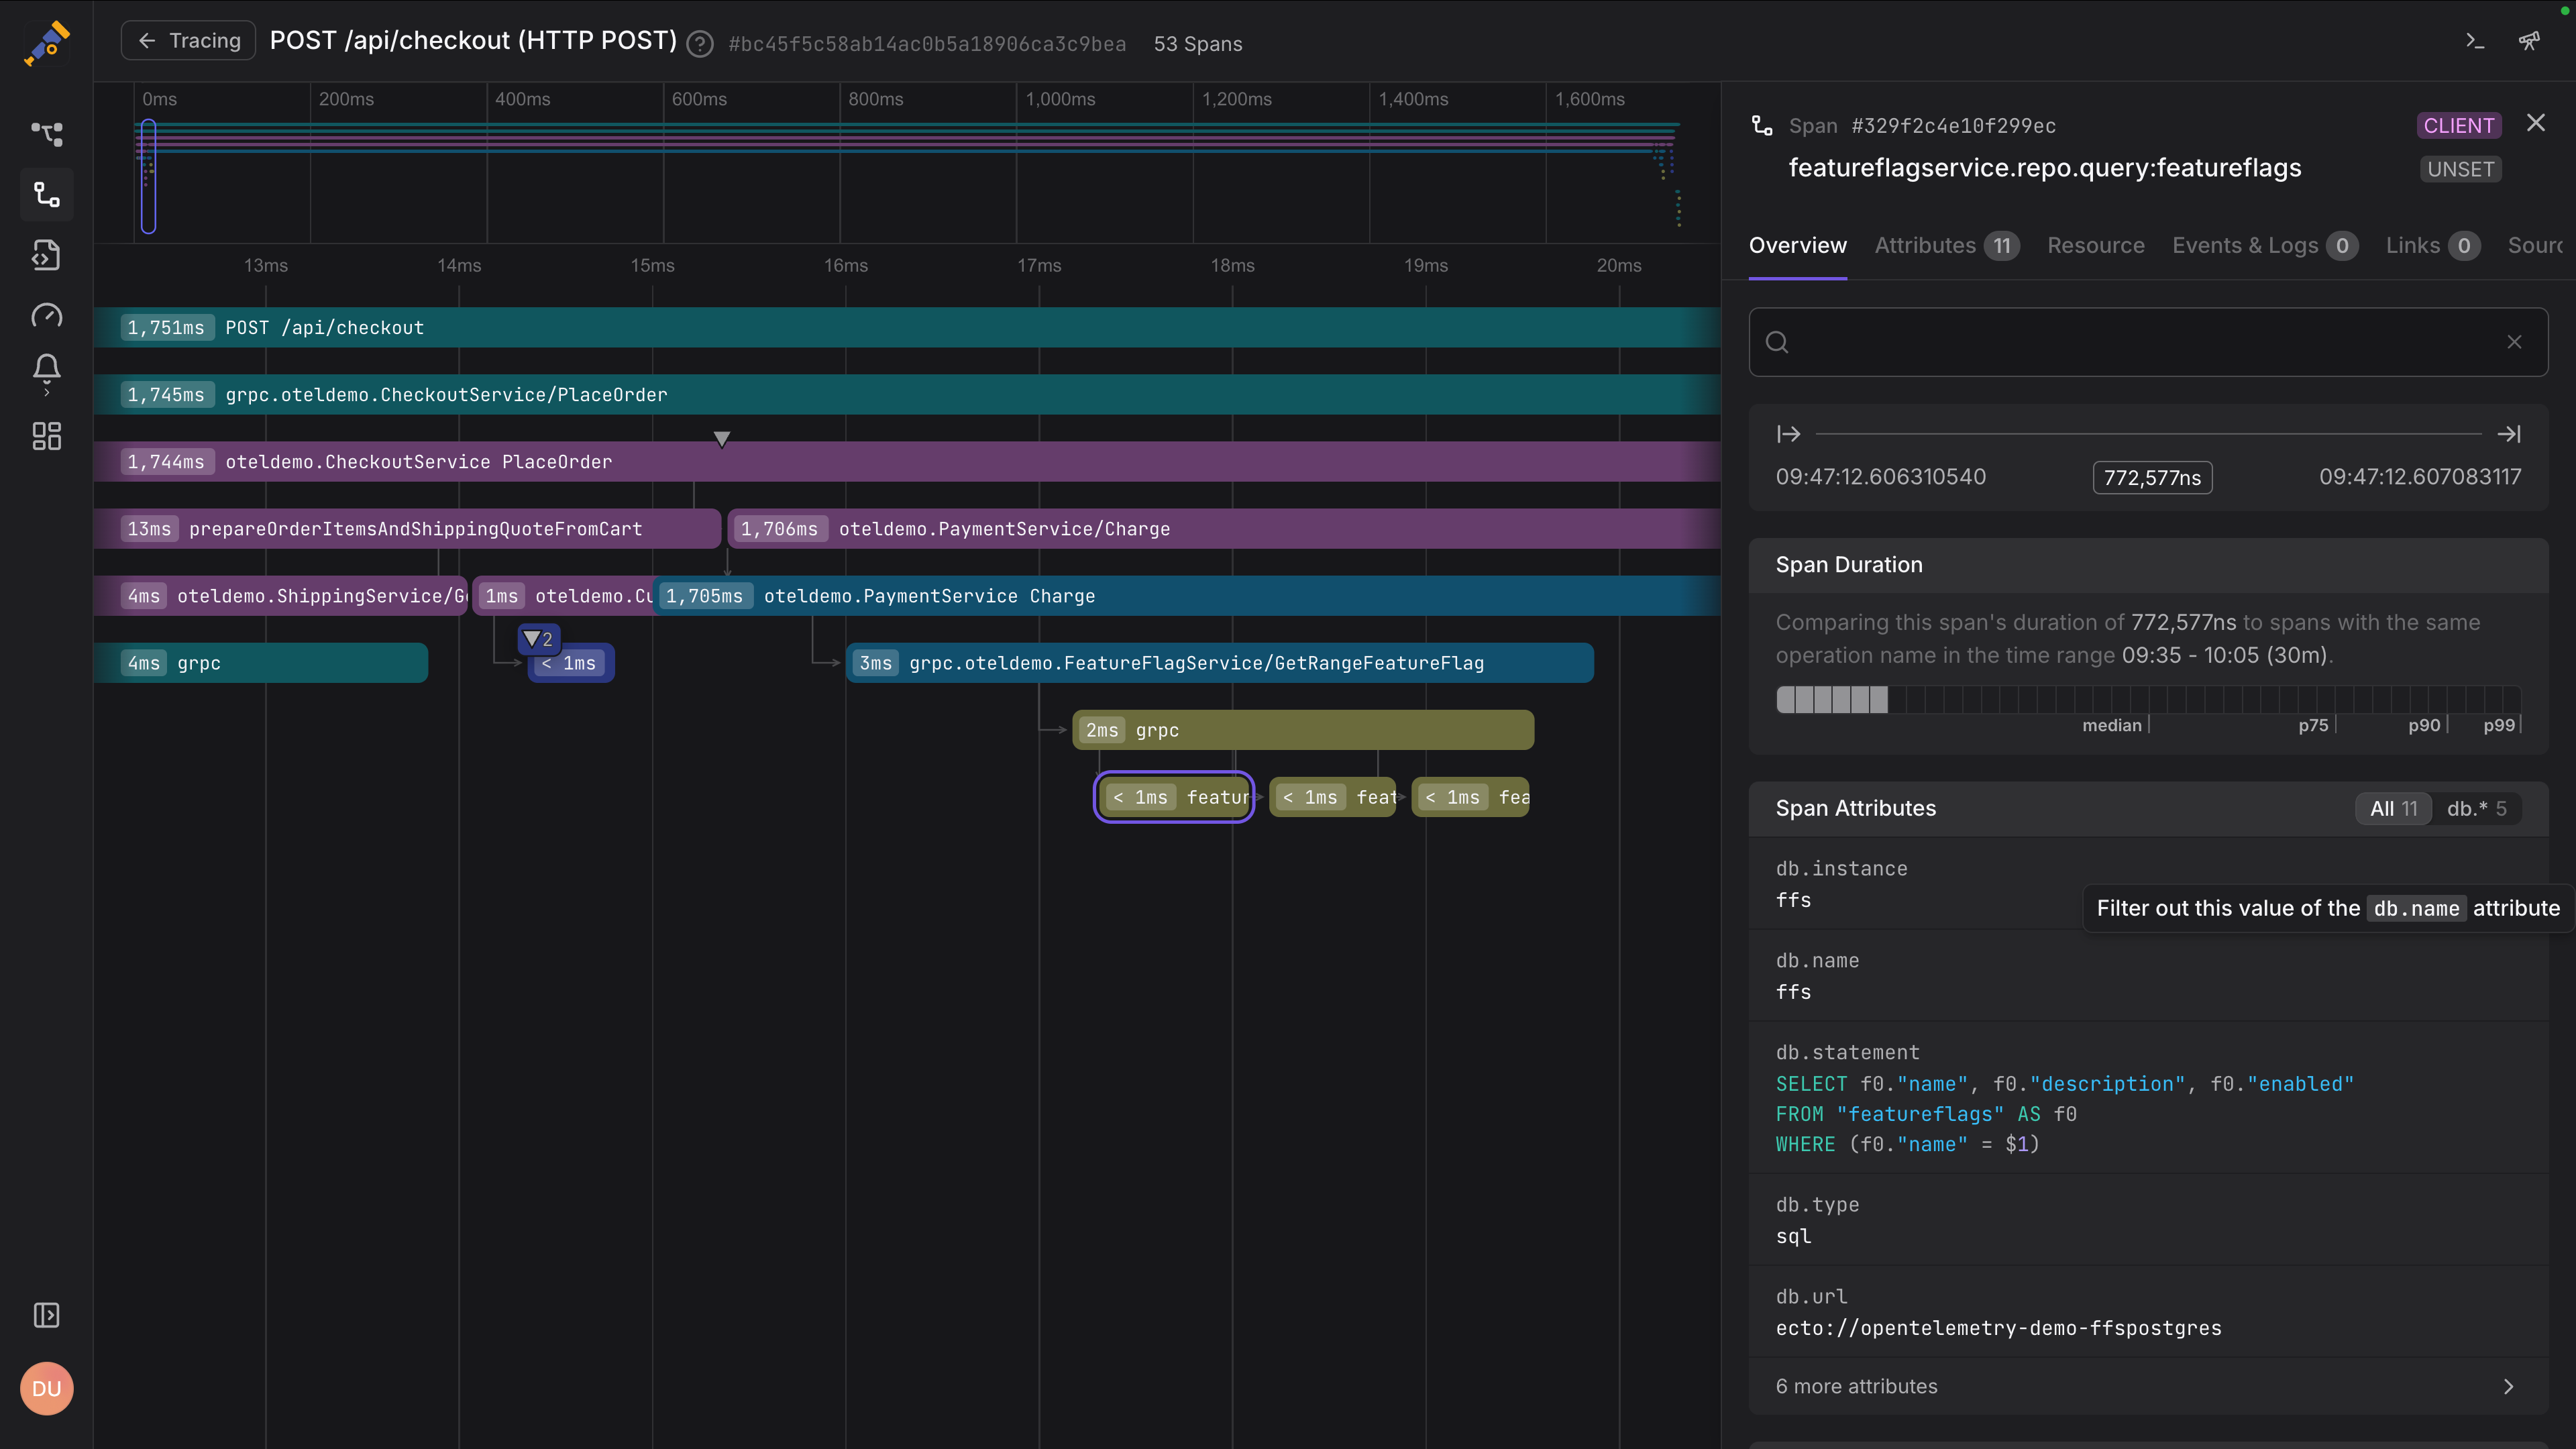
Dash0 is built around a simple idea that many tracing tools still struggle with in practice: distributed traces only matter if you can explore them quickly, at scale, and in full context.
Instead of treating tracing as a standalone feature, Dash0 makes it the backbone of how you investigate systems, tying spans directly to logs, metrics, resources, and recent changes.
Because Dash0 is OpenTelemetry-native by design, there is no translation layer between what your services emit and what you see. High-cardinality span attributes remain queryable, trace context flows cleanly across services, and correlation with logs and metrics works out of the box.
The result is a tracing experience that feels less like scrolling through waterfalls and more like answering concrete questions about why a request was slow or where an error actually originated
Dash0 also leans heavily into usability for real production workloads. You can search and filter traces in real time, pivot between signals with a single click, and use resource-centric views to understand how failures propagate across services and infrastructure.

When traces get dense, Dash0’s AI-powered Threadweaver steps in to analyze the full span graph, highlight the spans and attributes that actually matter, and explain how latency and errors propagate across services. Instead of scrolling through waterfalls, you get a clear, causal narrative of what went wrong and why.
What’s good
- OpenTelemetry native tracing with no proprietary agents, no vendor SDKs, and first-class support for OTLP and semantic conventions.
- Fast, high-cardinality trace search that lets you filter on real production attributes without pre-aggregation or rigid schemas.
- Seamless signal correlation, allowing you to jump from a slow span straight to related logs, metrics, and resource metadata in one click.
- Automated trace triage that compares baselines and time windows to surface likely root causes instead of forcing manual span-by-span inspection.
- Clear, readable trace views that turn large, multi-service traces into understandable narratives rather than overwhelming waterfalls.
- Predictable, telemetry-based pricing, which makes it easier to keep distributed tracing enabled at scale without constant cost tuning.
The catch
Dash0 is unapologetically built around OpenTelemetry and other open standards. Teams that rely heavily on proprietary tracing SDKs or legacy agents will need to migrate their instrumentation to get the most value. While this is usually a one-time cost, it can be a real hurdle for older systems or organizations deeply locked into vendor-specific tooling.
The verdict
If distributed tracing is central to how you debug, optimize, and operate systems, Dash0 is the clear choice in 2026. Its OpenTelemetry-native design, fast trace exploration, and deep signal correlation make it easier to understand real production behavior without drowning in data or fighting your tools.
Start your 14-day free trial of Dash0 today!
2. Jaeger

Jaeger is one of the original distributed tracing systems and remains a common reference point for how tracing works in practice.
Originally developed at Uber and later donated to the CNCF, Jaeger helped popularize trace-based debugging long before OpenTelemetry became the standard. In 2026, it’s best used as a solid, standalone tracing backend rather than a full observability solution.
Jaeger focuses squarely on collecting, storing, and visualizing traces. It supports OpenTelemetry ingestion, offers service dependency graphs, and provides a familiar waterfall-style trace view that many engineers already know how to navigate. For teams that want a self-hosted, no-frills way to store and inspect traces, Jaeger still does the job.
Where Jaeger shows its age is not correctness but ergonomics. It assumes that engineers are willing to do a fair amount of manual work when exploring traces, and it largely treats tracing as an isolated signal rather than something tightly integrated with logs, metrics, and higher-level workflows.
What’s good
- Battle-tested distributed tracing backend that has been used in large-scale production environments for years.
- Native OpenTelemetry support, making it a straightforward destination for modern instrumentation pipelines.
- Self-hosted and open source, which appeals to teams that want full control over data and infrastructure.
- Clear service dependency graphs that provide a high-level overview of how requests flow through systems.
- Simple mental model that is easy to adopt if your primary goal is basic trace visualization.
The catch
Jaeger’s tracing experience is largely static and manual. High-cardinality filtering is limited, correlation with logs and metrics is minimal, and dense traces quickly turn into long waterfalls that require careful scrolling and guesswork.
There is no built-in intelligence to highlight what actually matters in a trace, and advanced analysis often requires exporting data into other tools or writing custom queries. As systems grow more complex, this friction becomes more noticeable.
The verdict
Jaeger remains a reliable baseline for distributed tracing, especially for teams that value open source, self-hosting, and simplicity over polish. That said, compared to newer tools, it feels more like a tracing database than a full tracing experience.
If you need fast root cause analysis, deep context, or help making sense of large traces, you will likely outgrow Jaeger and look for something more opinionated.
3. Grafana Tempo

Grafana Tempo takes a deliberately different approach to distributed tracing. Instead of optimizing for interactive trace analysis, Tempo is designed to be a highly scalable, low-cost trace store that fits neatly into the broader Grafana ecosystem. It treats traces as long-term context rather than the primary investigation surface.
Tempo works best when paired with metrics. Rather than starting with traces directly, teams usually detect problems through Prometheus metrics and then jump into exemplar-linked traces for specific requests. This model scales extremely well and keeps storage costs predictable, but it also changes how engineers interact with tracing on a day-to-day basis.
In 2026, Tempo is a strong choice for teams already invested in Grafana and Prometheus who want tracing coverage without paying a high query or ingestion cost. It is less compelling for teams that expect tracing to drive most debugging workflows on its own.
What’s good
- Exceptionally scalable trace storage that handles massive volumes without requiring heavy indexing.
- Low and predictable costs, since Tempo avoids indexing full trace payloads by default.
- Supports OpenTelemetry ingestion, making it compatible with modern instrumentation pipelines.
- Tight integration with Grafana, especially through exemplars that link metrics directly to traces.
- Simple operational model that aligns well with cloud-native, object-storage-backed architectures.
The catch
Tempo trades query power for scalability. Because traces are minimally indexed, ad hoc searching and filtering across high-cardinality attributes is limited. You often need a trace ID to get meaningful value, which pushes most investigations to start from metrics instead of traces themselves. Correlation with logs and richer context requires additional tooling and careful Grafana configuration, and exploring dense traces can feel cumbersome compared to more interactive tracing-first tools.
The verdict
rafana Tempo succeeds when you treat tracing as durable context rather than an interactive debugging surface. It shines quietly in the background, storing vast amounts of trace data cheaply and reliably, while metrics remain the primary driver of investigation.
If you are comfortable starting with metrics and pulling traces only when you need concrete examples, Tempo fits naturally. If you expect traces to lead the investigation, it will feel like the wrong abstraction.
4. Honeycomb

Honeycomb has long positioned itself as a tracing-first observability tool, and that focus still defines the product in 2026. Honeycomb treats distributed tracing as a high-cardinality data problem rather than a visualization problem. Instead of encouraging engineers to scroll through individual traces, it pushes you toward asking structured questions across many traces at once.
This approach shines when you are debugging complex behavior that only shows up under specific conditions. Honeycomb’s query model lets you slice and group trace data by arbitrary fields, compare cohorts of requests, and identify which attributes correlate most strongly with latency or errors. In practice, this often surfaces issues faster than manually inspecting individual traces, especially in systems with a lot of variability.
Honeycomb works best for teams that are comfortable thinking in terms of exploratory queries and structured events. It rewards deliberate instrumentation and disciplined use of fields, but it can feel less intuitive if you expect tracing to behave like a traditional request-by-request debugger.
What’s good
- Tracing-first data model that treats spans as high-cardinality events rather than static diagrams
- Intuitive querying with BubbleUp for comparing large groups of traces and finding outliers which removes much of the friction from root cause analysis
- Excellent support for modern tracing patterns, including wide events with high cardinality fields
- Strong OpenTelemetry support, making it a natural fit for teams already standardizing on OTel instrumentation
The catch
Honeycomb is a specialized tracing and debugging tool rather than a full-stack observability platform. It excels at understanding complex application behavior but is less focused on traditional infrastructure monitoring or turnkey dashboards.
Getting the most value also requires a mindset shift: teams need to fully embrace the event-based model and invest in thoughtful instrumentation so traces carry the rich context that Honeycomb is designed to analyze.
The verdict
Honeycomb rewards curiosity and rigor. When you instrument well and ask sharp questions, it can reveal patterns and failure modes that are almost invisible in traditional trace views. It is less about watching individual requests unfold and more about understanding why certain classes of requests behave differently. That focus makes it exceptionally powerful, but also unapologetically opinionated.
5. Datadog APM

Datadog is one of the most widely adopted observability platforms in the industry, and its distributed tracing capabilities reflect that breadth. Tracing in Datadog is designed to fit into a comprehensive, all-in-one monitoring product that covers infrastructure, logs, metrics, security, and more. For many teams, tracing is not a standalone workflow but one part of a larger operational picture.
Datadog APM provides polished trace visualizations, service maps, and automatic instrumentation for many popular frameworks. It excels at giving quick answers to common questions such as which service is slow, where errors are spiking, and how performance has changed after a deployment. Traces are tightly integrated with metrics and logs, making it easy to pivot between signals during an incident.
The trade-off is that Datadog’s tracing model is heavily shaped by platform constraints. High-cardinality attributes are possible, but they must be carefully managed to avoid cost and performance issues. Tracing works best when you follow Datadog’s recommended patterns rather than treating traces as freely explorable, high-dimensional data.
What’s good
- Highly polished tracing UI with clear service maps, flame graphs, and waterfall views that are easy to navigate
- Strong out-of-the-box instrumentation for common languages, frameworks, and cloud services
- Deep integration with logs and metrics, enabling fast pivots during incident response
- Mature alerting and deployment tracking, which helps connect trace behavior to releases and config changes
- Enterprise-ready platform with strong support, compliance features, and operational tooling
The catch
Datadog’s tracing costs can escalate quickly as volume and cardinality increase. Many advanced features rely on sampling, indexing limits, or additional pricing tiers, which can make it harder to keep full-fidelity traces over time.
The platform is also heavily vendor-specific, with proprietary agents and workflows that increase lock-in. For teams that want to treat tracing as raw, exploratory data, these constraints can feel restrictive.
The verdict
Datadog’s tracing works best when speed and consistency matter more than freedom. It provides fast, polished answers to common performance questions and integrates cleanly into a broader operational workflow.
As long as you stay within its guardrails, it feels effortless. When you push beyond them, especially with high-cardinality or exploratory tracing, the platform’s constraints become more apparent.
6. Dynatrace APM

Dynatrace approaches distributed tracing from a very different angle than most modern tools. Rather than exposing tracing as a raw exploration surface, Dynatrace emphasizes automated analysis and top-down answers. Traces are one of several signals feeding its causation engine, which aims to tell you what is wrong without requiring deep manual investigation.
Dynatrace’s tracing is tightly coupled to its proprietary agent and service model. Once deployed, the platform automatically discovers services, builds dependency maps, and captures end-to-end transactions with minimal configuration. For organizations that want tracing to “just work” with little instrumentation effort, this can be a major advantage.
The flip side is reduced transparency and flexibility. Traces are often filtered, summarized, or abstracted by the platform’s analysis layer, which can make it harder to perform open-ended exploration or validate conclusions independently. Distributed tracing in Dynatrace is less about asking your own questions and more about trusting the system’s interpretation.
What’s good
- Automatic, end-to-end tracing with minimal manual instrumentation required
- Strong dependency and service maps that provide a clear system-wide view of request flows
- Integrated root cause analysis, where traces feed directly into problem detection and impact analysis
- Enterprise-grade automation, well suited for large, complex environments with many services
- Tight integration with metrics, logs, and infrastructure data within a single platform
The catch
Dynatrace relies heavily on proprietary agents and internal data models, which limits portability and increases vendor lock-in. High-cardinality trace exploration is constrained, and it can be difficult to see or query the raw trace data behind automated conclusions. Costs and licensing complexity can also be challenging, especially for teams that want broad tracing coverage across many services.
The verdict
Dynatrace treats tracing as an input to automated reasoning rather than something engineers actively explore. It is most effective when you want the platform to surface problems proactively and explain their impact without requiring deep manual analysis. That trade-off favors operational scale and predictability over transparency. If you like seeing the raw data and drawing your own conclusions, this model can feel restrictive.
7. New Relic APM

New Relic positions its distributed tracing as part of a broad, unified observability platform. Like Datadog, tracing in New Relic is designed to complement metrics, logs, browser monitoring, and infrastructure data rather than stand entirely on its own. The goal is fast orientation during incidents rather than deep, trace-first analysis.
New Relic APM provides automatic instrumentation for many popular runtimes and frameworks, making it easy to get traces flowing with minimal setup. Traces are presented alongside service maps, error analytics, and deployment markers, which helps teams quickly understand whether a slowdown or failure correlates with a recent change. For common performance issues, this integrated view can be very effective.
Where New Relic tends to fall short is in advanced trace exploration. High-cardinality querying is limited, and most workflows assume you already know which service or transaction to inspect. Tracing is optimized for known problems and steady-state monitoring rather than open-ended investigation across large trace datasets.
What’s good
- Easy onboarding and auto-instrumentation for many languages and frameworks
- Clean integration with metrics, logs, and deployment data, supporting fast incident triage
- Clear service and transaction views that surface common performance bottlenecks quickly
- Mature APM features, including error tracking and response time analysis
- Single-pane-of-glass experience for teams that want everything in one platform
The catch
New Relic’s tracing model is relatively constrained compared to tracing-first tools. Querying and filtering across high-cardinality span attributes is limited, and traces are often sampled or summarized to control cost.
The platform also relies on proprietary agents and data models, which reduces portability and increases vendor lock-in. For teams that want to treat traces as raw, exploratory data, this can be frustrating.
The verdict
New Relic’s tracing is optimized for orientation rather than exploration. It helps you quickly confirm suspicions, correlate issues with deployments, and understand the shape of common problems. When issues are subtle, rare, or highly contextual, the lack of deep trace exploration becomes noticeable, and tracing starts to feel more like a supporting signal than a primary tool.
8. SigNoz

SigNoz is an open-source observability platform that positions itself squarely around OpenTelemetry. Unlike older tracing systems that later added OTel support, SigNoz was built with OpenTelemetry as the default ingestion and data model, which makes it appealing to teams that want modern instrumentation without proprietary agents.
SigNoz treats distributed tracing as a first-class signal and pairs it closely with metrics and logs. Traces are searchable by span attributes, visualized through service maps and flame-style views, and correlated with logs using shared context. For teams that want a self-hosted or open-core alternative to commercial tracing tools, SigNoz offers a surprisingly complete tracing experience.
That said, SigNoz is still evolving. While its tracing capabilities are solid, especially for OpenTelemetry-native environments, some workflows require more manual setup and tuning compared to mature commercial platforms. It rewards teams that are comfortable operating their own observability stack and iterating on it over time.
What’s good
- OpenTelemetry-first design, with native support for OTLP ingestion and semantic conventions
- Good high-cardinality trace search, allowing filtering and grouping on span attributes
- Integrated logs and metrics, enabling basic signal correlation without extra tooling
- Open-source core, with self-hosting and cloud options depending on operational needs
- Clear trace visualizations, including service maps and detailed span timelines
The catch
SigNoz requires more operational effort than fully managed platforms, especially when self-hosted at scale. Some advanced analysis features and UI polish lag behind more established vendors, and performance tuning can be necessary in high-volume environments. Teams expecting a turnkey experience may find the setup and maintenance overhead noticeable.
The verdict
SigNoz occupies a pragmatic middle ground. It delivers a modern, OpenTelemetry-native tracing experience without hiding the underlying mechanics, but it asks you to take ownership of the system you run. As it continues to mature, it offers a compelling path for teams that want control and openness without abandoning usability, even if it still lacks some of the refinement of larger commercial platforms.
9. IBM Instana APM

IMB Instana approaches distributed tracing through the lens of classic APM, with a strong emphasis on automation and topology awareness. Tracing in Instana is tightly integrated with its automatic service discovery and dependency graph, aiming to give engineers an immediate understanding of how requests flow through complex systems without extensive manual setup.
Instana relies heavily on its proprietary host agent, which automatically instruments supported runtimes and captures traces at the method and service-call level. This makes it particularly effective in large, fast-moving environments where manual instrumentation would be difficult to maintain. Traces are enriched with infrastructure and runtime context, allowing Instana to connect slow or failing requests directly to underlying system conditions.
That automation comes with trade-offs. Instana abstracts much of the raw tracing data behind its analysis model, prioritizing summarized views and detected problems over open-ended exploration. Tracing is designed to feed into automated root cause analysis rather than serve as a flexible, query-driven investigation surface.
What’s good
- Automatic distributed tracing with minimal manual instrumentation required
- Strong service and dependency graphs that clearly show how requests move across applications and infrastructure
- Method-level visibility that helps pinpoint where time is actually spent inside services
- Tight correlation with infrastructure metrics, making it easier to link slow traces to resource constraints
- Well suited for large enterprise environments where consistency and automation matter more than flexibility
The catch
Instana’s tracing experience is closely tied to proprietary agents and internal data models, which limits portability and increases vendor lock-in. High-cardinality, exploratory trace analysis is constrained, and engineers have less direct access to raw span data compared to tracing-first tools. Teams that want to freely slice and dice traces or rely heavily on OpenTelemetry-native workflows may find Instana restrictive.
The verdict
Instana prioritizes certainty over flexibility. It excels at turning complex, dynamic environments into a stable, comprehensible model that feeds automated analysis. This makes it effective for large organizations that value consistency and speed over experimentation. The cost of that certainty is reduced visibility into the raw tracing data and fewer opportunities for exploratory analysis.
10. AWS X-Ray

X-Ray is Amazon’s native distributed tracing service, designed primarily for workloads running inside the AWS ecosystem. It focuses on making tracing easy to adopt for common AWS services rather than offering a fully general-purpose tracing platform. For teams building and operating entirely on AWS, X-Ray is naturally positioned as the default tracing option.
X-Ray integrates tightly with services like Lambda, API Gateway, ECS, and EC2, and can automatically generate traces with minimal setup. It provides service maps, basic trace timelines, and latency breakdowns that are sufficient for understanding common request paths and identifying obvious bottlenecks. Tracing works best when you stay within AWS-managed boundaries and use supported SDKs and services.
Outside those boundaries, limitations become clear. X-Ray’s data model and querying capabilities are relatively constrained, and high-cardinality attributes or complex cross-service analysis are difficult. Traces are sampled aggressively by default, which helps control cost but limits deep forensic analysis.
What’s good
- Native integration with AWS services, with many offering automatic instrumentation.
- Minimal setup for basic tracing in AWS-first architectures.
- Clear service maps that visualize request flows across AWS resources.
- Included in the AWS ecosystem, avoiding additional vendors or contracts.
- Reasonable default cost controls through built-in sampling.
- Rich support for custom annotations and metadata to enhance trace context.
The catch
AWS X-Ray is tightly bound to AWS and does not generalize well to hybrid or multi-cloud environments. Its querying and filtering capabilities are limited, making exploratory trace analysis difficult.
OpenTelemetry support exists, but X-Ray’s model does not fully align with modern, high-cardinality tracing practices. As systems grow more complex, teams often outgrow X-Ray’s ability to explain nuanced performance issues.
The verdict
AWS X-Ray is best understood as a convenience layer for AWS-native systems. It provides just enough tracing to explain common latency and failure patterns without requiring much effort or configuration. As systems grow more complex or stretch beyond AWS boundaries, its simplicity becomes a limitation rather than a strength.
11. Google Cloud Trace

Google Cloud Trace is Google Cloud’s native distributed tracing offering, designed primarily for applications running on GCP. Like other cloud provider tracing tools, its main goal is convenience and tight platform integration rather than deep, trace-first analysis.
Cloud Trace integrates seamlessly with GCP services such as App Engine, Cloud Run, GKE, and Compute Engine. Traces can be collected automatically or via OpenTelemetry, and they appear alongside related logs and metrics in the Google Cloud Console. For teams operating fully within GCP, this provides a low-friction way to gain basic visibility into request latency and error propagation.
The tracing experience itself is intentionally minimal. Cloud Trace focuses on latency distributions, trace sampling, and high-level breakdowns rather than rich exploration of individual traces. It works best when you already know which service is misbehaving and want confirmation, not when you need to explore complex, emergent behavior across many services.
What’s good
- Native integration with Google Cloud services, requiring little setup in GCP-first environments
- OpenTelemetry-compatible ingestion, making it easy to adopt standard instrumentation
- Low operational overhead, with no separate infrastructure to manage
- Clear latency and error visualizations for common request paths
- Tight linkage with Cloud Logging and Cloud Monitoring for basic signal correlation
The catch
Google Cloud Trace is limited outside the GCP ecosystem and does not generalize well to hybrid or multi-cloud architectures. Querying and filtering across high-cardinality span attributes is constrained, and trace exploration is relatively shallow. Sampling is aggressive by default, which can make detailed debugging difficult during intermittent or low-frequency issues.
The verdict
Google Cloud Trace works best when tracing is a supporting feature rather than a core discipline. It integrates cleanly into GCP workflows and provides quick answers to straightforward performance questions. When you need to deeply explore how requests behave across many services, it becomes clear that Cloud Trace was never designed for that depth.
12. Zipkin

Zipkin is one of the earliest open-source distributed tracing systems and, alongside Jaeger, helped define the basic tracing concepts many tools still use today. In 2026, Zipkin is best viewed as a lightweight, educational, or infrastructure-level tracing backend rather than a modern tracing platform.
Zipkin focuses on collecting and visualizing traces with minimal abstraction. It provides a straightforward UI for viewing traces, inspecting spans, and understanding basic request timing across services. For small systems or teams that want to understand the mechanics of distributed tracing without additional layers of automation or analysis, Zipkin remains approachable.
However, Zipkin has not evolved significantly with the rise of high-cardinality data, large-scale microservices, or trace-driven workflows. It assumes a relatively modest volume of traces and manual inspection as the primary debugging technique.
What’s good
- Simple, easy-to-understand tracing model that makes it useful for learning and experimentation
- Fully open source and self-hosted, with minimal operational complexity
- Basic OpenTelemetry compatibility through collectors and exporters
- Low overhead, suitable for smaller systems or internal tools
- Clear span timelines that illustrate request flow without excessive abstraction
The catch
Zipkin lacks many of the capabilities expected from modern distributed tracing tools. Searching and filtering across high-cardinality attributes is limited, correlation with logs and metrics is minimal, and dense traces quickly become difficult to interpret. There is no built-in intelligence, automation, or advanced analytics to help surface what actually matters in a trace, which makes it less practical as systems grow.
The verdict
Zipkin remains valuable as a reference point. It shows what distributed tracing looks like at its most basic level and does so without much ceremony. That simplicity is its appeal, but also its ceiling. Once tracing becomes central to how you debug and reason about systems, Zipkin’s limitations are hard to ignore.
Final thoughts
Distributed tracing is no longer just about collecting spans and storing them in a backend. It's about making sense of complex systems quickly, under real production pressure. While most tools can now ingest OpenTelemetry traces, they differ sharply in how usable those traces are once things go wrong.
Some platforms treat tracing as supporting context for metrics or automation. Others require engineers to adapt their workflows around platform constraints, sampling rules, or proprietary models. Those approaches work, but they often add friction exactly when clarity matters most.
Dash0 stands out by treating distributed tracing as a first-class investigation tool. Its OpenTelemetry-native foundation, high-cardinality search, seamless signal correlation, and AI-assisted trace analysis make it easier to understand why requests fail or slow down without fighting the tooling. Traces stay rich, explorable, and connected to real system context.
The best tracing tool is the one engineers actually use during incidents. In 2026, Dash0 is the clearest choice for teams that want tracing to drive understanding, not just confirm it.

