Papertrail is a hosted log-management service built around fast setup, centralized search, live tailing, saved searches, and alerts. It remains a good fit for developers and operations teams that want to forward syslog or text logs from many systems without running a logging cluster. Its uncomplicated interface is the point: Papertrail gets engineers from scattered files to a searchable stream quickly.
Teams usually evaluate Papertrail alternatives when that simplicity stops matching the job. Papertrail prices primarily by monthly transfer volume, with searchable retention measured in days and older data pushed to archives; overages can continue at a higher per-GB rate. That works for live troubleshooting, but modern buyers may need native log-trace correlation, OpenTelemetry pipelines, high-cardinality analytics, longer searchable retention, security workflows, or self-managed deployment. The best replacement therefore depends less on who has a live-tail screen and more on what you want logs to become: a lightweight debugging tool, one signal in an observability platform, a high-volume event store, or a governed system of record.
Quick picks
| Tool | Best fit |
|---|---|
| Dash0 | Cloud-native teams standardizing logs, metrics, and traces on OpenTelemetry |
| Axiom | Engineering teams querying high-volume event data with a compute-aware cost model |
| Better Stack | Small and midsize teams wanting Papertrail-like log search plus on-call and status pages |
| Grafana Cloud Logs / Loki | Grafana and Kubernetes users comfortable with labels and LogQL |
| Elastic Cloud | Teams needing deep full-text search, flexible schemas, and several deployment models |
| Graylog | Regulated or security-conscious teams needing self-managed log management or SIEM |
What to look for in a Papertrail alternative
-
Migration path: Check whether the replacement accepts your existing syslog, Fluent Bit, Vector, cloud, and application sources. OpenTelemetry support reduces future instrumentation and transport switching costs, but queries, dashboards, alerts, and access policies can still be vendor-specific.
-
Investigation workflow: Papertrail is optimized for text search and live tailing. Decide whether you now need structured-field analytics, SQL-style pipelines, trace correlation, log-derived metrics, or security investigations.
-
Searchable retention: Separate hot, immediately searchable retention from archive. A low ingest price is less useful if routine investigations require rehydration, retrieval fees, or a second query path.
-
Pricing unit: Model your workload against the actual meters: ingested GB, stored GB-month, indexed events, query compute, processed volume, seats, and adjacent products. Message count favors different workloads than byte volume.
-
Cost controls: Look for pre-ingest filtering, quotas, hard spending caps, retention by dataset, and archive routing. Debug logging, traffic spikes, and large stack traces are common surprise-cost drivers.
-
Deployment and governance: SaaS minimizes operations; self-managed software offers more data-location control but transfers upgrades, scaling, backup, and availability to your team. Validate SSO, RBAC, audit logs, residency, and support separately from core search.
1. Dash0
Best for: Cloud-native teams replacing log-only troubleshooting with an OpenTelemetry-native observability workflow.
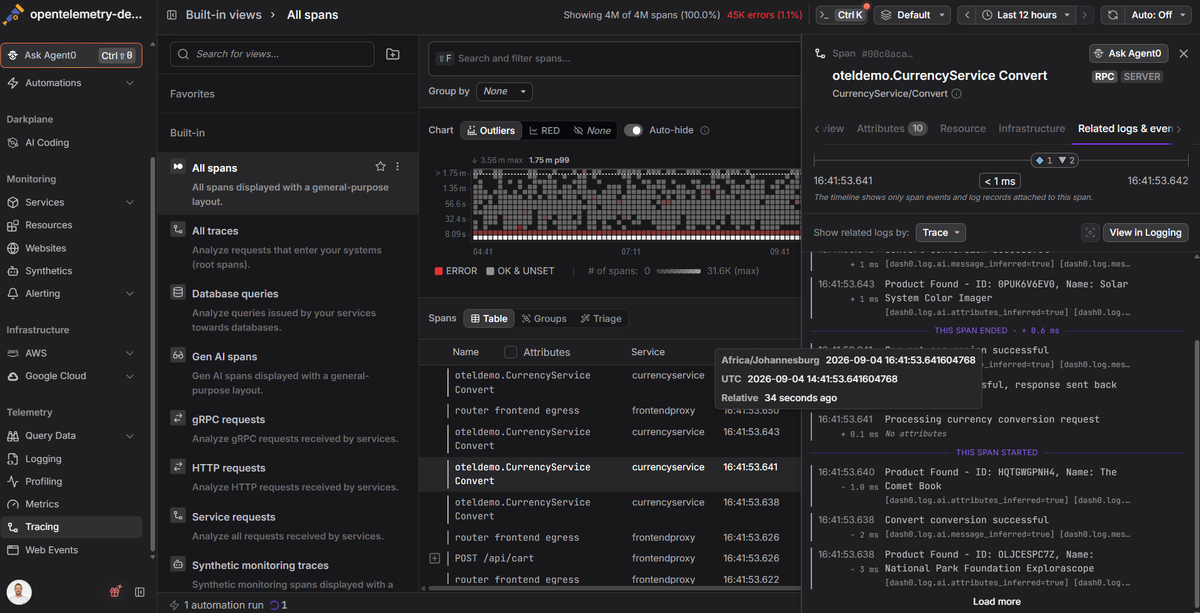
Dash0 treats logs as part of the OpenTelemetry data model rather than as an isolated text stream. Its log management experience surfaces attributes, resource metadata, and span context, then lets engineers move between logs, traces, and metrics during an investigation. OpenTelemetry collection and OTLP transport reduce instrumentation lock-in; dashboards, alerts, saved queries, retention, and product workflows still require migration planning.
Dash0 pricing meters ingestion and storage by the number of log records, spans, and metric data points. The model avoids per-seat and per-host dimensions for core telemetry, and SignalControl can drop low-value data before storage. Record-based billing is predictable when event counts are stable, but teams with many tiny log lines should compare it carefully with per-GB alternatives. Dash0 offers a free trial and is SaaS-first.
Dash0 is not a SIEM and is less suitable than Graylog for security content, long compliance investigations, or self-managed environments. It is also more platform than you need if Papertrail's text search and tailing already cover the job.
Worth exploring if: You want portable OpenTelemetry instrumentation and correlated investigations across all three telemetry signals.
Give it a pass if: You need on-premises deployment, mature SIEM workflows, or a logs-only tool with the smallest possible surface area.
2. Axiom
Best for: Engineering teams with high event volume, bursty ingestion, or queries that go well beyond grep-style search.
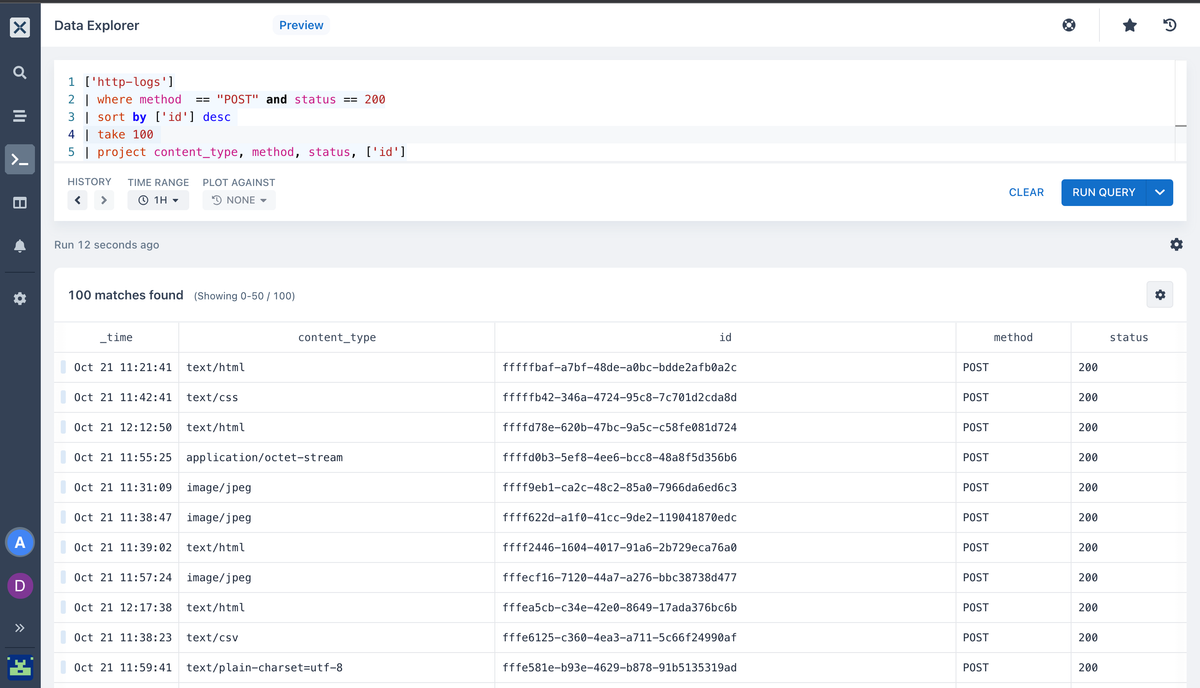
Axiom is a managed event-data platform for logs, traces, and other timestamped machine data. Its Axiom Processing Language supports filtering, aggregation, transformation, and joins, while live streaming preserves the quick feedback loop Papertrail users expect. Virtual fields let teams derive structure at query time instead of fully normalizing every source before ingestion.
Pricing separates data loading, storage, and query compute, with a platform fee for the team plan, included allowances, configurable retention, and automatic volume discounts. Axiom's pricing page also exposes hard caps and paid governance add-ons such as SAML SSO, RBAC, directory sync, and audit logs. This model can work well when much of the data is retained but rarely queried; frequent wide scans and enterprise controls are the dimensions to model carefully.
Axiom is SaaS-only, and APL, monitors, dashboards, and saved investigations become migration work even when collection uses OpenTelemetry or Vector. It is also a broader event platform than a drop-in syslog viewer, so teams should test query ergonomics with their least-structured logs.
Worth exploring if: You want to retain a large event corpus and pay separately for the compute used to investigate it.
Give it a pass if: You require self-managed deployment or want costs driven only by ingest, not storage and query activity.
3. Better Stack
Best for: Small and midsize teams that want a straightforward Papertrail replacement with incident-response tooling attached.
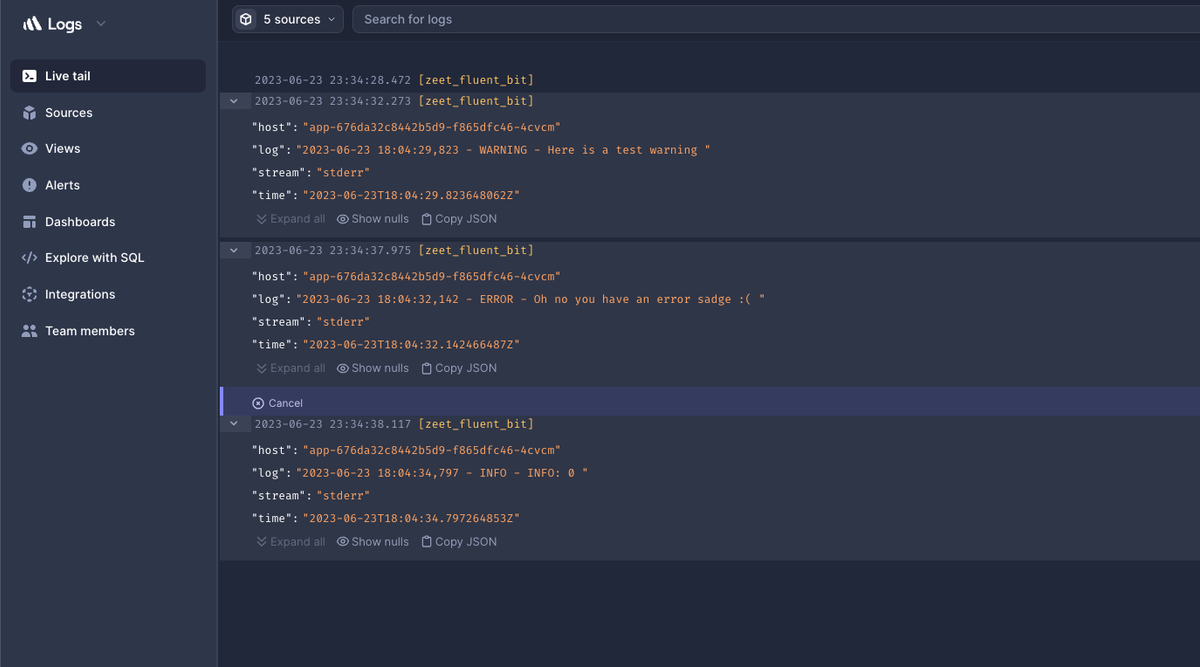
Better Stack is the closest match to Papertrail's developer-friendly feel. It provides live tailing, structured log and trace ingestion, visual filtering, SQL queries, Vector Remap Language transformations, alerts, and dashboards. The larger product also includes uptime monitoring, on-call, incident management, and status pages, which can remove several integrations from a small team's stack.
The cost model is easier to map to byte-heavy logs than an event-count model: Better Stack's pricing separates log and trace ingestion from retained GB-month, with standard querying included and optional query-boost charges based on data scanned. There is a free allowance, while responder licenses, AI usage, uptime checks, and other incident features introduce additional meters. Spend is most coherent when you actually want both telemetry and response workflows.
The service is managed. Better Stack offers an own-bucket option, but it is not the same as running the complete platform in your environment. Moving also means replacing Papertrail searches and alerts with SQL, visual queries, and Better Stack dashboards.
Worth exploring if: You value low-friction log search and want on-call, uptime, or status communication under the same vendor.
Give it a pass if: You must self-host or already have mature incident tooling and only need a log backend.
4. Grafana Cloud Logs / Loki
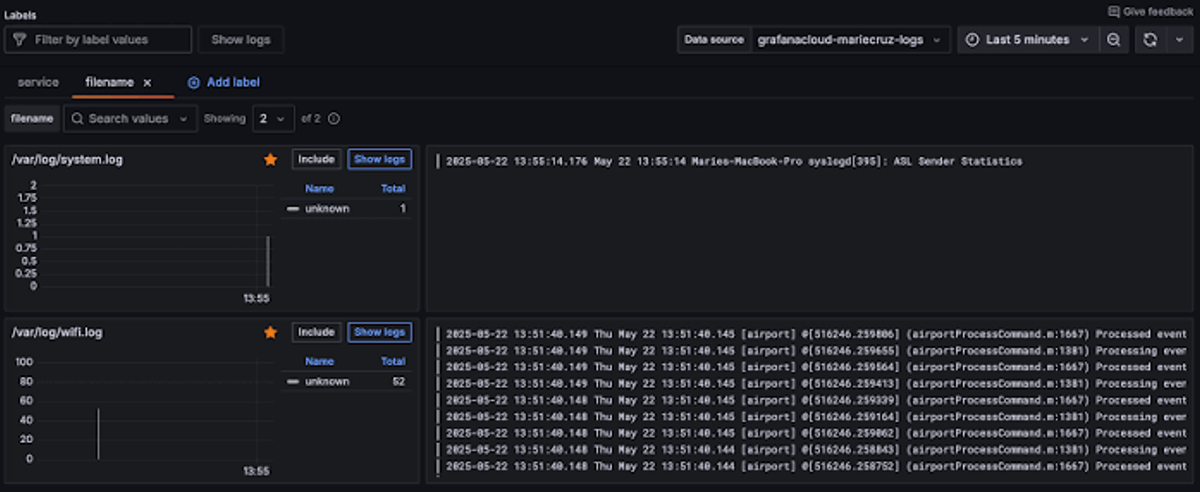
Best for: Kubernetes and Grafana teams that want a managed service today with a credible self-managed path.
Grafana Cloud Logs is the managed form of Loki, while Loki itself can run in your infrastructure. Loki indexes a limited set of stream labels and stores compressed log chunks in object storage rather than building a full-text index for every field. That architecture fits Kubernetes metadata and keeps the index small, while LogQL and Grafana connect logs to Prometheus-style metrics and Tempo traces.
Grafana Cloud meters log processing, writes, and retention separately and includes a free tier. Self-managed Loki removes the vendor bill but replaces it with object storage, compute, upgrades, tenancy, backup, and on-call ownership. Either route demands label discipline: high-cardinality labels create too many streams, while weak labels force broader scans. Full log lines remain searchable, but investigations work best when labels narrow the candidate data first.
This is therefore less of a Papertrail clone than an architectural choice. Teams already fluent in Grafana and Prometheus gain a coherent query and dashboard environment; teams expecting arbitrary full-text search to be the primary index may prefer Elastic or Axiom.
Worth exploring if: Grafana is already your operational front end and your team understands Kubernetes labels and LogQL.
Give it a pass if: You want rich ad hoc field search without designing a label schema or operating several open-source components.
5. Elastic Cloud
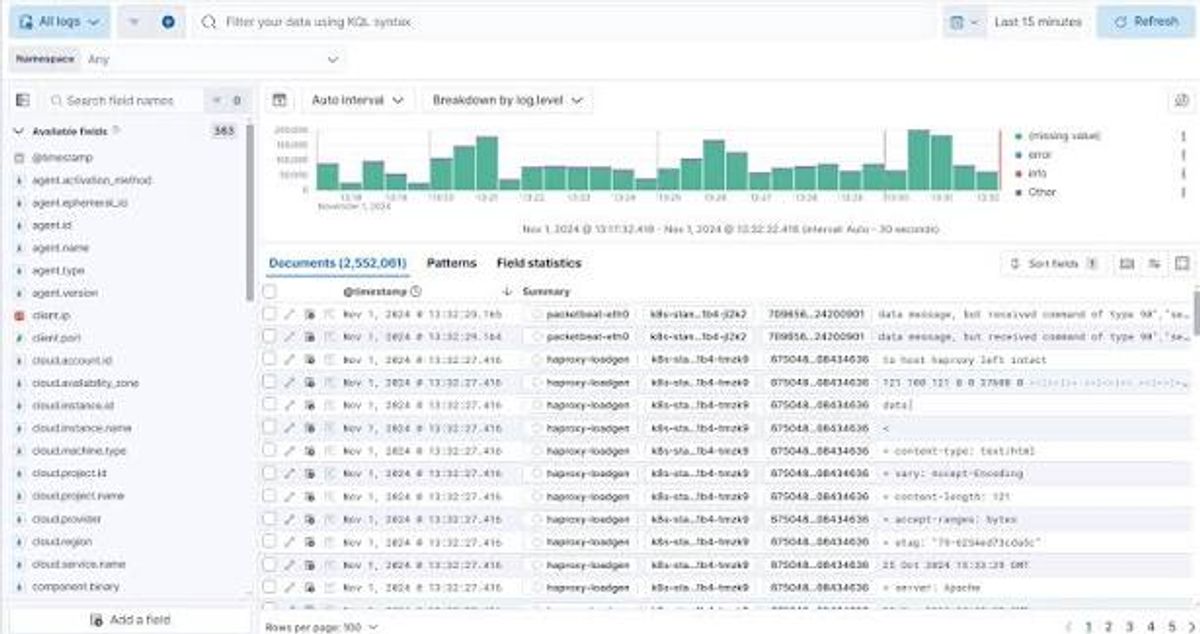
Best for: Teams that prioritize deep full-text search, flexible log analytics, and control over hosting architecture.
Elastic Cloud builds log management on Elasticsearch and Kibana. It is strongest when an incident begins with an unknown string, request identifier, stack trace, or field that was not promoted to a label. KQL, Lucene-style search, and the piped ES|QL workflow support both direct search and analytical transformations, while Elastic Agent, Logstash, and OpenTelemetry cover several ingestion paths.
The deployment range is unusually broad: Elastic offers serverless and hosted cloud services as well as self-managed subscriptions. Elastic Observability Serverless pricing separates ingested and retained data volumes, while hosted clusters are resource-based. Serverless is easier to forecast from telemetry volume; hosted or self-managed deployments expose more tuning and control but make capacity planning, shards, memory, storage tiers, and upgrades part of the operational cost.
That flexibility is also the catch. Elastic has more concepts, query options, and administrative depth than Papertrail, so migration is a platform project rather than a destination change. It is compelling when search itself is strategic, not when the goal is simply to tail application logs.
Worth exploring if: Unstructured search, long-lived analytics, or deployment flexibility matters more than minimal administration.
Give it a pass if: You want Papertrail's small learning surface and have no appetite for Elasticsearch concepts or cluster economics.
6. Graylog
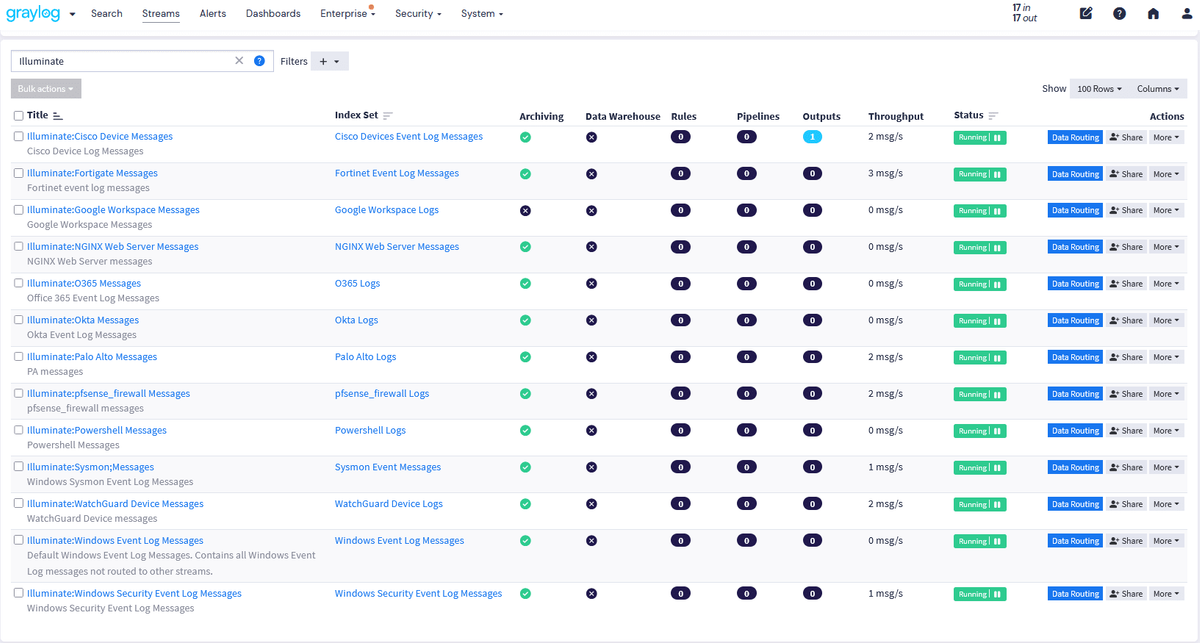
Best for: Regulated organizations and security-conscious teams that need deployment control, structured pipelines, or a path from log management to SIEM.
Graylog spans three levels: Graylog Open for source-available self-managed logging, Graylog Enterprise for governed log management, and Graylog Security for SIEM. It accepts syslog, CEF, GELF, Beats, NetFlow, and other common inputs, making it a natural option for infrastructure and network estates. Pipelines, streams, field normalization, dashboards, alerts, RBAC, tiered storage, and data-lake routing support operations and compliance use cases beyond Papertrail's developer-focused workflow.
Graylog can run on-premises, in a private cloud, in a chosen cloud provider, or as Graylog Cloud. Graylog's pricing makes Open free with community support; commercial editions use annual subscriptions based on daily processed volume or prepaid consumption units. Data routed to the integrated lake does not count as actively processed until retrieval, which can help separate compliance retention from real-time analysis. Infrastructure and staff remain part of the bill for self-managed deployments.
The tradeoff is operational and organizational weight. Graylog's ingest pipelines, storage, permissions, and security features deserve ownership, and its commercial starting point targets teams with more than a small developer logging need.
Worth exploring if: Data location, compliance, network logs, or future SIEM requirements are central to the decision.
Give it a pass if: You want a self-service SaaS tool that a small application team can adopt in an afternoon.
Comparison table
| Tool | Best fit | Main strength | Main tradeoff | Deployment | Pricing model |
|---|---|---|---|---|---|
| Dash0 | OpenTelemetry teams | Cross-signal resource and trace context | No self-hosting or SIEM | SaaS | Ingested and stored telemetry records/data points |
| Axiom | High-volume event analytics | APL and compute-separated querying | Query usage and add-ons need modeling | SaaS | Platform fee plus loading, storage, and query compute |
| Better Stack | Developer teams | Logs plus incident response | Bundle adds several meters | SaaS | Ingested and retained GB; optional query and response charges |
| Grafana Cloud Logs / Loki | Grafana and Kubernetes users | Flexible managed or self-managed Loki path | Label and LogQL discipline | SaaS or self-managed | Cloud processing/write/retention, or infrastructure cost |
| Elastic Cloud | Search-intensive teams | Full-text search and deployment choice | Highest platform and operating complexity | Serverless, hosted, or self-managed | Data volume, cloud resources, or infrastructure plus subscription |
| Graylog | Regulated and security teams | Deployment control and SIEM path | Operational ownership or annual commitment | SaaS or self-managed | Free Open edition; processed-volume commercial subscriptions |
Final thoughts
The Papertrail alternatives market divides into four useful camps. Better Stack preserves the quick, developer-oriented experience and adds incident response; Axiom and Elastic make log analytics itself the priority; Dash0 and Grafana turn logs into one signal inside a wider observability workflow; Graylog emphasizes deployment control, compliance, and security. None is universally cheaper because their billing units reward different workloads. Per-record pricing favors larger structured events, per-GB pricing favors small messages, query-compute pricing favors retained-but-cold data, and self-hosting favors teams that can absorb the operational work.
Before replacing Papertrail, replay a representative week of production logs into your shortlist and test the incidents you actually investigate. Measure event count and bytes, keep debug spikes in the sample, test the longest required retention window, and rebuild one saved search, alert, access policy, and archive workflow. Then check whether engineers can move from an alert to the relevant log and—if applicable—to its trace without changing mental models. If OpenTelemetry-based, multi-signal investigation is the goal, start a Dash0 free trial and compare the same workload against the logs-first option on your shortlist.