Logz.io is a set of managed open-source engines behind one login: OpenSearch and OpenSearch Dashboards for logs, a Prometheus-compatible store for metrics, a Jaeger-lineage backend for traces, and Cloud SIEM, its security information and event management product, sitting on the same log pipeline. That composition works, and it is also why a single investigation can involve three query models and three shipping tokens. Teams who instrumented with OpenTelemetry expecting one pipeline often end up running logzio/logs, logzio/traces, and prometheusremotewrite exporters side by side, each with its own account token, as Logz.io's own Kubernetes collector examples show.
Logz.io has not stood still on that, and it is worth being precise about what they shipped. In April 2026 they released OrionIQ, an agentic platform whose agents investigate alerts on their own, follow your runbooks, and as of August 2026 reach into more than 600 systems for context. They sell it to run alongside Datadog, Grafana, and New Relic as much as alongside their own backend. An agent that correlates across three engines on your behalf is a real answer to the seams, and it is a different answer from three engines becoming one query surface. The agent sits on top of the seams rather than removing them. If that trade suits you, staying put is defensible and this article is not for you.
This also makes alternatives to Logz.io a tricky comparison, because Logz.io competes in three markets at once. Want the ELK experience, meaning Elasticsearch, Logstash, and Kibana, without running Elasticsearch yourself? Your shortlist is Elastic Cloud and OpenSearch. Want one platform for logs, metrics, and traces with fewer moving parts? That is the full-stack vendors. Want cheap log retention with on-call attached? Smaller, lighter tools. Picking the wrong category is how teams end up migrating twice.
This comparison covers seven platforms on the dimensions that decide whether leaving Logz.io takes two weeks or two quarters. Pricing gets analyzed as a model rather than a headline rate, because the rate is rarely the thing that surprises people. What surprises them is the meter.
Why leaving Logz.io is harder than swapping an exporter
The shipping layer is the easy part. If you already run the OpenTelemetry Collector, changing where telemetry goes is a config change and a redeploy. Every platform below accepts the OpenTelemetry Protocol, OTLP, or maintains a collector distribution. Nobody re-instruments an application to switch log backends in 2026.
The real switching cost sits above the pipeline, in four places. Start with query syntax. Lucene queries typed into OpenSearch Dashboards do not translate to PromQL, the Prometheus query language, or to LogQL, NRQL, or SQL, and a team that has been searching kubernetes.namespace_name:payments AND level:ERROR for three years has built up muscle memory you are about to write off. Second is parsing. Logz.io does real work at ingest through log parsing as a service, custom parsers, and field mapping. Those transformations live in Logz.io's pipeline rather than your repo, so any platform expecting structured JSON on arrival pushes that job back to you or to the Collector, which is where log management starts anyway.
Third is retention shape, and this is the one that quietly eliminates candidates. Logz.io separates hot, warm, and cold tiers plus archive and restore, priced separately: hot retention beyond the included days runs $0.03 per additional day, warm $0.015, cold $0.001 per GB per day. If you are keeping 90 days of compliance logs in cold storage for almost nothing, you are depending on a capability several options here do not have at all. Check that first, before any feature comparison.
Fourth is what the meter counts. Logz.io's log and SIEM lines bill on GB per day. Its metrics line bills on unique time series per day, capped at 6 data points per minute per series, so cardinality, meaning the number of distinct label combinations you emit, is a direct billing input rather than a performance concern. Its tracing line is priced per million spans on the consumption plan, though the subscription plan lists tracing per ingested GB. Four dimensions, four different behaviors being rewarded. Move to a per-GB platform and verbose logs get expensive while cardinality becomes free. Move to a per-signal platform and that inverts. Move to a per-seat platform and your bill starts tracking hiring instead of traffic. Any backend evaluation eventually turns on how the cost model shapes behavior, and pricing by signal versus pricing by gigabyte rewards completely different engineering habits, so that is where most of the analysis below lands.
Each tool is evaluated against these criteria:
- Log search model: full-text indexed documents, label-selected streams, or SQL over columnar storage
- Query languages per signal: how many syntaxes an engineer needs during one investigation
- Migration path: OTLP support, collector distribution, and how much ingest-time parsing you inherit
- Retention and tiering: hot, warm, cold, archive, and who decides the window
- Cardinality behavior: whether a new label costs money, and how much
- Cost model: the billing dimensions and what each one incentivizes
- Team access cost: whether adding an engineer adds a line item
- Security analytics: whether Cloud SIEM has a replacement, for teams using it
At a glance
Each column below maps to one of those criteria. The cells carry descriptions rather than checkmarks, because on every one of these dimensions the useful information is the shape of the answer.
| Tool | Log search model | Query languages | Cardinality behavior | Retention control | Cost model | Seats |
|---|---|---|---|---|---|---|
| Logz.io | OpenSearch full-text | Lucene, PromQL, trace search | Metrics billed per unique time series | Hot, warm, cold, archive; per-day add-ons | Per GB/day logs; per 1k series/day metrics; per million spans | Unlimited |
| Elastic Cloud | Elasticsearch full-text | ES|QL, KQL, Lucene | No cardinality surcharge on metrics | Search AI Lake retention, per GB/month | Per GB ingested + per GB retained, or provisioned resources | Unlimited |
| Grafana Cloud | Label-selected streams | LogQL, PromQL, TraceQL | Billed per active series | 30 days logs, 13 months metrics on Pro | Platform fee + per 1k series + per GB process/write/retain | Per active user |
| Sumo Logic | Indexed with data tiers | Sumo query language | Metrics burn credits per GB | Continuous, Frequent, Infrequent tiers | Credits on search and storage; ingest free except SIEM | Unlimited |
| Dash0 | OpenTelemetry resource model, SQL-queryable | PromQL, plus SQL over logs, spans, web events | No cardinality surcharge; volume still counts | 30 days spans and logs, 13 months metrics | Per million spans, log records, metric data points | Unlimited |
| Datadog | Ingest then selectively index | Datadog query syntax | Every OpenTelemetry metric counts as custom | 3 to 30 day index tiers, Flex storage | Per host + per GB ingested + per million indexed | Unlimited |
| New Relic | NRDB events | NRQL | No cardinality surcharge | 30 days standard, longer with Data Plus | Per GB ingested + per user | Per full platform user |
| Better Stack | SQL over ClickHouse | SQL + PromQL | Metrics billed on retained GB | Configurable, priced per GB retained | Bundles plus per GB ingest and retention | Per on-call responder |
Rates below come from each vendor's published pricing pages, verified in August 2026. The ordering groups log-analytics-first platforms, then full-stack platforms where logs are one signal among several, then the lightweight option. Nothing here is ranked.
1. Elastic Cloud
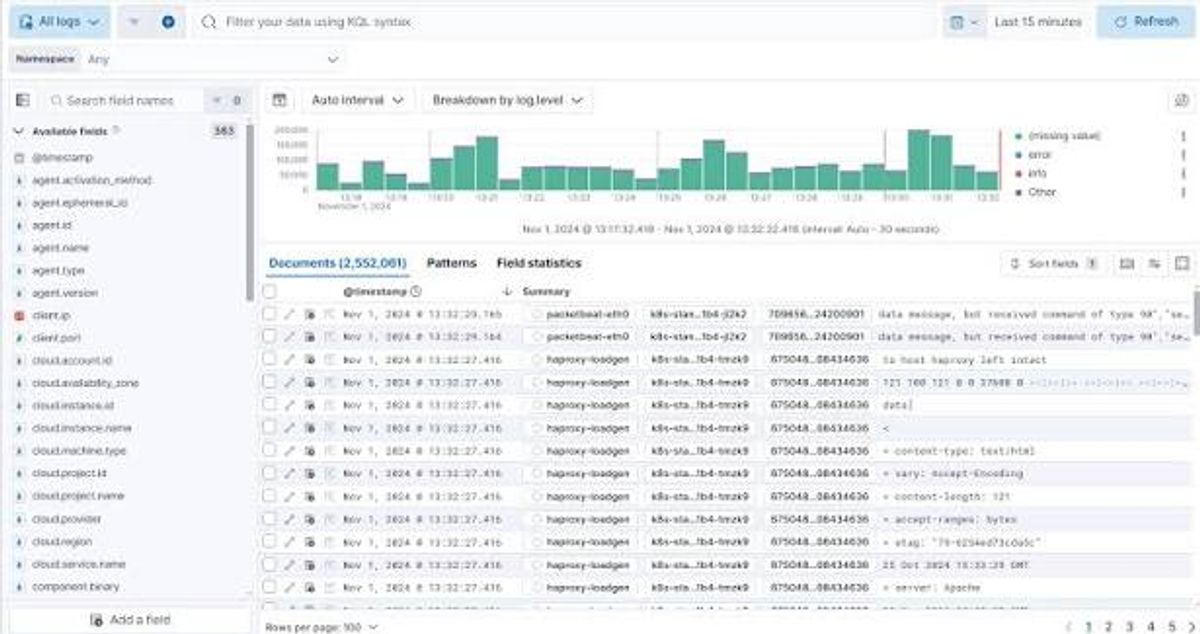
Logz.io runs OpenSearch, the Apache 2.0 fork created after Elastic changed its license. Elastic Cloud is the commercial product on the other side of that split, and the two have been diverging for five years. Elastic has since shipped ES|QL as a piped query language, rebuilt metrics storage on a columnar time series engine, and split its cloud into provisioned Hosted deployments and consumption-billed Serverless projects.
If you are leaving Logz.io because you want more Elasticsearch rather than less, this is the shortest conceptual move on the list. Index patterns, ingest pipelines, and Lucene syntax all carry over.
What's good
Search is what Elastic is built for, and it shows when an investigation starts with an unknown string, a request ID, or a field nobody thought to promote to a label. That capability is usually the thing Logz.io users are most nervous about losing, and Elastic is where it came from in the first place.
Ingest-time transformation becomes yours to own. Elasticsearch ingest pipelines parse, enrich, drop, and reroute before indexing, and they live in configuration you control, which replaces Logz.io's log parsing as a service with a version you maintain yourself.
Metrics pricing stopped punishing cardinality. Metrics stored in time series index mode bill at 25% of the standard Observability per-GB rate for both ingest and retention, and Elastic states plainly that it does not use cardinality-based or per-metric billing. Adding a Kubernetes label adds volume without triggering a surcharge tier.
Then there is the deployment escape hatch. Hosted, Serverless, and self-managed all run the same stack, so a compliance requirement that rules out software as a service does not force a replatform. None of the SaaS-only platforms below can offer that.
The catch
Elastic bills Observability Serverless on the uncompressed, fully enriched data size at the end of the ingest pipeline, before Elasticsearch compression. Elastic's own billing dimensions documentation says so. The practical effect is that the billed figure exceeds both your raw log volume and your index size on disk, so any estimate built from "we ship 200 GB a day" comes in low. Enrichment that adds fields adds billable bytes.
Operational weight is the other half. On Hosted deployments you are still making shard, replica, tier, and cluster sizing decisions, which is exactly the work Logz.io was absorbing for you. Serverless takes that away but makes retention the recurring meter, so cost control turns into trimming how long you keep things. Elastic's published serverless rates are framed as "as low as," which means they are floor rates at high volume tiers rather than what a mid-size team actually pays.
Support is a multiplier that catches buyers off guard. Standard is included, but Gold, Platinum, and Enterprise bill as 5%, 10%, and 15% of your total consumption. On a $20,000 monthly bill, Platinum support adds $2,000 that appears in no per-GB calculation anywhere.
Pricing model
Serverless Observability charges on GB ingested and GB retained per month, with a third meter for egress above 50 GB free. Logs Essentials starts at $0.07 per GB ingested and $0.017 per GB retained. Complete adds curated experiences, service level objectives, and machine learning at $0.09 per GB ingested for logs and traces, with metrics at $0.023. Hosted deployments price on provisioned resources instead, with tier baselines from $99 to $184 per month before the real cost of RAM, storage, and availability zones.
Ingest plus retention is the most legible model here, and it rewards the behavior you want: keep what you query, drop what you don't. It punishes wide, richly attributed events, because every extra field is billable volume twice over. Add-ons meter separately, including synthetic browser tests at $0.0123 per run and the Elastic Managed LLM at $4.50 per million input tokens.
The verdict
Elastic Cloud is for teams who cannot compromise on log search at volume and are willing to own ingest pipelines to get it. It is the natural landing spot if you liked what Logz.io was doing and want more control over the same thing, with a real self-managed fallback. If your reaction to "shard sizing" was to close the tab, or your telemetry is mostly OpenTelemetry traces and metrics rather than logs, look further down this list. There is a fuller treatment of that decision in 8 best Elastic Observability alternatives.
2. Grafana Cloud
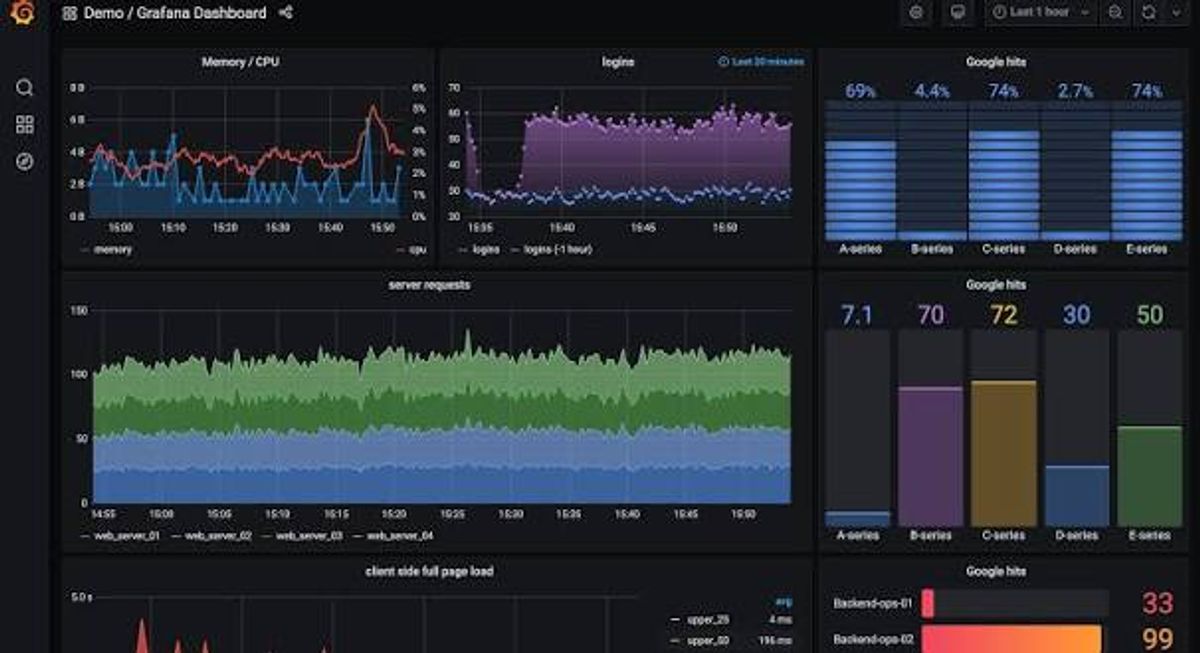
Grafana Cloud is the managed version of the stack most engineers have already met: Grafana dashboards over Mimir for metrics, Loki for logs, Tempo for traces, Pyroscope for profiles. Logz.io ships Grafana as its own metrics visualization layer, so some of this is already familiar, and PromQL carries over directly.
Understand the architecture before anything else. Each signal has its own storage engine and its own query language. That is a deliberate design choice, and it cuts both ways.
What's good
Three of these strengths follow from the open-source lineage, and the fourth is the most generous free tier in the category.
- Loki's index-free model makes high-volume logs cheap to store. Loki indexes labels and compresses the log body without indexing it, so ingesting a terabyte of chatty application logs does not build a terabyte-scale inverted index alongside it. If your Logz.io bill is driven by log volume rather than log searching, this is the largest structural saving available anywhere on this list.
- The free tier is unmatched for evaluation. 10,000 active metric series, 50 GB of logs, 50 GB of traces, 14-day retention, no expiry. You can run a real parallel evaluation against production traffic before spending anything.
- PromQL, which your team already knows. If the metrics side of Logz.io was the part you liked, this is the same query language against a Prometheus-compatible store, plus the alerting and dashboard ecosystem around it.
- Self-hosting stays live. Every component is open source, so a Grafana Cloud migration that goes badly can end in self-hosting the same backends rather than another vendor evaluation.
The catch
Label-based logging changes how you start an investigation, and this is the most common source of migration regret. Loki's speed depends on label selectors narrowing the search space before anything scans the body. An investigation that begins with an unknown string across an unknown service, which is the everyday case in OpenSearch Dashboards, becomes a slow full scan. Teams compensate by promoting more fields to labels, which drives cardinality, which is the one thing Loki handles badly. No configuration makes that go away. It is the trade.
Cardinality hits the metrics meter too, since billing counts active series, where a series is a unique metric name plus label set. A Kubernetes cluster running standard exporters can produce six figures of active series, and one new label multiplies across every existing combination. At list rates a single misconfigured high-cardinality metric becomes a four-figure monthly surprise.
Then there is the sheer number of meters. Metrics bill per thousand active series. Logs, traces, and profiles each bill in three parts for processing, writing, and retaining. Visualization bills per active user, synthetics per check, k6 per virtual user hour, and the AI assistant per active user again. Every one of those is defensible on its own, and the combination makes forecasting hard enough that first estimates land well below the first real invoice. Note also what that last meter tells you about the shape of the product: the AI assistant is sold as a separately billed per-user add-on, and the three query languages underneath it are still three query languages.
Pricing model
Grafana Cloud's published Pro rates are a $19 monthly platform fee, $6.50 per thousand active metric series at low resolution, roughly $0.45 per GB for logs and traces split across processing and writing, a per-GB monthly retention charge, and $8 per active visualization user. Advanced and Enterprise agreements start around a $25,000 annual commitment.
The model charges on the dimension Loki absorbs best, log volume, and on the dimension it handles worst, metric cardinality. Coherent if your telemetry is log-heavy and your Prometheus labels are disciplined. Actively hostile if you are metrics-heavy.
The verdict
Grafana Cloud makes sense when your logs are high-volume and mostly written to be aggregated rather than searched, your team lives in PromQL, and someone owns cardinality discipline as a real responsibility. It makes much less sense if your incident workflow starts with free-text search across everything, or if you came here hoping to reduce the number of query languages in your life rather than keep three of them. If the label-versus-index question is the specific thing you are stuck on, 9 best Grafana Loki alternatives goes deeper on it.
3. Sumo Logic
Sumo Logic is the closest thing here to a like-for-like Logz.io replacement in market position: SaaS-only log analytics with metrics, traces, and a security analytics product sharing the same pipeline. For teams on Logz.io's Cloud SIEM, this is one of very few options where security analytics is a first-class product.
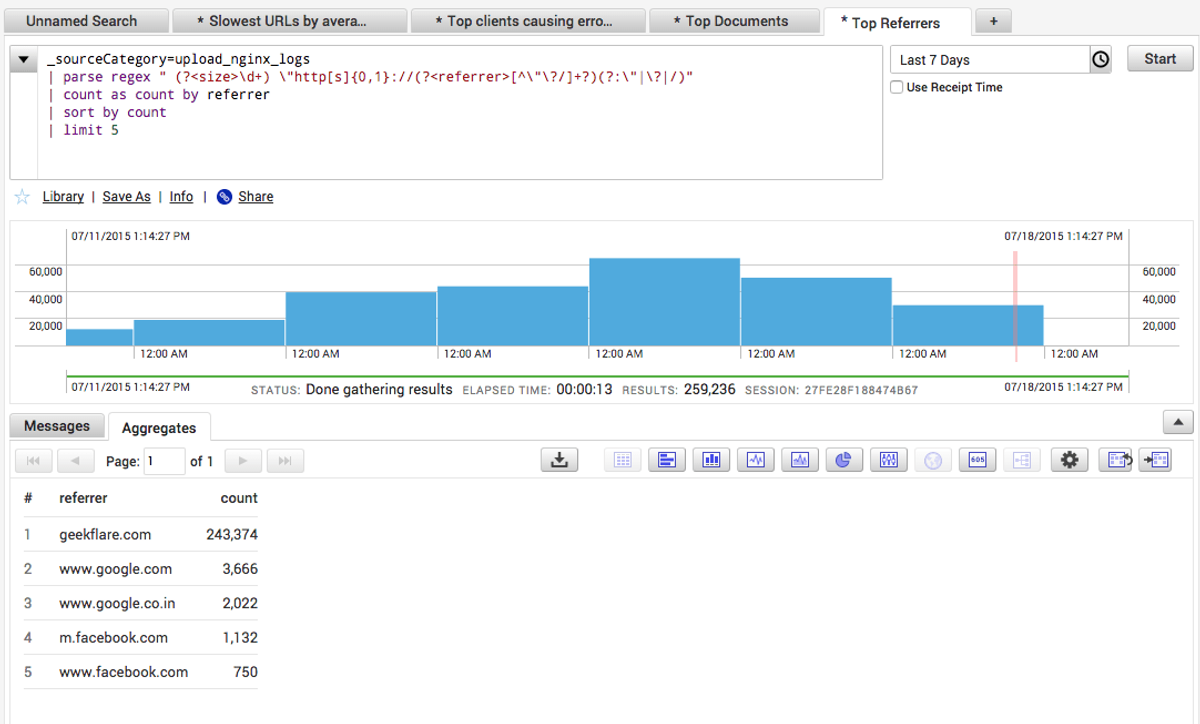
Its pricing model is also the strangest on this list, and understanding it is most of the evaluation.
What's good
Flex inverts the ingest meter. Under Flex pricing there is no cost to ingest or index log data at all. Credits get consumed by search and storage instead. If you ship large volumes you rarely query, which describes most audit, content delivery network, and debug logs, this produces a structurally different bill from anything else here.
The data tiers do real work rather than marketing work. Continuous, Frequent, and Infrequent trade ingest cost against search cost, with Infrequent scans running at roughly 0.016 credits per GB scanned. Routing happens through partitions and metadata expressions, so you can move whole classes of data without touching the application.
Cloud SIEM covers the use case most alternatives drop entirely: detection rules, signals, insights, threat intelligence, and MITRE mapping, all in the same platform as your operational logs. If Logz.io's SIEM is in your renewal, this is the entry that replaces it directly.
Seats are not a billing dimension. Access runs on role-based access control rather than license count, so giving the whole engineering organization query access does nothing to your bill.
The catch
Free ingest does not mean the meter disappeared. It moved. Credits get consumed by scanned volume, which makes cost a function of how much your team searches and how wide their time ranges are. A heavy-query security operations center, a wall of dashboards refreshing against broad windows, or one engineer who habitually searches 30 days when 30 minutes would do all convert straight into spend. That is harder to govern than a data cap, because the thing you need to change is investigation habits.
Cloud SIEM is the documented exception to free ingest. Logs ingested through Cloud SIEM do consume credits, and it is a paid add-on gated to the Enterprise Security and Enterprise Suite plans. Sending data to SIEM that does not need security analytics is the fastest way to drain a credit pool.
There is no published per-GB list price. Honest about the model, unhelpful when you want to sanity-check a quote without a sales conversation. Sumo publishes the Cloud Flex Credit schedule, which defines what a credit buys on each meter and lists region uplifts of 10% to 20% outside the US. What it does not publish is the dollar value of a credit, which varies by plan, region, and payment terms. Get that number in writing before you model anything, because every cost estimate for this platform is downstream of it. Sumo's query language is also its own thing, so your Lucene knowledge does not transfer.
Pricing model
Everything runs from a single annual credit pool that every product draws against. Ingest and indexing are free for non-SIEM logs. Credits get consumed by search, storage, metrics ingest, SIEM ingest, and AI agent activity, at burn rates that vary by data tier. Plans run Essentials, Enterprise Operations, Enterprise Security, and Enterprise Suite, with Flex and the Infrequent tier gated to specific ones.
The behavior this rewards: keep everything, search narrowly. That is close to the opposite of what a per-GB platform teaches, better for compliance retention, worse for exploratory debugging. The credit pool also creates a forecasting problem in reverse, since you commit to a pool up front and if your query patterns shift mid-year, the pool is what runs out.
The verdict
Sumo Logic pays off when you keep far more log data than you search, and especially when Cloud SIEM is part of what you are replacing. Flex is the best fit here for high-retention, low-query-rate data. It goes badly for teams who query constantly and broadly, and for anyone who needs to model costs precisely against a published rate before signing anything.
4. Dash0
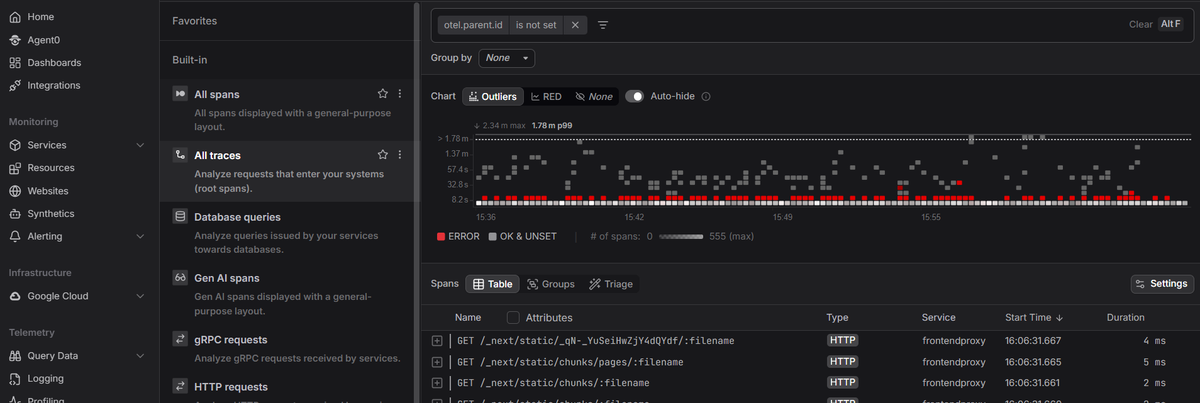
Dash0 treats OpenTelemetry as the operating model rather than one supported input format. Telemetry arrives as OTLP and gets queried in the shape it arrived in, so resource attributes stay resource attributes and semantic conventions are the schema rather than something normalized away at ingest. Dashboards are Perses-compatible, and queries run through PromQL and SQL rather than a syntax invented for the platform.
For a team leaving Logz.io that already runs the OpenTelemetry Collector, that collapses three shipping tokens and per-signal exporters into one OTLP endpoint.
What's good
Metrics, logs, traces, and web events answer to two query surfaces, and your team probably knows both already. PromQL covers metrics and reaches into logs and traces through synthetic metrics, while Dash0 SQL queries logs, spans, and web events directly, with joins across signals and aggregation on arbitrary attributes. Moving from an aggregate to the underlying telemetry does not mean picking up a third syntax on the way, which is the specific problem a three-engine platform creates.
Attribute richness costs nothing. Billing counts data points, spans, and log records rather than bytes, so adding a useful attribute to a span creates no new billing dimension. Synthetic metrics, which compute aggregations over existing logs and spans on the fly, are not billed at all.
There are no per-seat costs and no base platform fee, so unlimited users at every volume. That matters most for teams who had been rationing access to keep a bill down.
Cost controls ship in the product: monthly budget limits, spam filters that stop noisy telemetry from being stored, and a cost forecast in the pricing model.
The catch
There is no SIEM. Agent0 Automations ships security policy checks and scheduled scans that look for sensitive data exposure in logs and traces, which is useful and is a long way short of detection rules, signals, threat intelligence feeds, and MITRE mapping. Teams replacing Logz.io's Cloud SIEM need a dedicated tool, and this list has two better answers for it. If your actual concern is sensitive data reaching any backend at all, that job belongs in the Collector through redaction whichever platform you pick. Dash0 is also SaaS only, so a strict on-premises requirement rules it out whatever else is true.
The metric data point meter deserves looking at before you commit. Transparent counting has definite pros, but is not the same as automatically cheap, and cardinality that costs nothing per label still shows up as volume. OTLP keeps instrumentation and export portable, and dashboards, alert rules, spam filters, and investigation workflows are switching cost here like anywhere else. Perses compatibility reduces that for dashboards. It does not eliminate it.
The integration catalog is younger than Elastic's or Datadog's decade-old libraries. For a Kubernetes and OpenTelemetry estate the available integrations cover the common ground, but a long tail of legacy agents and appliances will have no prebuilt path.
Pricing model
Purely consumption-based, with no per-seat, per-host, or base platform fee. Metric data points are $0.20 per million. Spans, span events, log records, and web events are $0.60 per million. Synthetic API checks are $0.20 per thousand runs, and Agent0 credits are $0.60 each, where a health check consumes a fraction of a credit and a full root cause investigation or a drafted pull request runs one to two. Agent0 is Dash0's autonomous production AI, priced on task-based credits rather than bundled in as a platform feature. Write actions such as opening a pull request are off by default and get allowed per automation, so how much autonomy it has is something you set rather than something you inherit.
Counting events instead of gigabytes changes which behaviors cost money. Verbose structured logs with rich attributes are cheap, because attribute count is not a dimension. Chatty services emitting many small events are expensive, because event count is the whole meter. That inverts Logz.io's GB-per-day logs line and roughly matches its per-million-spans tracing line. Scaling is linear and the rates are published, so you can estimate the bill from a data point count before migrating anything. What the model will not do is rescue you from high event volume.
The verdict
Dash0 fits teams who have committed to OpenTelemetry and want the backend to reflect that rather than translate it, where querying every signal without a per-signal language would collapse a real workflow problem, and where 30-day operational retention covers what you actually query. Long or tiered log retention, a SIEM requirement, and self-hosting are all reasons to rule it out early.
5. Datadog
Datadog is the platform most Logz.io evaluations end up benchmarking against, usually because somebody on the team used it at a previous company and remembers both the product quality and the invoice. The breadth is real: infrastructure, application performance monitoring, logs, real user monitoring, synthetics, security, database monitoring, and a catalog of integrations that mostly work on the first try. Bits AI now reads your source code during investigations, and its Dev Agent generates pull requests, generally available in Error Tracking and in preview across the rest of the platform.
It also has the most modular pricing on this list, spread across a dozen separately metered product lines.
What's good
Two of these are cost levers and two are capability advantages, and the capability advantages are the harder ones for any competitor to close.
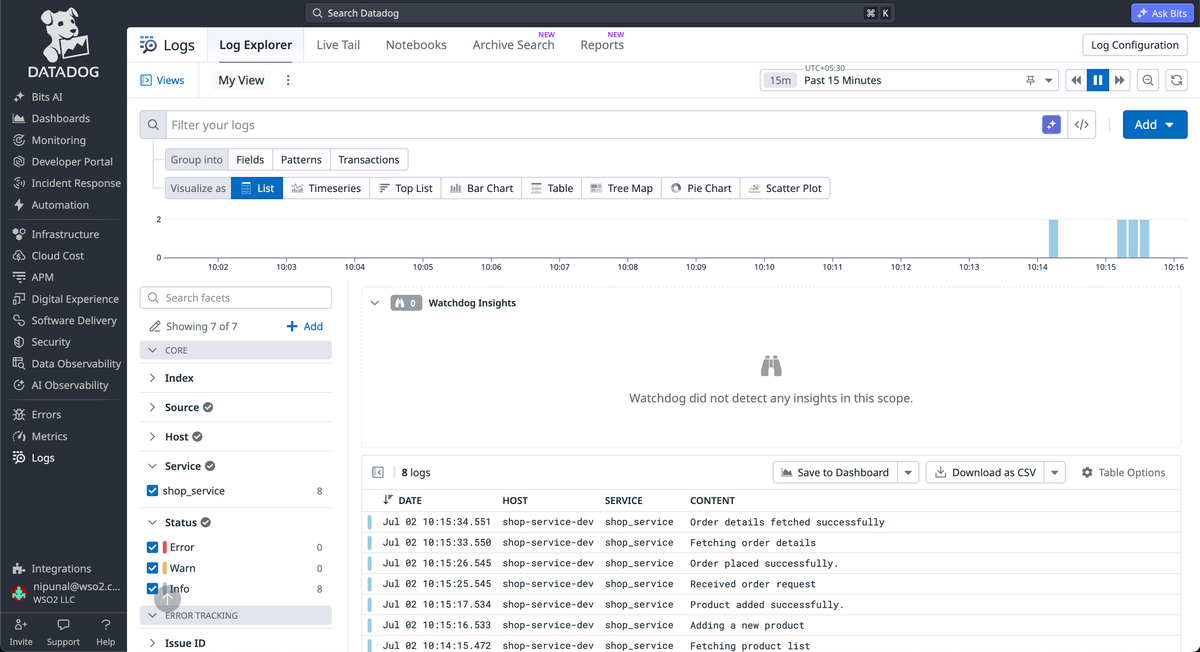
- Logging without Limits decouples ingest from search. You pay $0.10 per GB to ingest, parse, tag, and archive everything, then choose which subsets to index for search and alerting. If your Logz.io cost comes from data you ingest defensively rather than query, this reaches the same insight Sumo's Flex model does, from the other direction.
- Flex Logs makes long retention affordable. Storage runs $0.05 per million events per month against $1.70 per million for standard indexing, a gap wide enough that tier selection is usually the single biggest lever in a Datadog bill.
- Cross-signal correlation is well built and heavily used. Going from a metric spike to the traces behind it to the logs inside those traces is a well-worn path with a lot of engineering behind it.
- The integration catalog is the widest available. For a heterogeneous estate carrying legacy components, that is a practical advantage no OpenTelemetry-native platform can match yet.
The catch
Custom metrics are where OpenTelemetry adopters get hurt. Every OpenTelemetry metric counts as a custom metric by default, Pro includes 100 per host, and overage runs $0.05 per metric per month. One metric carrying a customer or tenant tag across a few thousand values produces tens of thousands of custom metrics from a single instrumentation decision. Coming from Logz.io, where custom and system metrics are explicitly priced the same, this is a whole class of cost with no equivalent in your current bill.
Logs bill twice for the same data, once to ingest and again to index. The stated remedy is selective indexing, which works right up until the incident where the logs you need are in the 80% you excluded. That trade-off is the product decision, and it exists to be managed rather than solved.
Host-based billing interacts badly with elastic infrastructure. Charges follow a high-water mark, so a traffic spike or a load test can set the month's cost, and containers count as fractional hosts in ways that surprise people running dense Kubernetes nodes. There is also a structural point here rather than an implied one: Datadog's revenue scales with the volume of data you send it, so the incentive to help you send less runs against the business model. On OpenTelemetry, Datadog is compatible rather than native, so OTLP data gets translated into Datadog's own model on arrival, and what comes back out is Datadog's shape.
Pricing model
Infrastructure Monitoring starts at $15 per host per month on annual billing, application performance monitoring at $31. Logs are $0.10 per GB ingested plus $1.70 per million events indexed at 15-day retention, or $2.50 at 30 days. Custom metrics, real user monitoring, synthetics, Cloud SIEM, and database monitoring each meter separately, and annual commitments run roughly 20% below on-demand. Current rates live on the pricing page.
Charging on infrastructure count, data volume, and searchability independently means three different teams can inflate the bill without ever talking to each other. The model asks for discipline on hosts, on log verbosity, and on cardinality simultaneously, and most organizations manage two of the three. Hence Datadog bills that commonly land at a multiple of the first estimate, which says less about the prices than about how many dimensions there are to forecast.
The verdict
Datadog earns its price when breadth and integration coverage are what you are buying, when your estate is heterogeneous enough that OpenTelemetry-native platforms cannot cover it, and when someone in platform or financial operations owns cost governance as a real part of their job. If your instrumentation is OpenTelemetry-first and metric-heavy, custom metrics will dominate the bill, and predictable monthly spend is not what this platform sells.
6. New Relic
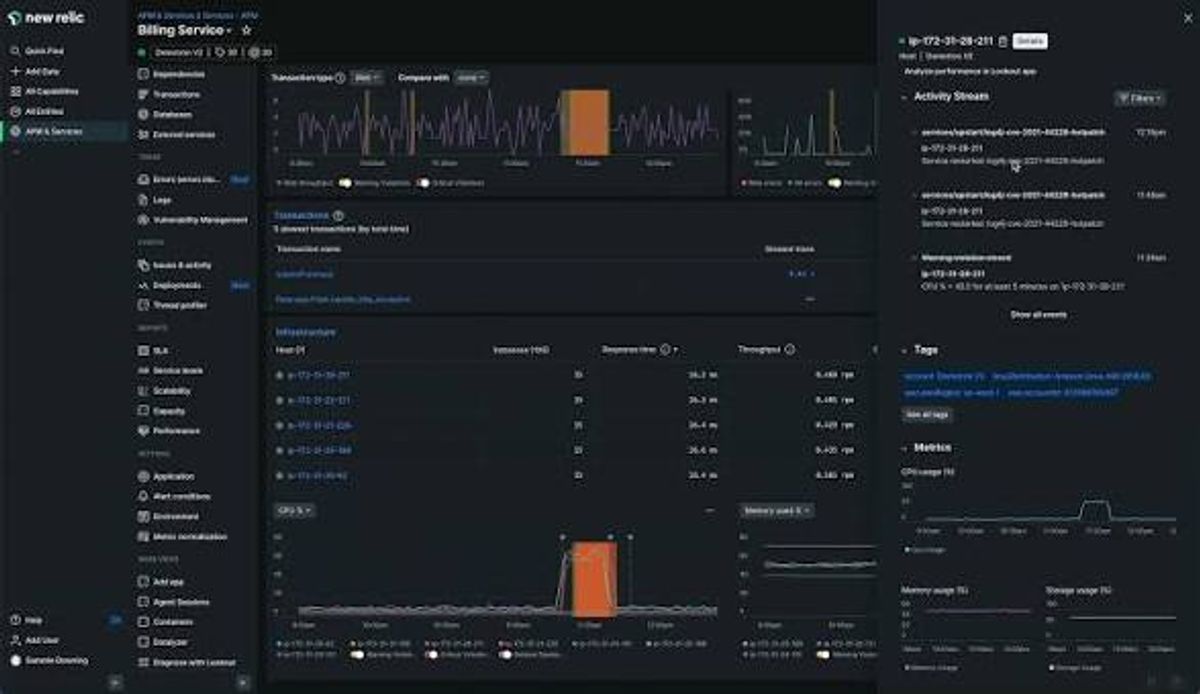
New Relic runs everything through one telemetry database and one query language. Metrics, events, logs, and traces land in NRDB, its single datastore, and come back out through NRQL, its query language, so a single investigation involves exactly one syntax. For teams tired of moving between Lucene, PromQL, and trace search inside Logz.io, that consolidation is the whole appeal. They have also been building on top of it: an SRE Agent for autonomous investigation reached general availability in February 2026, alongside a no-code platform for building custom agents and a Knowledge capability that fuses live telemetry with past incidents and system changes.
Its cost structure is the most distinctive here, because a large share of the bill has nothing to do with telemetry volume.
What's good
One data model and one query language, which very few platforms deliver. NRQL over NRDB covers all signal types, and pivoting from an alert to a trace to the surrounding logs happens without a context switch.
100 GB of free ingest per month, permanently, which covers a small production estate outright and makes parallel evaluation against real traffic straightforward.
Native OTLP ingest is the recommended path for OpenTelemetry data, so a Collector-based migration off Logz.io is a config change rather than a re-instrumentation.
Unlimited hosts and CPUs at no additional charge, which removes the elastic-infrastructure problem that host-based pricing creates elsewhere. Scaling out during a launch does not move the bill at all.
The catch
Per-seat pricing decides this evaluation, and it can go wrong in one specific way. Standard caps you at five full platform users. The sixth engineer who needs full access forces the whole account onto Pro, where full platform seats run hundreds of dollars each per month. That single boundary is the sharpest cost cliff in observability pricing, and it turns a hiring decision into a platform decision. Note the direction of travel: on Logz.io your users are unlimited, and here your bill starts tracking headcount.
Seat tiers also shape who gets to see production at all. Basic users are free but cannot use application performance monitoring, infrastructure, or browser monitoring. Core users at $49 can query but cannot configure. Teams handle this by rationing access, which cuts against everyone being able to debug their own service. Billing runs on the highest tier a user reached during a calendar month with no proration, so a one-day upgrade costs a full month.
NRQL is its own lock-in surface. OTLP keeps your instrumentation portable, and every dashboard, alert policy, and saved query you build still becomes NRQL against New Relic's entity model. Same class of switching cost as any proprietary query language, and it belongs in the migration estimate for a move you might one day reverse.
Pricing model
Two independent dimensions: data ingested and users. Every account includes 100 GB per month free, after which Original Data bills at $0.40 per GB and Data Plus at $0.60 with longer retention and compliance features. Users are Basic at no cost, Core at $49 per month, and full platform at $99 on Standard capped at five, or several hundred per user on Pro. Rates are on the pricing page.
The interaction to model is that these two dimensions grow at unrelated rates. A team of 4 sending 5 TB a month and a team of 40 sending 500 GB end up with opposite bills, and only one of them resembles the example the pricing page implies. Do the multiplication before you go any further: engineers needing full access times the per-seat rate, against monthly volume in GB times the per-GB rate. Whichever term dominates is your real decision. Small teams with heavy telemetry come out well. Large teams with modest telemetry do not.
The verdict
New Relic works for teams small enough to keep the seat count under control, who want one query language over one datastore, and whose volume makes the free 100 GB meaningful. Large engineering organizations where everyone needs production access should run the seat math first, because it will settle the question before any feature comparison gets a chance to.
7. Better Stack
Better Stack is the lightest option here and the most different in scope. Log management, traces, and metrics sit alongside uptime monitoring, on-call scheduling, incident management, and status pages in one product. Logs and traces live in ClickHouse and get queried with SQL or PromQL, so both the analyst and the Prometheus-native engineer have a way in. There is also an AI SRE that investigates during incidents and a generally available MCP server, which lets Claude or Cursor query your telemetry directly.
The target buyer is specific: teams paying for Logz.io plus a separate on-call tool who would rather have one bill.
What's good
The appeal is a low floor on both price and learning curve, plus a scope that covers the on-call tool you are probably also paying for.
- Two query languages, and you likely know one. Anyone who can write a
WHEREclause searches production logs on day one, and PromQL is there for metrics if your team came from Prometheus. A lower ramp than Lucene, LogQL, or NRQL. - Ingest and retention rates are among the lowest published. Logs and traces ingest around $0.15 per GB, with additional retention at roughly $0.08 per GB per month, well under most of this list.
- On-call and status pages come in the box. Replacing Logz.io plus PagerDuty plus a status page vendor with one product removes two renewals and two integrations.
- You can host log data in your own bucket. Available as a paid option, unusual at this price point and useful for data residency requirements.
The catch
Instrumentation goes a different route, and the trade is worth understanding before you commit. Better Stack leads with an eBPF collector that runs at kernel level and instruments services without SDKs or code changes, discovering services and tracing PostgreSQL, MySQL, Redis, and MongoDB queries automatically. For a polyglot estate that is genuine coverage no per-runtime auto-instrumentation matches. What you give up against Logz.io is the packaged service and cluster analysis of App 360 and Kubernetes 360: breadth of capture, less depth of curated workflow. If those two views are load-bearing in how your team investigates, you will feel their absence during an incident.
Metrics bill on a different basis from logs and traces, on retained GB per month, at a rate that varies by region: $0.50 per GB in the EU, $0.75 in US East and West, and $1.75 in Singapore. Singapore costs more than three times the EU rate for identical data, a spread wide enough to influence where you deploy.
The add-on list runs long, and this is where a cheap-looking quote grows. On-call responders are licensed individually. Monitors come in packs. Audit logs and single sign-on enforcement are a $250 monthly bundle, non-Google single sign-on is charged per user, advanced Slack and Teams incident workflows are per responder, and status page password protection is per page. Query boost bills per GB scanned on top of storage. Individually these are all small charges, and collectively they are the distance between the headline rate and the invoice, which is why this pricing page rewards reading line by line.
There is no SIEM, and Better Stack says so themselves rather than leaving you to find out: active threat detection, security orchestration, and entity analytics all need a dedicated tool alongside it. Cloud SIEM users should look elsewhere.
Pricing model
Telemetry sells as bundles with per-GB overage, alongside per-responder licensing for the incident side. Bundles run up to roughly $500 per month for 700 GB each of logs, traces, and metrics with 30-day log retention. Past that, logs and traces bill around $0.15 per GB ingested plus about $0.08 per GB per month retained, metrics on retained GB at the regional rate, error tracking per exception above the included allowance, and responders at $29 per month on annual billing.
Two meters on different bases, GB for logs and retained GB for metrics, plus a per-seat dimension for on-call, gives you three things to forecast. The per-GB rates are low enough that this stays the cheapest entry here at modest volumes. What it does not scale into gracefully is a large on-call rotation combined with high telemetry volume, where responder licensing and overage stack on each other.
The verdict
Better Stack suits small and mid-size teams with moderate log volume, engineers who want SQL and PromQL rather than a proprietary syntax, and organizations where consolidating on-call and status pages into the same bill has real value. Curated Kubernetes and service analysis, security analytics, and a large on-call rotation each push you elsewhere, the last one because per-responder pricing eventually outgrows the telemetry saving.
Which Logz.io alternative fits your situation
You liked the OpenSearch experience and want more control. Elastic Cloud. Full-text search stays your primary investigative tool, ingest pipelines replace log parsing as a service, and self-managed deployment is a real fallback. Budget more engineering attention than Logz.io needed, and remember that billing counts uncompressed enriched bytes.
Your bill is driven by log volume you rarely query. Sumo Logic under Flex, or Datadog with Flex Logs. Both decouple keeping data from searching it, from opposite directions. Sumo makes ingest free and charges for scans. Datadog charges a low ingest rate then charges again to index. Choose based on whether your team searches narrowly or broadly.
Cloud SIEM is part of what you are replacing. Sumo Logic or Datadog, the only two here with a SIEM built on the same pipeline. Confirm SIEM ingest terms in writing, since it is the exception to Sumo's free-ingest model and a separately metered product at Datadog.
You are metrics-heavy with disciplined Prometheus labels, and your logs get aggregated more than searched. Grafana Cloud. The free tier makes evaluation cheap and PromQL transfers directly. Give cardinality ownership to a named person before you migrate rather than after the first invoice.
You have committed to OpenTelemetry and want to stop switching query languages mid-incident. Dash0. OTLP in, PromQL and SQL out, no per-seat or per-host dimension, and attribute richness that costs nothing extra. Verify that 30 days of log and span retention covers what you actually query, because there is no cold tier behind it. The Datadog migration guide is the closest thing to a step-by-step if you want to see the shape of that work before committing to it.
You are a small team with heavy telemetry and want a single data model. New Relic. The free 100 GB and NRQL over NRDB are a strong combination, and unlimited hosts kill the elastic-infrastructure problem. Do the seat math first. The five-user Standard cap will decide more of this than any feature.
You want log management and on-call in one bill. Better Stack. Lowest published per-GB rates here, SQL and PromQL querying, eBPF instrumentation that covers every runtime, and incident management included. Read the add-on list carefully and check the metrics rate for your region.
Final thoughts
These seven platforms represent four different bets about what observability data actually is. Elastic and Sumo Logic treat it as searchable documents and price on volume or on scans. Grafana Cloud treats each signal as its own system with its own engine and language, cheap for logs and punishing for cardinality. Datadog and New Relic treat it as a platform product, priced on infrastructure count and seats respectively, where breadth is the value and forecasting is the cost. Dash0 and Better Stack are the newer bets, wagering that a single consistent data model matters more than catalog size.
None of that resolves into a ranking, because the deciding factor is usually structural rather than qualitative. Keep far more data than you search and Flex-style pricing beats everything else here, no matter how the feature comparison goes. Run a large engineering organization where everyone needs production access and per-seat pricing eliminates candidates before you evaluate them. Hold 90 days of compliance logs in a cold tier and retention capability filters your shortlist before anything else does.
The gap in Logz.io migrations is the query surface. Three engines with three languages is why an investigation stalls at the boundary between a metric spike and the logs underneath it, and most alternatives here reproduce that split instead of fixing it. The market's current answer, OrionIQ included, is to put an agent on top of the seams: let something else hold the three query languages in its head on your behalf. That works, and it leaves the seams in place for everything the agent does not do. Dash0 goes at the layer underneath instead, with OTLP as both the ingestion and storage format, PromQL for metrics, and SQL that joins logs, spans, and web events in a single query, so following an aggregate down into the telemetry underneath it needs no new syntax, whether an agent or a person is doing the following. What you trade for that is retention depth and a SIEM, which makes it a fit for teams whose data is operational and OpenTelemetry-shaped rather than archival.
Whichever way you go, run a parallel evaluation against real production traffic for two weeks before you commit. Every platform here looks predictable on its pricing page. The meter that gets you is always the one you did not model. If you want to go deeper on what to look for in a backend before you shortlist anything, what makes a good OpenTelemetry backend covers the evaluation criteria in more detail than a comparison article can.
Sign up for a free Dash0 account with 14 days of unlimited access. No credit-card required.