Grafana Loki is a horizontally scalable log aggregation backend built around labels, compressed chunks, and LogQL. It is a natural fit for Kubernetes teams already using Grafana and Prometheus because the operational model and query syntax feel familiar, while indexing metadata rather than every log line can keep storage costs under control.
You'll usually start evaluating Grafana Loki alternatives when you need faster full-text search across arbitrary fields, less responsibility for running a distributed logging system, or one managed workflow for logs, traces, and metrics. Other common reasons are easier high-cardinality analysis, longer or more flexible retention, security analytics, and a billing model that maps more cleanly to ingest, stored data, or telemetry records. The best replacement depends on whether you want a log database, a full observability platform, or an enterprise analytics system.
Quick picks
If you only have a minute, start here: match your team to the tool it fits best, then read the full section below for the tradeoffs behind that pick.
| Tool | Best fit |
|---|---|
| Elastic Observability | Teams that need mature full-text search, flexible pipelines, and deep log analytics |
| OpenSearch | Organizations that want Apache 2.0-licensed search infrastructure and control over deployment |
| Dash0 | OpenTelemetry-standardized teams that want managed logs correlated with traces and metrics |
| Datadog | Companies consolidating observability into a broad SaaS platform with a large integration catalog |
| Splunk Platform | Large enterprises combining operational log analysis with security and compliance use cases |
| Better Stack | Developer teams that want logs, telemetry, on-call, and incident response in one service |
| SigNoz | Teams seeking an OpenTelemetry-native, ClickHouse-backed platform they can self-host |
| OpenObserve | Cost-conscious teams comfortable with SQL and object-storage-backed log analytics |
| VictoriaLogs | Operators who want a lean, log-focused backend with simple self-hosted deployment |
What to look for in a Grafana Loki alternative
Decide whether LogQL-style label selection is enough for you, or whether your engineers need indexed full-text search, SQL, or unrestricted filtering across high-cardinality fields.
Before you commit, inventory your Promtail or Alloy pipelines, LogQL queries, Grafana dashboards, alert rules, saved views, and retention policies. Changing the destination is often easier than recreating the investigation workflow you already depend on.
Weigh deployment responsibility carefully. A self-hosted database preserves infrastructure and data control, but you take on scaling, upgrades, backups, and incident ownership yourself. Managed services trade that work for a vendor bill and fixed deployment boundaries.
If your responders routinely pivot from a log line to its trace, service, Kubernetes workload, or metric change, test those transitions yourself with real telemetry rather than comparing signal checklists on a spec sheet.
Validate regional storage, encryption, role-based access control (RBAC), tenant isolation, private connectivity, redaction, archive access, and whether compliance retention needs to live inside the platform.
Model your normal and incident-period volume. Compare ingest bytes, retained bytes, event counts, query scans, compute, retention, and add-ons: the cheapest unit price can still produce the least predictable bill.
1. Elastic Observability
Best for: Teams replacing Loki because they need mature full-text search and flexible log processing.
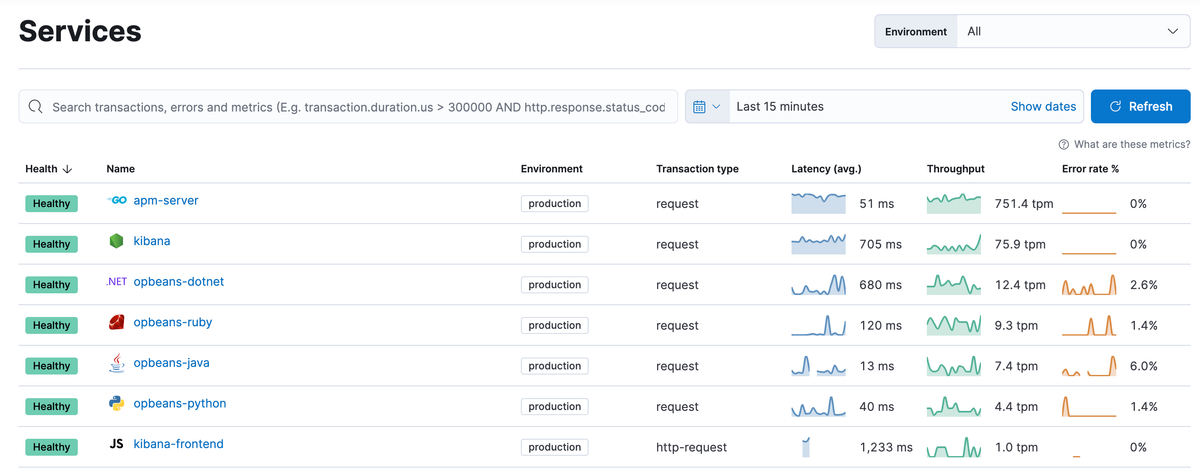
Elastic Observability treats logs as searchable documents in Elasticsearch rather than label-selected streams with unindexed content. That makes it a strong choice when investigations start with unknown text, user IDs, request IDs, or fields that were not promoted to labels. Elasticsearch ingest pipelines can parse, enrich, remove, and reroute fields before indexing, while data streams and lifecycle controls support different retention policies.
You can self-manage the stack, buy hosted Elastic Cloud, or use Elastic's serverless Logs Essentials offering. The serverless pricing model separates ingest, retained data, and egress; hosted deployments are driven more by provisioned resources. Both models are understandable, but total cost still depends on indexing choices, replicas, retention, and query load.
The tradeoff is operational and conceptual weight. Self-hosted Elasticsearch requires shard, mapping, tier, and cluster discipline, while a Loki migration also means translating LogQL, dashboards, and alerts into Elastic workflows.
Worth exploring if: Full-text search and adaptable ingestion pipelines matter more than preserving the Grafana stack.
Give it a pass if: You want a narrow, low-touch log backend and do not have Elastic operational skills.
2. OpenSearch
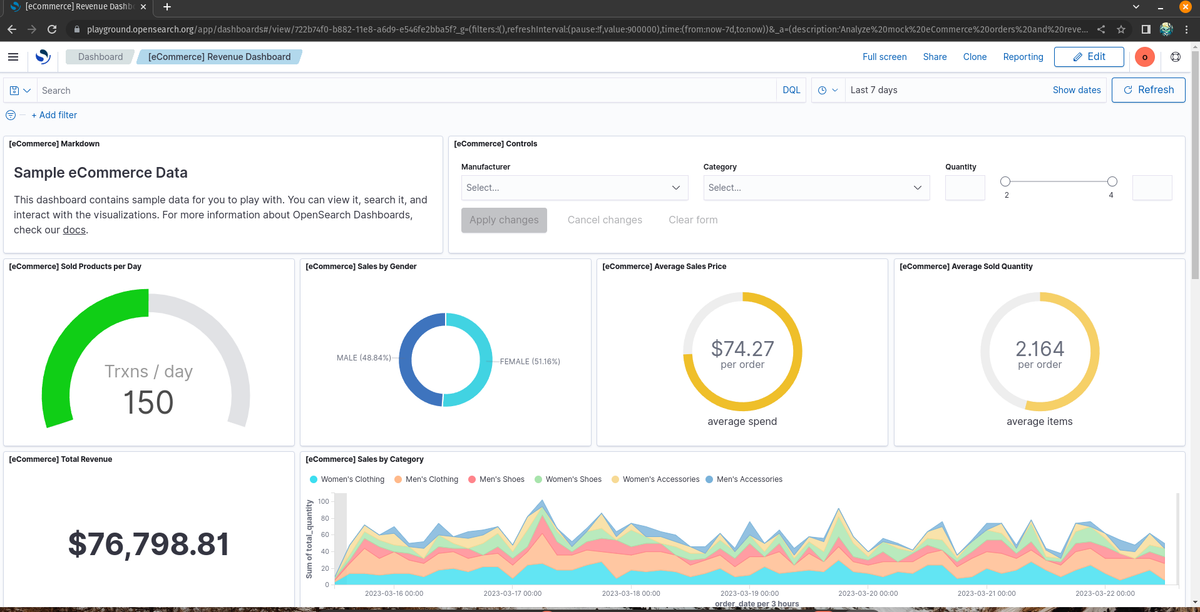
Best for: Teams that want open-source full-text analytics with broad deployment control.
OpenSearch combines an Apache 2.0-licensed search engine, OpenSearch Dashboards, and Data Prepper for ingestion and transformation. Its log workflows support Lucene-style search, SQL, Piped Processing Language (PPL), and visual exploration, so engineers can query arbitrary fields without designing Loki labels around every future investigation.
The software is free to self-host. A managed deployment such as Amazon OpenSearch Service bills the infrastructure underneath it: instances or compute units, storage, data transfer, and optional warm or serverless capacity, rather than charging a single log-ingest rate. See Amazon OpenSearch Service pricing for the current dimensions. That can be predictable for teams already skilled at capacity planning, but it makes engineering efficiency part of the bill.
OpenSearch is not a drop-in Loki clone. Data Prepper, index mappings, shard counts, lifecycle policies, and cluster capacity all need ownership. Its observability stack is becoming more integrated, but the core remains a general-purpose search system, which is an advantage for flexible analytics and a burden if you only want simple log storage.
Worth exploring if: You need full-text search, permissive licensing, and the option to run on your own infrastructure.
Give it a pass if: Your team wants to eliminate search-cluster operations rather than take them on.
3. Dash0
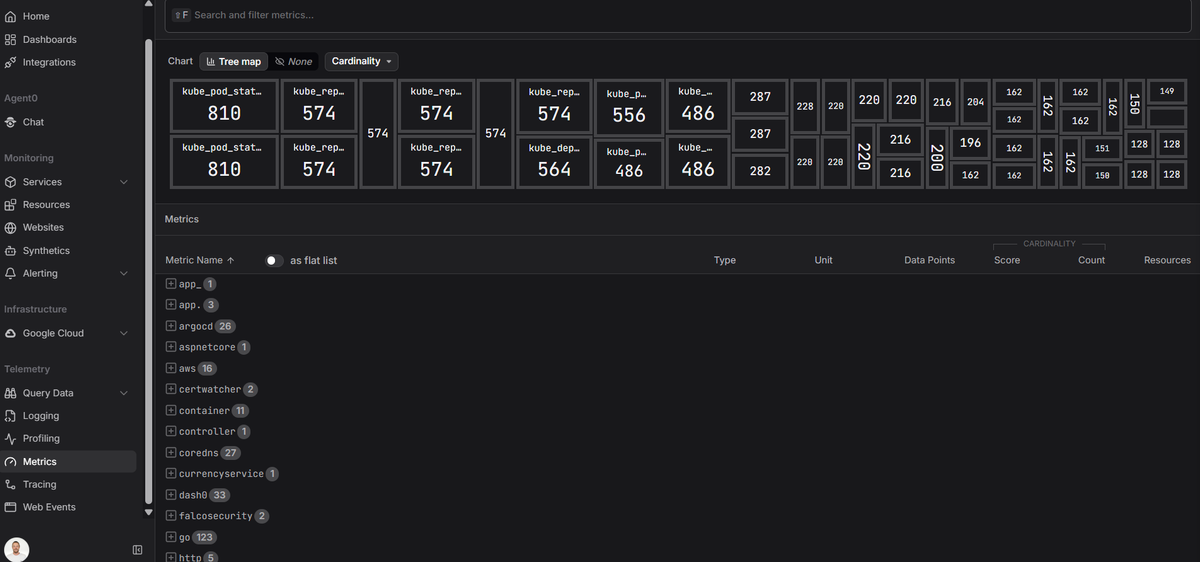
Best for: OpenTelemetry-first teams that want managed log, trace, metric, and Kubernetes investigation.
Dash0 ingests logs as OpenTelemetry log records and keeps their resource and trace context available in the same investigation workflow. Its Log Explorer supports record filtering, grouping, saved views, severity analysis, and pattern clustering; OpenTelemetry Protocol (OTLP) trace and span IDs provide direct log-to-trace pivots for OTel-instrumented services, without a separate correlation scheme.
Pricing is per million log records rather than per ingested or indexed gigabyte, with no host, seat, or base platform meter. This is easy to forecast when event counts are stable and rich attributes do not create an extra charge, but verbose applications that emit many small records can cost more than a byte-based model. Ingestion filters can drop known noise before it is stored and billed.
Dash0 is a managed SaaS, not a self-hosted Loki replacement, and its fixed log-retention window will not satisfy every compliance archive. Your OpenTelemetry instrumentation remains portable, but saved views, alerts, dashboards, and investigation habits still create migration work.
Worth exploring if: You want to retire Loki operations and standardize collection on OTLP.
Give it a pass if: You require an on-premises backend.
4. Datadog
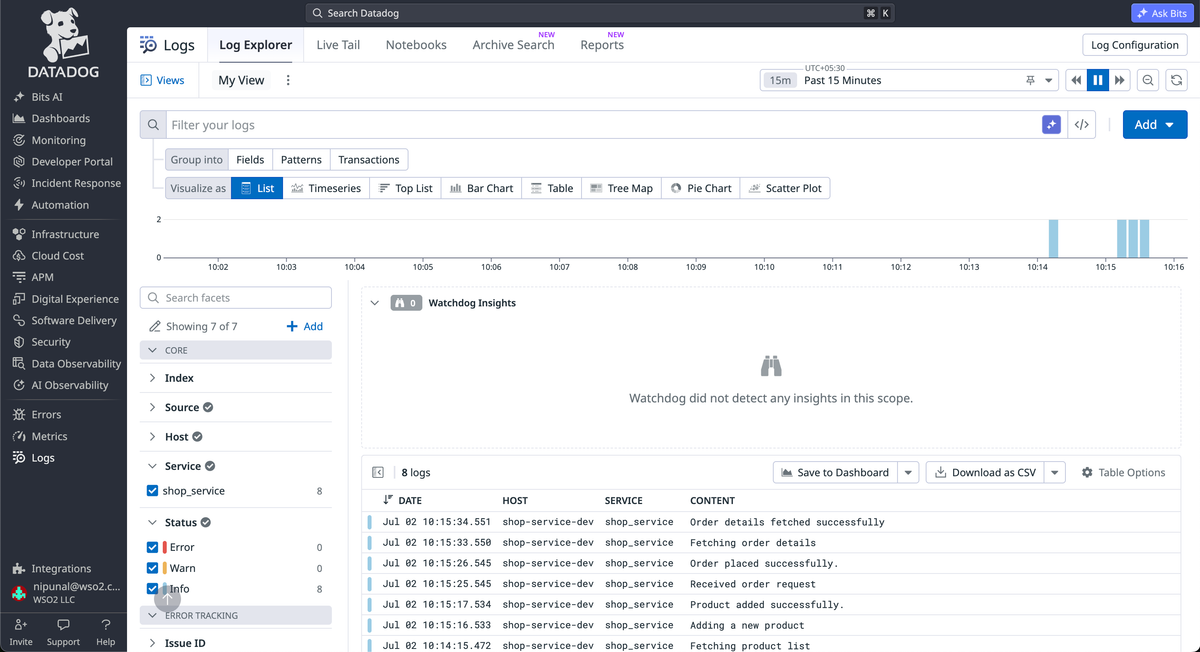
Best for: Organizations standardizing infrastructure, application performance monitoring (APM), logs, security, and incident telemetry under one SaaS vendor.
Datadog Log Management is the broad-platform alternative. Logs can be processed, enriched, searched, monitored, correlated with traces and infrastructure, and routed to customer-owned archives. Standard indexing serves frequently queried operational data, while Flex Logs and Archive Search offer separate paths for longer-lived or less frequently accessed events.
That breadth is useful when Loki is only one part of a fragmented toolchain. It also expands the billing surface. Datadog meters log ingest by uncompressed volume, standard indexing by events and retention, Flex storage and compute separately, archive scans by data scanned, and other observability products through their own units. The public pricing page and free trial make the model visible, but an elastic Kubernetes environment still needs careful forecasts for log volume, event size, retention, and add-ons.
Datadog supports OpenTelemetry ingestion, but many of its highest-leverage workflows remain Datadog-specific. Moving collection is easier than moving monitors, dashboards, archive policies, and investigation habits.
Worth exploring if: Platform consolidation and integration breadth justify a multi-product SaaS commitment.
Give it a pass if: Your main goal is a narrow logging bill or a self-hosted, vendor-neutral backend.
5. Splunk Platform
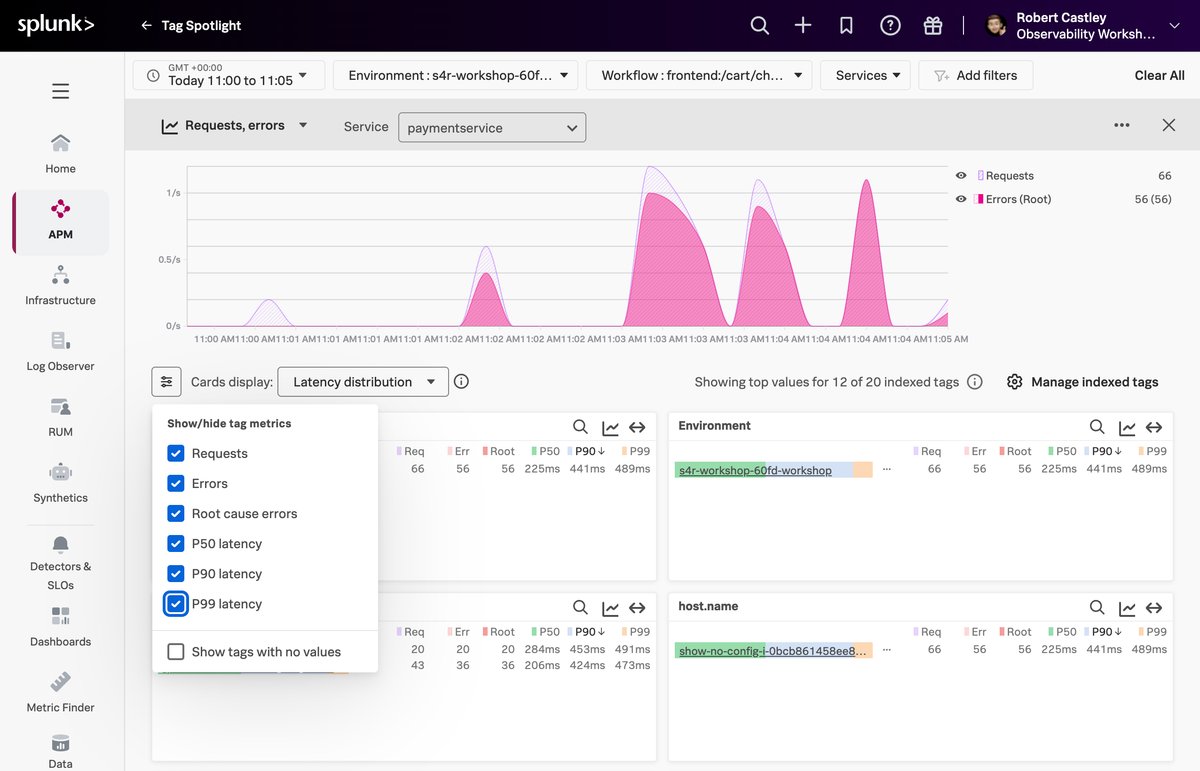
Best for: Enterprises that need operational log analytics and security investigations on the same data platform.
Splunk Cloud Platform and Splunk Enterprise index machine data into searchable events and expose it through Search Processing Language. SPL can filter, extract fields, calculate statistics, transform results, and build reports across heterogeneous operational and security data. That depth, plus Splunk's established app and security ecosystem, puts it on the shortlist when Loki has grown into a compliance or security information and event management (SIEM) requirement.
Splunk offers ingest-based pricing tied to data volume, plus workload pricing tied to compute capacity: Splunk Virtual Compute (SVC) units in Splunk Cloud Platform and vCPUs in Splunk Enterprise. Its pricing model documentation is public, but production sizing and final quotes usually involve sales. Ingest filtering, search concurrency, retention, storage tiers, and premium security products can all affect the contract.
The main cost is not only financial. SPL, source types, indexes, forwarders, permissions, and platform administration form their own operating discipline, so this is a strategic platform change rather than a lightweight Loki swap.
Worth exploring if: Security, audit, and cross-domain machine-data analysis are first-class requirements.
Give it a pass if: You only need developer log search and want self-service pricing with minimal platform administration.
6. Better Stack
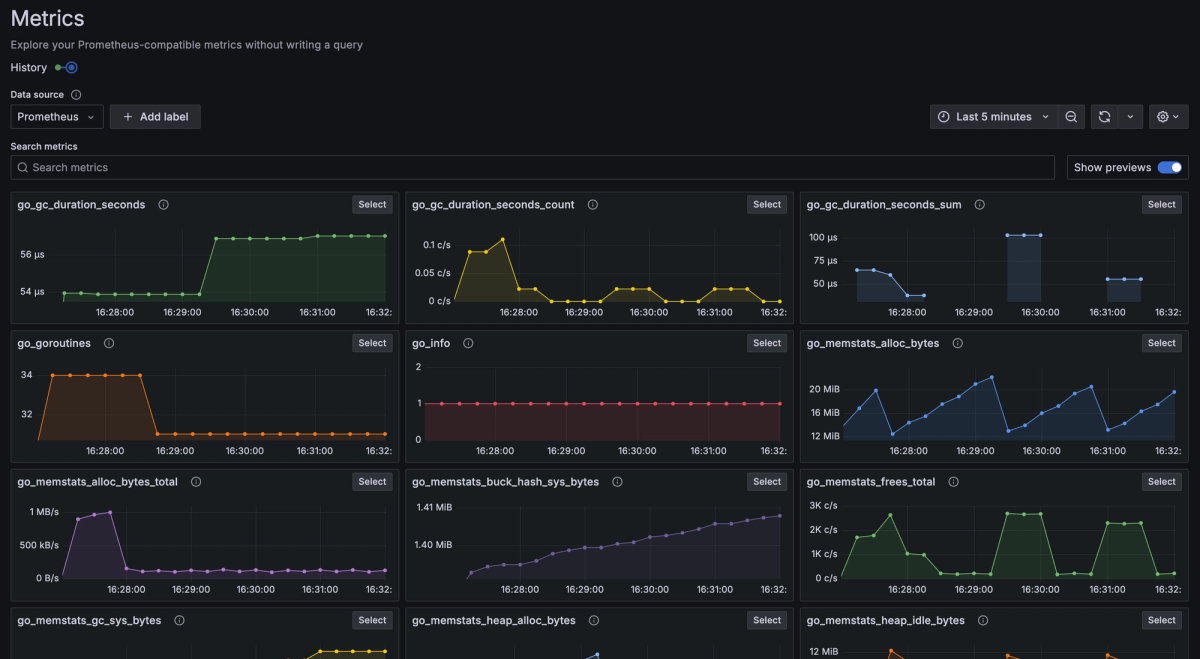
Best for: Developer teams that want telemetry, on-call, incident response, and status communication together.
Better Stack Telemetry combines logs, metrics, and traces with an incident-management product. Engineers can query logs with SQL, apply Vector Remap Language transformations, build alerts, and move from telemetry into on-call workflows without assembling separate vendors. Its open-source collector bundles OpenTelemetry, Vector, Prometheus exporters, and optional extended Berkeley Packet Filter (eBPF) instrumentation for Kubernetes or Docker.
The pricing page separates ingest and retained data for logs and traces, with query boosts for additional scanned volume; bundles include fixed telemetry allowances and retention. Responder licenses, uptime checks, AI usage, and other incident features are separate meters, so the bundle is most economical when you actually need both telemetry and response workflows.
The backend is managed rather than self-hosted. The optional eBPF collector also has meaningful host requirements and may conflict with another tracing agent, although teams can use standard OpenTelemetry collection instead. Moving from Loki means translating LogQL and Grafana content into SQL-based queries and Better Stack dashboards.
Worth exploring if: You want one vendor for developer observability and the human incident loop.
Give it a pass if: You must self-host or already have mature on-call tooling and only need a log database.
7. SigNoz
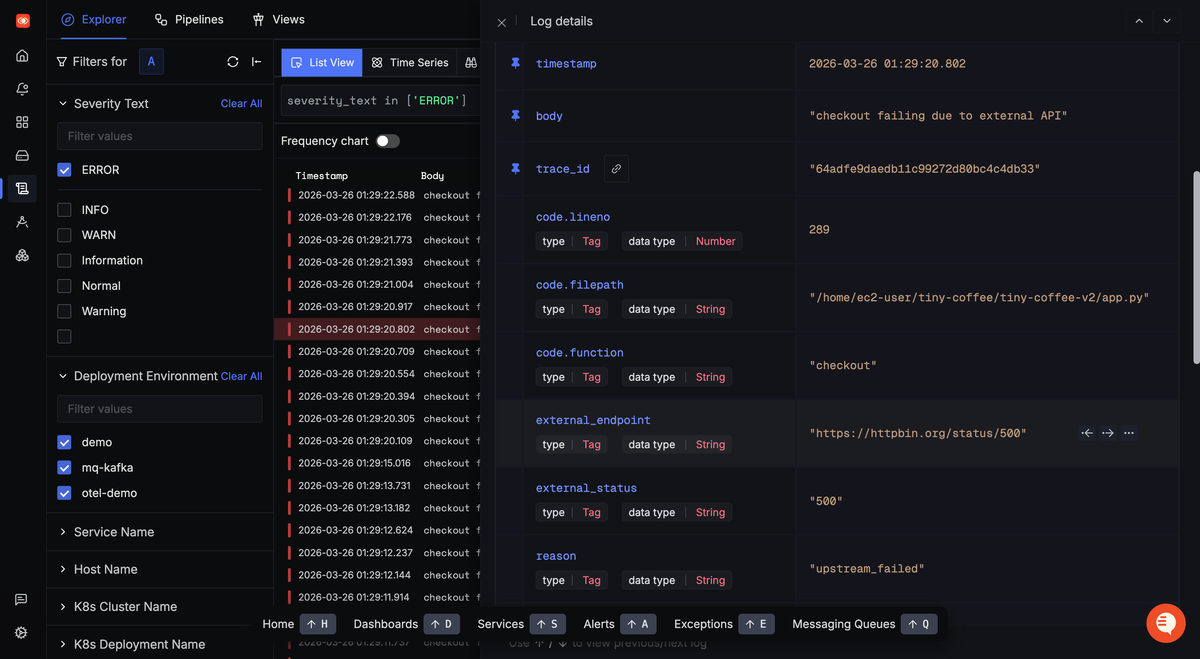
Best for: Teams that want an OpenTelemetry-native observability platform with cloud and self-hosted options.
SigNoz stores OpenTelemetry logs, traces, and metrics in ClickHouse and exposes them through signal-specific explorers, a visual query builder, dashboards, and alerts. Compared with Loki, the attraction is full-stack context and columnar filtering without building the rest of the Grafana LGTM stack (Loki, Grafana, Tempo, Mimir) around the log backend.
SigNoz Cloud bills logs and traces by ingested gigabytes and metrics by samples, with no separate host or user meter; default and extended retention affect the estimate, and a free trial is available. Self-hosting removes the SaaS usage bill but transfers ClickHouse capacity, upgrades, backups, and schema migrations to your team. A production distributed deployment can also require multiple ClickHouse shards or replicas plus ClickHouse Keeper or ZooKeeper.
OpenTelemetry reduces instrumentation and transport lock-in, not product lock-in. Dashboards, alerts, query-builder expressions, ClickHouse queries, retention, and RBAC still need to be migrated if you leave. SigNoz is therefore most compelling when you want the entire OTel-centered platform, not merely a new place to store logs.
Worth exploring if: You want portable collection and the option to operate the observability backend yourself.
Give it a pass if: Your team does not want to own ClickHouse and a managed-only service would be simpler.
8. OpenObserve
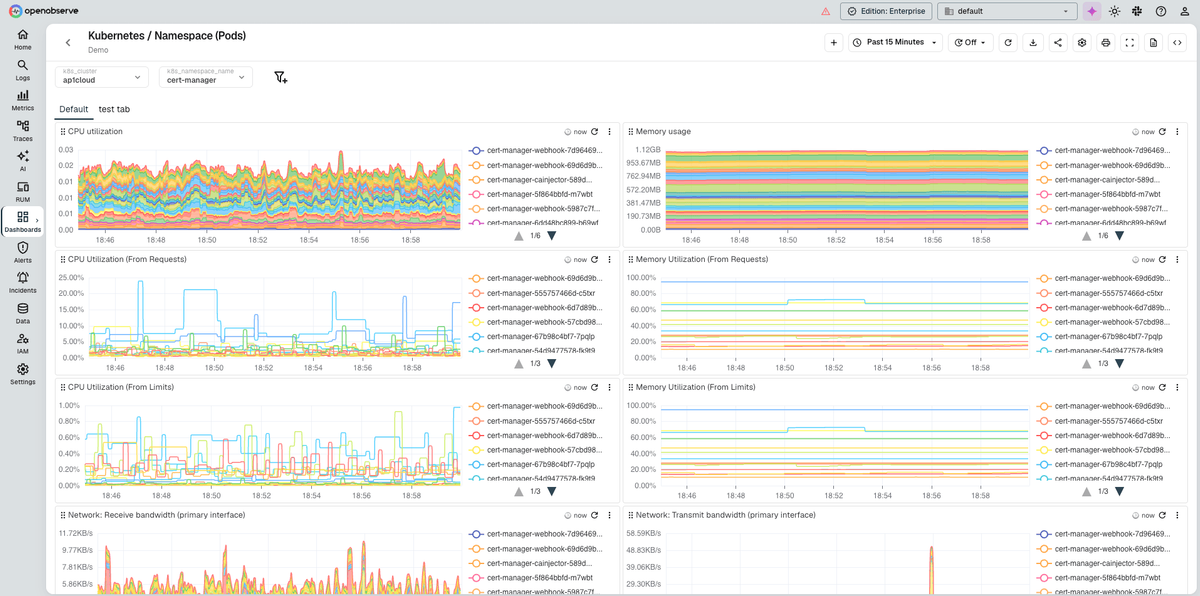
Best for: Cost-conscious teams that prefer SQL log analytics and object-storage-backed architecture.
OpenObserve is an open-source platform for logs, metrics, and traces that stores data in Parquet and queries logs with SQL and full-text functions. It accepts OTLP and the Loki Push API, so Promtail, Alloy, Fluent Bit, Vector, and OpenTelemetry Collector pipelines can often be redirected without rewriting applications.
The self-hosted single-node mode can use local disk or object storage. High-availability mode is a larger system: Kubernetes runs router, ingester, compactor, querier, and scheduler roles, while PostgreSQL holds metadata, NATS coordinates the cluster, and object storage holds Parquet files. OpenObserve Cloud uses public consumption pricing for ingest, query volume, pipelines, and additional retention rather than hosts or seats, and offers a trial.
Collection migration is easier than workflow migration. OpenObserve's own guidance says Grafana dashboards and alerts must be recreated, while LogQL queries need translation to SQL. That is a material project for teams with a large Grafana estate, even when the raw log pipeline moves cleanly.
Worth exploring if: SQL, object storage, and low infrastructure cost are stronger priorities than preserving LogQL.
Give it a pass if: You need a drop-in Grafana dashboard migration or do not want the dependencies of HA self-hosting.
9. VictoriaLogs
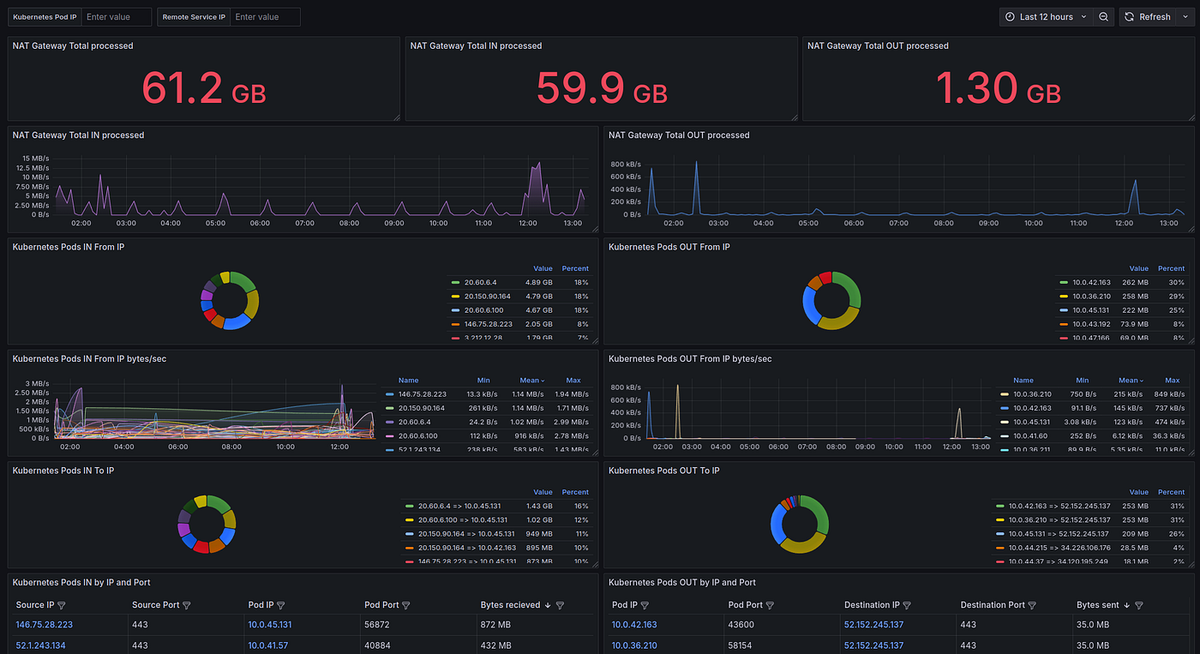
Best for: Teams that want a resource-efficient, log-only backend with a simple path from one node to a cluster.
VictoriaLogs is a purpose-built log database available as a single executable or a horizontally scalable cluster. LogsQL supports full-text filtering, query-time field extraction, and statistical pipes, while the official Grafana data source lets teams keep Grafana as the visual layer. It accepts common ingestion protocols and agents, including OpenTelemetry, syslog, Elasticsearch, and Loki-compatible inputs.
The community edition is free to self-host; the enterprise edition adds licensed capabilities and support. VictoriaMetrics Cloud billing is driven by deployment resources—compute, storage, and networking—rather than a single ingest event meter. Forecasting therefore depends on sizing and retention, while the self-hosted cost is infrastructure plus operator time.
Its narrow scope is both the advantage and the catch. Authentication and public-network protection require surrounding components such as vmauth, and alerting uses vmalert. Teams seeking native traces, metrics, security analytics, or incident management will still assemble a wider stack.
Worth exploring if: You want full-text log search without adopting a general-purpose search cluster or full SaaS suite.
Give it a pass if: A unified multi-signal investigation UI is a core requirement.
Comparison table
Once you've narrowed your shortlist to two or three candidates, use this table to compare query models, deployment options, pricing shape, and the main tradeoff side by side.
| Tool | Best fit | Query/search model | Deployment | Pricing model | Main tradeoff |
|---|---|---|---|---|---|
| Elastic Observability | Deep log analytics | Full-text search, ES|QL, Kibana | Self-managed, hosted, serverless | Ingest, retention, egress, or resources | Search-cluster and schema complexity |
| OpenSearch | Open-source search control | Lucene, SQL, PPL | Self-hosted or managed | Free software; infrastructure or managed resources | Shard, index, and capacity operations |
| Dash0 | Managed OTel workflows | Attribute filters, groups, patterns | SaaS | Log records ingested | SaaS-only and 30-day log retention |
| Datadog | Broad SaaS consolidation | Datadog log search and analytics | SaaS | Ingest, indexed events, storage, compute, scans | Multiple product and log meters |
| Splunk Platform | Enterprise and security analytics | SPL/SPL2 | SaaS or self-managed | Ingest volume or workload compute | Cost and specialist administration |
| Better Stack | Telemetry plus incident response | SQL, visual queries, VRL transforms | SaaS | Ingest, retention, scan boosts, add-ons | Bundle value depends on using response tools |
| SigNoz | OTel-native open-source stack | Visual builder and ClickHouse queries | Cloud or self-hosted | GB ingest, samples, retention, or infrastructure | ClickHouse operations when self-hosted |
| OpenObserve | Object-storage-backed analytics | SQL and full-text functions | Cloud, single node, or HA | Ingest, query, pipelines, retention, or infrastructure | LogQL and dashboard recreation |
| VictoriaLogs | Lean log-only backend | LogsQL full-text and statistical pipes | Cloud, single node, or cluster | Free software, licensed enterprise, or resources | Wider observability stack still required |
Final thoughts
Grafana Loki alternatives split into three practical groups. Elastic, OpenSearch, Splunk, and VictoriaLogs emphasize search and data-platform control; Datadog, Better Stack, and Dash0 trade backend operations for managed workflows; SigNoz and OpenObserve offer open-source paths to a unified observability stack. The right shortlist depends less on nominal feature coverage than on which tradeoff you are actually trying to change: search flexibility, operational ownership, cross-signal context, deployment control, or bill shape.
Before replacing Loki, replay representative production logs into two candidates and test the investigations your team performs under pressure. Measure query behavior on unstructured and high-cardinality fields, map Promtail or Alloy pipelines, convert a sample of LogQL alerts and Grafana dashboards, verify RBAC and archive requirements, and model both ordinary and incident-period volume. Include the cost of operating collectors and storage as well as the migration cost of saved workflows. If managed, OpenTelemetry-native investigation is the direction you want to test, a Dash0 free trial lets you validate the fit with your own telemetry.