
So, you’ve been using Honeycomb. Maybe it was the promise of high-cardinality debugging that caught your eye, or the fluid experience it offers when working with traces.
But now, you’re glancing at that sky-high monthly charge and wondering how pricing based on event counts got this expensive. Or perhaps you’ve grown weary of cobbling together extra utilities to track logs and system metrics, because Honeycomb’s scope feels just a bit too narrow.
You’re definitely not the only one. SREs and DevOps professionals across the board are running into similar frustrations. They crave the powerful insights that Honeycomb offers but without the runaway costs, confusing query syntax, or the hassle of juggling multiple disconnected tools.
This guide is a direct, practical comparison of the most capable Honeycomb alternatives available to cloud-native engineering teams today. We’ll evaluate each platform on key factors like pricing models, support for open standards, risk of vendor lock-in, and general ease of use. The goal? Help you choose a solution that does its job without giving you new headaches.
1. Dash0

Dash0 is a next-generation observability suite built from scratch with OpenTelemetry in mind. It’s tailored for teams that want reliable, straightforward costs and complete independence from vendor constraints.
By centering around open-source protocols like OpenTelemetry and Prometheus, Dash0 ensures a plug-and-play experience. It’s aimed at cloud-native teams who want power without being boxed into restrictive contracts or proprietary software.
Key Advantages
- Built-in freedom. Dash0 is completely aligned with open standards. It ingests telemetry via OpenTelemetry, uses PromQL for querying across the board, and leverages Perses for building dashboards. This means you can leave at any time, taking all your data models and dashboards with you—no reconfiguring required.
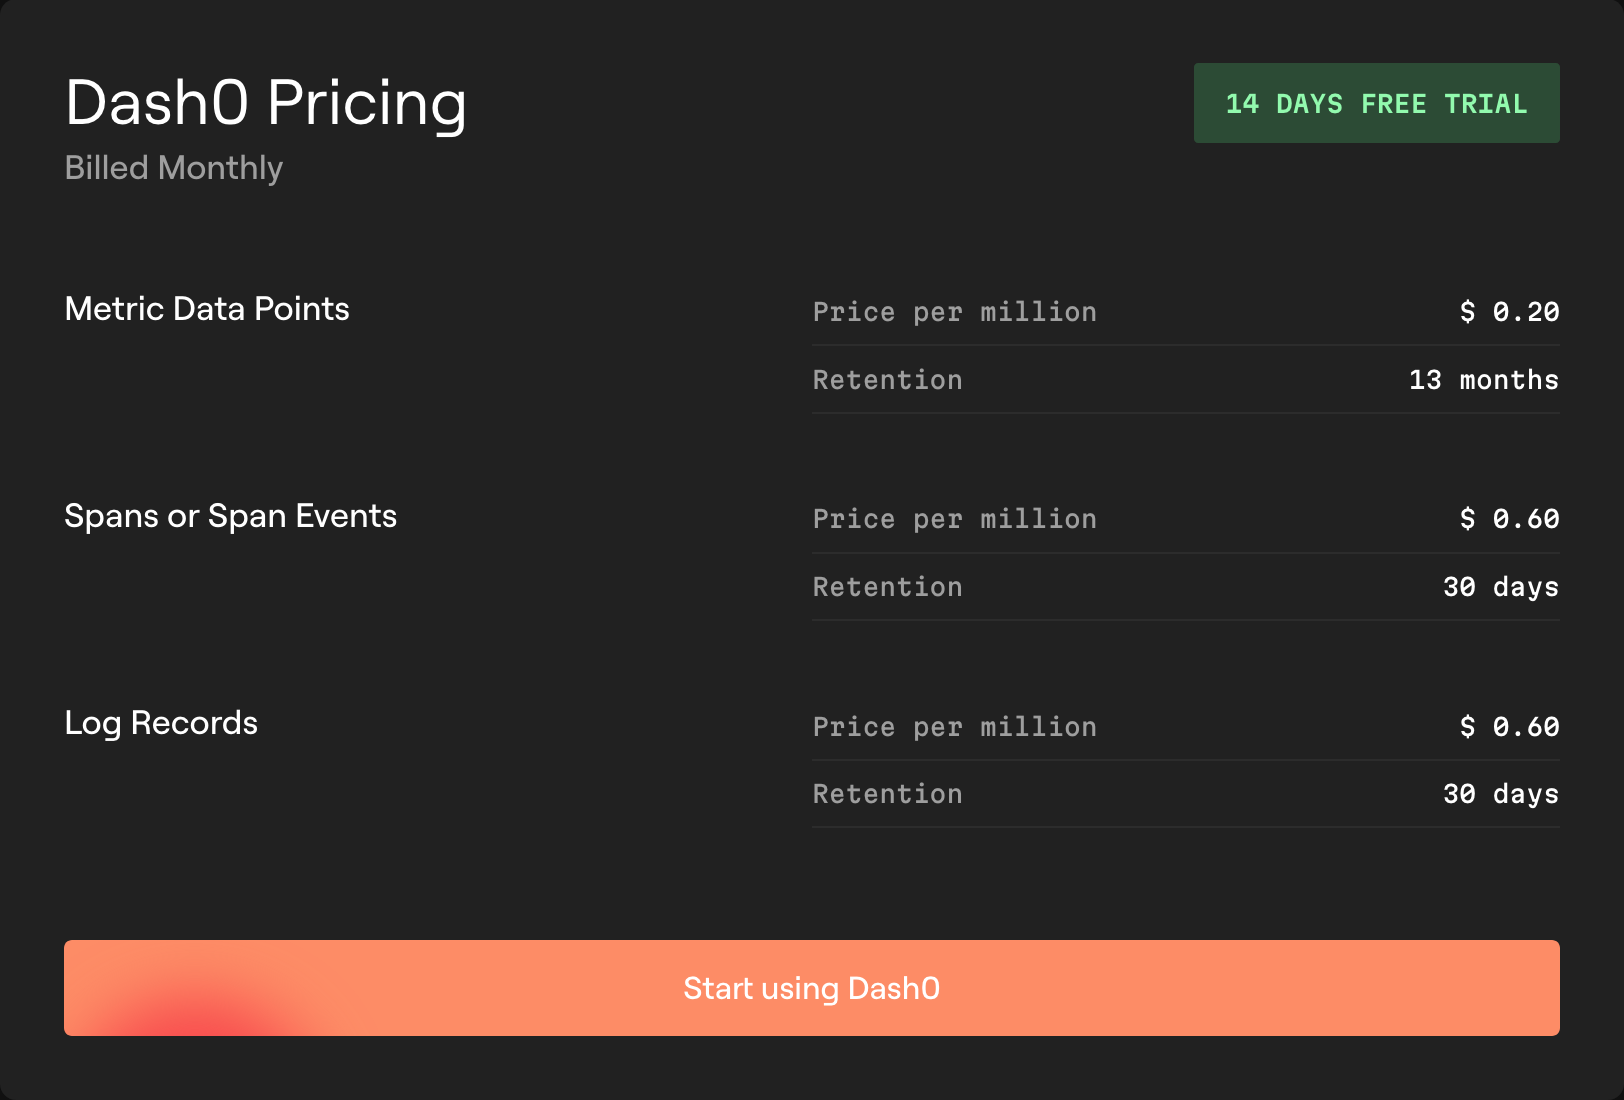
- Clear and fair pricing. The billing structure is refreshingly simple: you pay per million logs, spans, or metrics, and nothing more. There’s no extra charge for users, volume in gigabytes, or the number of queries. This encourages detailed instrumentation instead of penalizing you for it.
- Unified query language. PromQL is used across the board for metrics, traces, logs. That makes it much easier for engineers familiar with Prometheus to get up and running.
Considerations
Dash0 is focused on delivering a clean, standards-based experience across the key observability pillars. As a result, it doesn’t come with a sprawling catalog of built-in integrations or edge-case features that tools like Datadog provide out of the box.
Bottom Line
For teams already working with OpenTelemetry and Prometheus, Dash0 is a modern, well-integrated solution that offers cost transparency and freedom. It gives you a consistent, reliable observability layer without proprietary traps.
Try it for yourself with a free 14-day trial to see what a truly OpenTelemetry-first platform feels like.
2. Datadog

Datadog is the heavyweight in the observability arena. It provides an all-encompassing toolset, ranging from infrastructure monitoring and logs to APM, security intelligence, RUM, and more. It’s renowned for its sleek interface and vast number of built-in integrations.
Key Advantages
- All-encompassing toolkit. If there’s a type of monitoring you need, Datadog probably supports it. This makes it appealing for large organizations looking for an all-in-one provider.
- Highly refined user interface. Datadog’s dashboarding tools are polished, consistent across features, and relatively easy to use even if the backends are distinct.
- Comprehensive integrations. There are plug-and-play modules for nearly any service or platform, dramatically simplifying onboarding.
Considerations
- Very high total cost. Datadog’s billing system is notoriously multifaceted. Expect fees for every host, every GB of logs, custom metrics, individual users, and more. Trying to predict monthly charges can be incredibly difficult.
- Tight ecosystem lock-in. The platform leans heavily on its own proprietary agent and storage format. Though OpenTelemetry exporters exist, they still funnel data into Datadog’s internal structures—making future migration hard.
Bottom Line
Datadog is a widely adopted choice for large organizations that prioritize convenience and breadth of features. But that ease of use comes with steep costs and long-term vendor dependence. Proceed with caution if budget predictability and platform flexibility are important to you.
3. New Relic

A longtime player in the APM space, New Relic has transitioned into a more holistic observability platform. They were among the first legacy vendors to embrace the shift toward centralizing data and supporting open standards.
Key Advantages
- More transparent pricing. New Relic now bills based on ingestion volume and user seats. It’s not perfect, but it’s much simpler than the fragmented model they used to have.
- Excellent APM support. Their performance monitoring capabilities are sophisticated, offering detailed diagnostics at the code level.
- OTel support. New Relic has committed to OpenTelemetry and supports OTLP ingestion, which is a major step forward for compatibility and transparency.
Considerations
Despite simplifying the pricing, it’s still tied to per-user costs and data volume—both of which can balloon quickly. And while OTLP is accepted, you’re still locked into using NRQL, New Relic’s SQL-like query syntax.
Bottom Line
A solid choice for teams already using New Relic or those with strong APM needs. While they’ve made genuine strides toward modern standards, some legacy baggage remains.
4. Grafana Stack (LGTM)

The Grafana stack—made up of Grafana for visualization, Loki for logs, Mimir for metrics, and Tempo for tracing—is a go-to for teams committed to open-source infrastructure. You can deploy it yourself or use Grafana’s managed cloud offering.
Key Advantages
- Fully open-source. The OSS version gives you unmatched flexibility and full control. No proprietary constraints or lock-ins.
- Visualization gold standard. Grafana leads the field in dashboards, with connections to nearly every data backend imaginable.
- Affordable if self-managed. Running it in-house can be far cheaper than vendor solutions provided you have the expertise.
Considerations
The complexity of maintaining the full stack yourself is considerable. Each component is powerful but requires separate setup and maintenance. Grafana Cloud simplifies this, but it still feels like multiple tools loosely tied together.
Bottom Line
For well-staffed teams that value open source and have the know-how to run it, the Grafana stack offers freedom and power. For smaller teams or those seeking a unified experience, it may be too much overhead.
5. Elastic Observability (ELK Stack)

The Elastic Stack, originally focused on log management, now includes metrics and APM under the Elastic Observability brand. It’s based on Elasticsearch, Logstash, and Kibana.
Key Advantages
- Excellent log analysis. Elasticsearch still shines when it comes to querying and visualizing logs quickly and effectively.
- Massive scalability. It can handle enormous data volumes, whether self-hosted or deployed on cloud platforms.
- Mature platform. With a large user base and ecosystem, there’s a wealth of guides and community support.
Considerations
Elastic still feels log-first, with APM and metrics feeling like afterthoughts. The OpenTelemetry support exists but data is remapped into proprietary schemas. Complexity and operational cost can also be high, both for hosted and cloud offerings.
Bottom Line
A strong option for log-heavy use cases or teams already familiar with Elasticsearch. But as a general-purpose observability solution, it may feel outdated or disjointed compared to newer platforms.
6. Signoz

Signoz is an open-source observability platform designed to offer full coverage—logs, metrics, and traces—all powered by OpenTelemetry. It’s a unified product from the start, not a collection of loosely connected parts.
Key Advantages
- Natively OpenTelemetry. It’s built around OTLP as the primary format, minimizing data transformation and integration complexity.
- Flexible hosting. You can deploy it yourself or use their managed cloud service to offload infrastructure work.
- Integrated interface. Logs, metrics, and traces are managed through one clean, consistent dashboard.
Considerations
As a newer tool, Signoz is still evolving. The UI may lack the refinement of larger platforms, and the query builder is based on ClickHouse yet another syntax to learn. Running it at scale can also require operational skill.
Bottom Line
For teams focused on open standards and seeking a unified experience without proprietary baggage, Signoz is an attractive option. Just know it’s a younger project with some polish and maturity still in development.
7. Dynatrace

Dynatrace positions itself at the high end of the observability spectrum, leaning into automation and artificial intelligence. Its OneAgent deploys broadly and feeds data to Davis AI for automated insights.
Key Advantages
- Extensive automation. Dynatrace reduces manual setup through auto-discovery and built-in root-cause analysis.
- Comprehensive platform. It includes everything from infrastructure monitoring to business analytics.
- Contributor to OpenTelemetry. Even with its proprietary agent, it supports OTLP and contributes actively to open standards.
Considerations
Dynatrace is among the priciest platforms available. Pricing is complex and based on consumption, host units, and more. It’s also tightly bound to its own agent and AI, making future migration complex.
Bottom Line
A fit for large organizations seeking automation and scale, and who can absorb high costs. But it’s far removed from the open, composable tools modern cloud-native teams often prefer.
8. Lightstep (ServiceNow)
Lightstep made its mark in distributed tracing and helped create OpenTelemetry. Now part of ServiceNow, it focuses on high-scale trace analytics and deployment correlation.
Key Advantages
- Tracing roots. Founded by engineers from Google’s Dapper project, Lightstep has deep tracing expertise.
- Deep OTel ties. It was instrumental in shaping OpenTelemetry and continues to support it robustly.
- Change Intelligence. It automatically ties performance issues to deploys, helping with rapid diagnosis.
Considerations
Since being acquired by ServiceNow, the product direction is more enterprise-focused. Logs and metrics have played catch-up, and pricing isn’t very transparent.
Bottom Line
Lightstep is a great tracing tool but may be less appealing for teams wanting a full-stack observability suite independent of ITSM platforms.
9. Coralogix

Coralogix takes a novel approach: it lets you analyze data before it’s indexed, reducing storage costs significantly. You can choose how data is processed and stored depending on your needs.
Key Advantages
- Configurable cost model. Their usage units (CXUs) allow granular control of storage, alerting, and archival.
- In-stream data handling. Transform and alert on data as it flows in, without storing everything.
- Full OTel compatibility. They support logs, metrics, and traces natively via OpenTelemetry.
Considerations
The pipeline model is different than most tools, and takes time to understand. The query language is based on Lucene and SQL, which adds another skill set to learn.
Bottom Line
For teams focused on cutting costs and willing to rethink how they manage observability data, Coralogix is a strong and unique option.
10. Logz.io

Logz.io offers a cloud-hosted observability suite based on open-source tech like OpenSearch, Prometheus, and Jaeger. It provides the benefits of OSS without the operational burden.
Key Advantages
- Built on familiar tech. Teams with prior experience using ELK or Prometheus will feel right at home.
- Managed hosting. Offloads the heavy lifting of deployment and scaling.
- Cost management tools. Features like data tiering and retention policies help manage spend.
Considerations
It’s still a managed service, so you’ll pay for that convenience. Integration between components isn’t always seamless, and pricing can climb with increased usage.
Bottom Line
Great for teams that like open-source tools but want someone else to run them. But it’s worth comparing long-term costs against more cohesive alternatives.
Wrapping Up
Choosing the right Honeycomb alternative starts with identifying your priorities. Are you looking for a fully integrated vendor solution, or a flexible, open-source-friendly model?
Legacy platforms often come with hidden costs, closed systems, and usage-based pricing that disincentivizes team-wide adoption. In contrast, modern tools like Dash0 are built on open telemetry standards, use consistent query languages like PromQL, and let your whole team participate without the budget blowback.
Picking the right tool now isn’t just about this month’s bill. It’s about enabling your team to scale confidently on your terms.
Want to try a platform designed for your team’s needs not your vendor’s profit margin? Start your Dash0 trial today.

