
Last updated:
Generate Check Rules with Agent0
Agent0 proposes check rules from natural language descriptions. Describe what you want to monitor, then review the query, thresholds, grace periods, and notification channels before applying the proposal.

Creating check rules requires the Create Check Rule dataset permission. Admins and dataset Maintainers have it by default. See About Alert Monitoring.
How It Works
Agent0 uses your request and available telemetry to propose a configuration. Before applying it, verify that the proposal:
- Uses valid PromQL that returns the data you intend to monitor
- Sets thresholds with the correct units and severity direction
- Uses grace periods appropriate for your workload
- Selects the intended notification channels and severity levels
- Includes useful summary and description templates
Open Agent0
Access Agent0 from:
- Agent0 Chat page — https://app.dash0.com/agent0
- Command palette — Press
⌘K(Mac) orCtrl+K(Windows/Linux) from any page - In-page buttons — Look for Agent0 buttons in explorers and chart views
Open Ask Agent0 while viewing the Service Map to include the page context. The panel offers Create an alert and prompts about the displayed services. Review the proposed configuration before applying it.
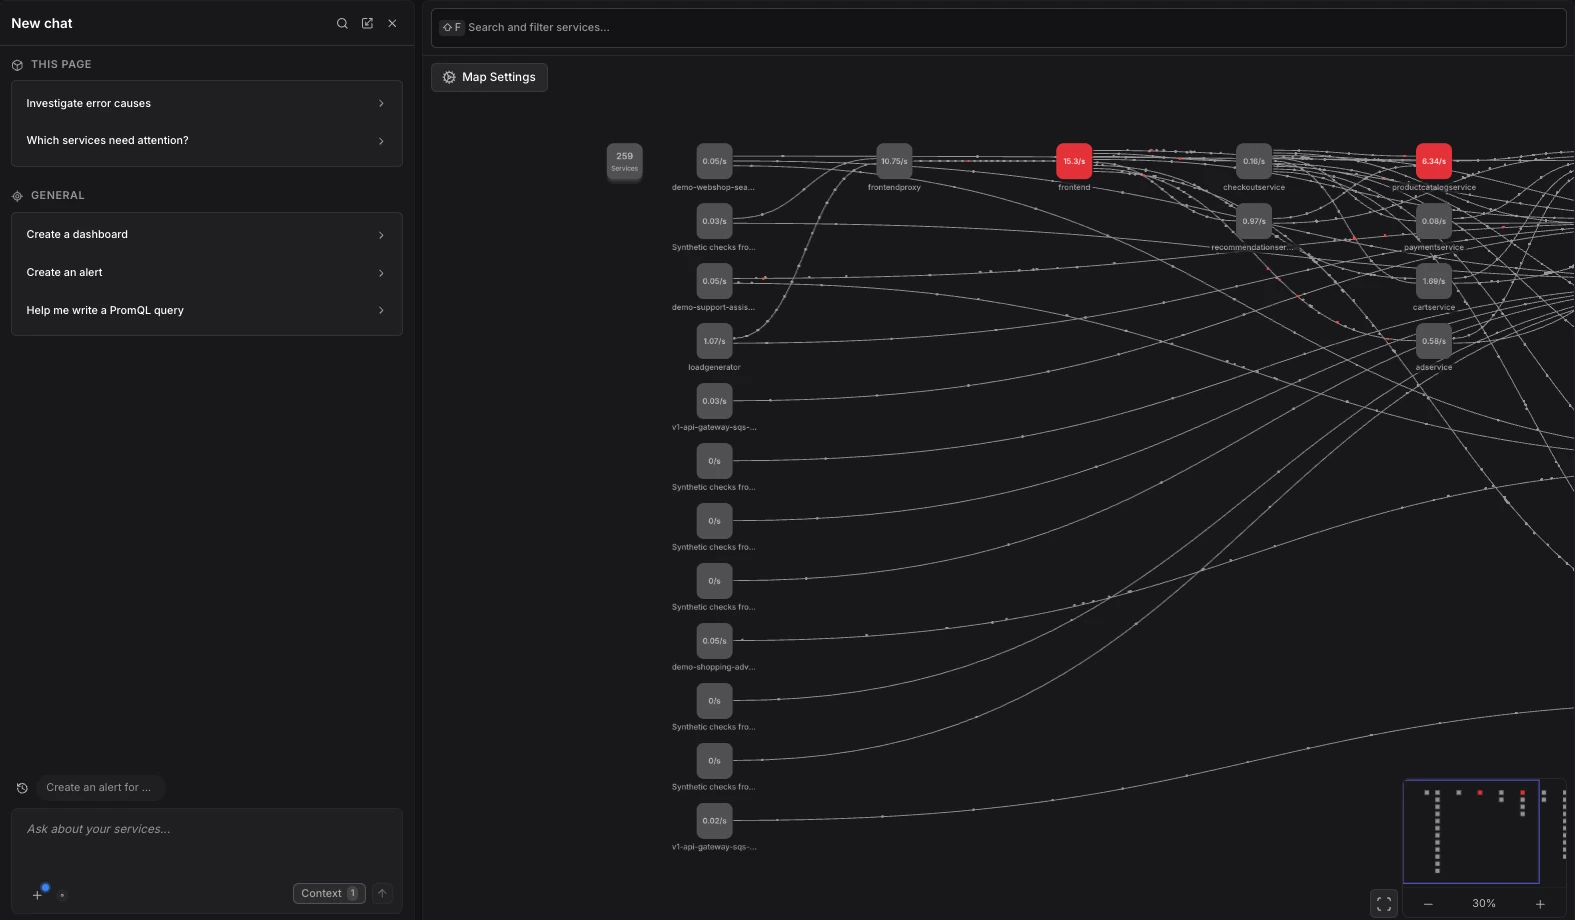
Type your prompt, or choose Set up an alert under ASK AGENT0 TO on the Agent0 landing page.

Describe What You Want to Monitor
Be specific about:
- The service or component you're monitoring
- The metric type (latency, error rate, resource usage, etc.)
- The threshold value
- Optional: notification preferences
Example prompts:
- "Alert me when frontend latency exceeds 500ms"
- "Monitor error rate for payment-service and notify me when it's above 5%"
- "Create a check for database connection pool exhaustion"
- "Alert when the checkout endpoint P99 latency is over 2 seconds"
- "Monitor log errors in the auth service and send to Slack"
- "Track when CPU usage on backend services exceeds 80%"
- "Alert if any service's request rate drops below 10 requests per minute"
The more specific your prompt, the better Agent0 can configure the check rule. Include service names, metric types, thresholds, and notification preferences for optimal results.
Review the Generated Configuration
Agent0 generates a complete check rule configuration:
- Query — The PromQL expression that monitors your telemetry
- Thresholds — Critical and degraded values
- Grace periods — Evaluation frequency and trigger delays
- Summary and description — Alert message templates with variables
- Notification channels — Suggested channels (if mentioned in prompt)
Example generated query:
# For "Alert me when frontend latency exceeds 500ms"
histogram_quantile(0.99,
  sum by (service_name, service_namespace) (
    rate({otel_metric_name="dash0.spans.duration", service_name="frontend"}[5m])
  )
) * 1000 > $__threshold
Illustrative thresholds:
- Critical: 500 (based on your prompt)
- Degraded: 350 (an optional example, not an automatically calculated ratio)
Generated summary:
Frontend P99 latency is {{ $value }}ms (threshold: {{ $__threshold }}ms)Refine the Configuration
If the generated check rule needs adjustments, iterate with Agent0:
- "Change the critical threshold to 1000ms"
- "Add degraded threshold at 700ms"
- "Also send notifications to PagerDuty for critical alerts"
- "Change the grace period to 2 minutes"
- "Monitor all services, not just frontend"
Save the Check Rule
Review the query, units, thresholds, evaluation settings, and notification destinations before clicking Create check rule in the Agent0 response. This action creates the rule directly; it is not a draft that always requires a second Save in an editor.
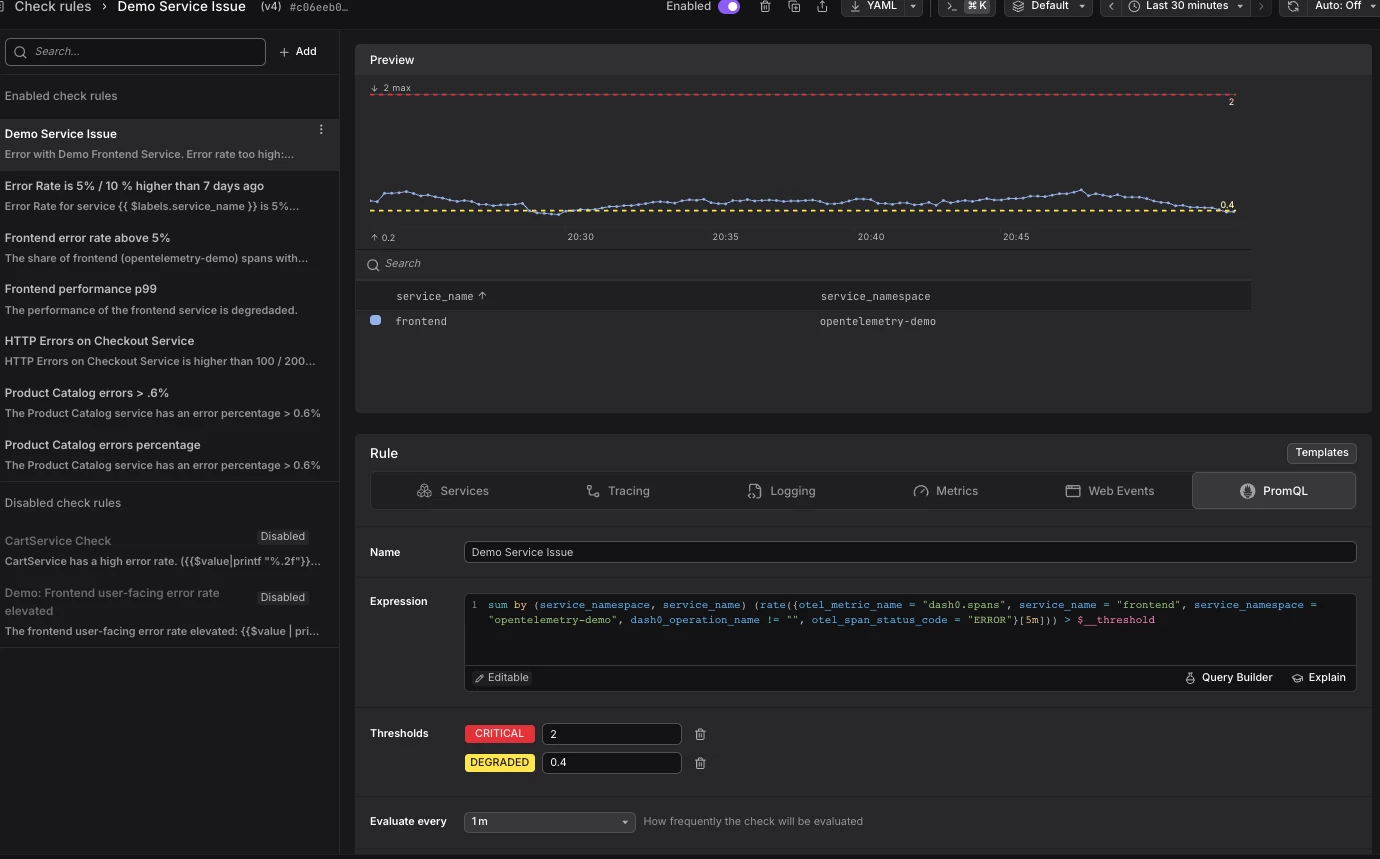
After applying the proposal, open the saved rule under Monitoring > Alerting > Check Rules and verify its configuration and evaluation history.
An enabled rule begins evaluating at its configured interval. Check whether the proposal enables it before applying.
Further Reading
- About Agent0 — Overview of the AI layer built into Dash0
- About Alert Monitoring — Overview of Dash0's alerting capabilities
- Create Check Rules — All methods for creating check rules
- Investigate Failed Checks — Troubleshoot failed checks