Monitoring Claude Code can be as simple as tracking how many tokens your team uses, or as detailed as working out why one session spent five minutes waiting for a tool.
Claude Code exports enough OpenTelemetry data to cover both ends of that range:
| Level | Typical questions | Signal |
|---|---|---|
| Organizational | Who uses Claude? Which models? What does it cost? | Metrics |
| Operational | Which tools fail? Are retries rising? | Logs/events |
| Diagnostic | Why was this particular session slow or broken? | Traces |
That means choosing a monitoring tool isn't really about whether it accepts OTLP data because most observability backends do. The difference is how much useful Claude Code analysis you get once the data arrives.
We'll compare eight options:
- Claude Code analytics and Anthropic Admin APIs
- Dash0
- Prometheus + Grafana
- Amazon CloudWatch
- Datadog
- Grafana Cloud
- Honeycomb
- SigNoz
These eight either have a dedicated Claude Code or coding-agent workflow, or provide a useful open-source baseline.
Watch your metric cardinality
Claude Code includes session.id as a metric attribute by default. Account
identifiers can also be included when they're available.
For 300 developers starting 40 sessions each working day:
12300 developers × 40 sessions × 20 days= 240,000 sessions/month
That's potentially a lot of distinct metric series before you add model, team, terminal, or other dimensions.
Anthropic gives you switches for the two obvious high-cardinality identifiers:
12export OTEL_METRICS_INCLUDE_SESSION_ID=falseexport OTEL_METRICS_INCLUDE_ACCOUNT_UUID=false
Don't remove them automatically. Just decide whether you really need session-level dimensions in metrics. Logs and traces are usually a better fit for investigating individual sessions.
Treat estimated cost as an estimate
Claude Code exports claude_code.cost.usage in US dollars, but that value won't
always match what your organization pays.
API usage maps neatly to token pricing. Flat-rate Claude subscriptions don't. Any monitoring backend that displays Claude Code's cost metric inherits that limitation.
For organization-level API billing, Anthropic also provides its Usage & Cost API through the Admin API.
How the options compare
| Option | Org usage | Logs/events | Trace workflow | Fleet option |
|---|---|---|---|---|
| Anthropic | Native | Export only | Export only | Native |
| Dash0 | Built in | Plugin/native | Built in | Managed config |
| Prometheus + Grafana | Build it | Add log store | Add trace store | Collector |
| CloudWatch | Built in | AWS stack | Build it | AWS/managed |
| Datadog | Built in | OTLP | Custom | Managed config |
| Grafana Cloud | Built in | Built in | Build it | Managed config |
| Honeycomb | Built in | Built in | Built in | Managed config |
| SigNoz | Built in | Built in | Custom | Managed config |
1. Claude Code analytics and Anthropic Admin APIs
Anthropic gives you several ways to monitor Claude Code before you send any telemetry to another platform.
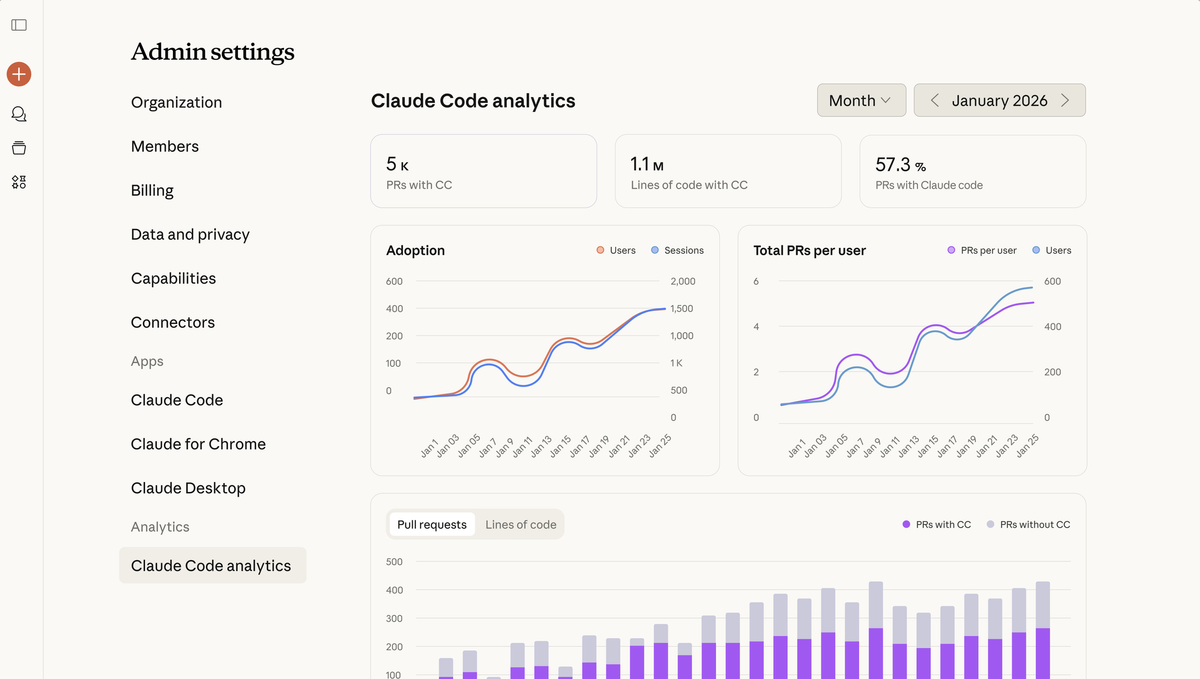
Claude for Teams and Enterprise includes a built-in analytics dashboard for usage and contribution data. Anthropic also has Admin APIs for Claude Code analytics, organization usage, and cost, so you can pull the data into your own reporting systems.
What's good
The built-in dashboard answers many of the questions engineering leaders ask first. It tracks daily active users, sessions, accepted lines of code, suggestion acceptance, and top contributors without requiring another monitoring system.
Connect GitHub and you also get contribution data around merged pull requests and code shipped with Claude Code assistance. The dashboard can show adoption over time, PRs per user, and a breakdown of PRs with and without Claude Code involvement.
The APIs are useful when the dashboard isn't where you want the data to end up. You can feed Claude Code analytics and Anthropic usage and cost information into internal budgeting, reporting, or governance systems.
The catch
Anthropic's analytics are built for organization-level reporting, not session debugging.
They can tell you who's using Claude Code and how adoption is changing. They can't reconstruct an interaction to show which tool failed, where the time went, or how a subagent behaved. You'll need Claude Code's OpenTelemetry logs and traces in another backend for that.
The GitHub contribution numbers also need some restraint. They show where Claude Code was involved in shipped work, but they don't prove that Claude Code made a developer more productive. Anthropic's contribution metrics are still in public beta.
Pricing model
There's no separate monitoring charge for the built-in analytics. Access comes with the relevant Claude plan, while Anthropic's API usage and cost data reflect your organization's actual API consumption.
The verdict
Start with Anthropic if you mainly want native Claude Code usage, adoption, contribution, and billing data.
Once you need to explain what happened inside a specific session, you'll need an observability backend for Claude Code's logs and traces.
2. Dash0
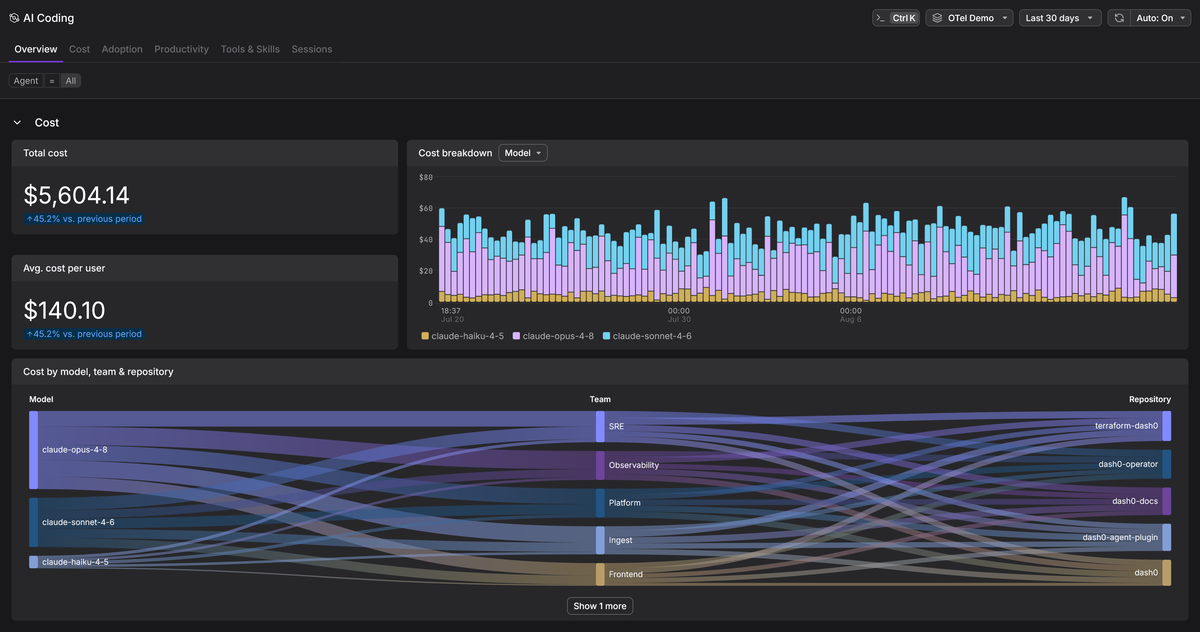
Dash0's AI Coding Insights is built for monitoring how developers use coding agents such as Claude Code and Cursor.
Claude Code's native telemetry covers adoption and estimated model cost. The Dash0 agent plugin adds OpenTelemetry spans for conversation history, tool executions, permission prompts, subagents, MCP activity, and context compaction.
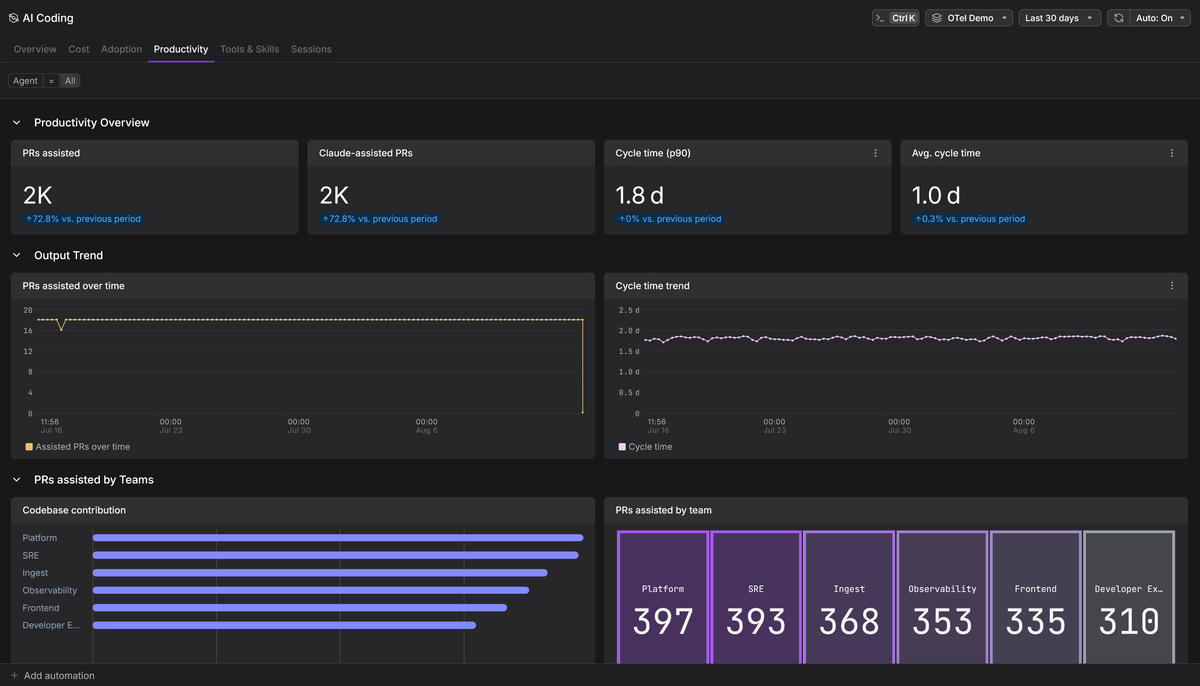
Dash0 can also connect sessions with GitHub pull requests and show delivery indicators such as cycle time.
What's good
AI Coding Insights has dedicated views for cost and adoption, broken down by model, team, and developer. You can see active users, new adopters, usage frequency, top users, and which models account for the most spend.
The session view lets you follow those numbers back to the underlying work. Sessions can be sorted by cost or duration, then opened to inspect models, tokens, prompts, tool calls, MCP activity, failures, and conversation flow.
There are also separate views for tools, skills, and MCP servers. You can see which ones developers use, how widely they've been adopted, and where errors are coming from.
With GitHub connected, Dash0 can associate agent sessions with pull requests and track assisted PRs and cycle time. You can also compare model cost with delivery measurements instead of judging models by token price alone.
The catch
AI Coding Insights currently has purpose-built support for Claude Code and Cursor.
That's enough for teams centered on those tools, but organizations using a wider mix of coding agents won't get the same dedicated experience across the whole fleet.
Dash0 can ingest OpenTelemetry from other agents, but general telemetry ingestion isn't the same thing as purpose-built AI Coding Insights support.
Pricing model
AI Coding Insights costs $10 per monitored developer per month. Token volume, session count, tool calls, and span volume don't change that price.
A 300-developer rollout costs $3,000 per month, or $36,000 per year. At 500 developers, it's $60,000 per year.
The verdict
AI Coding Insights is one of the most mature products here for Claude Code monitoring.
It covers cost and adoption, then goes into sessions, tools, MCP activity, and GitHub delivery indicators without making you assemble those views yourself.
Its main limitation is agent coverage. If Claude Code and Cursor make up most of your coding-agent fleet, it's one of the most complete options in this comparison.
Try AI Coding Insights with a free 14-day trial.
3. Prometheus + Grafana (OSS)
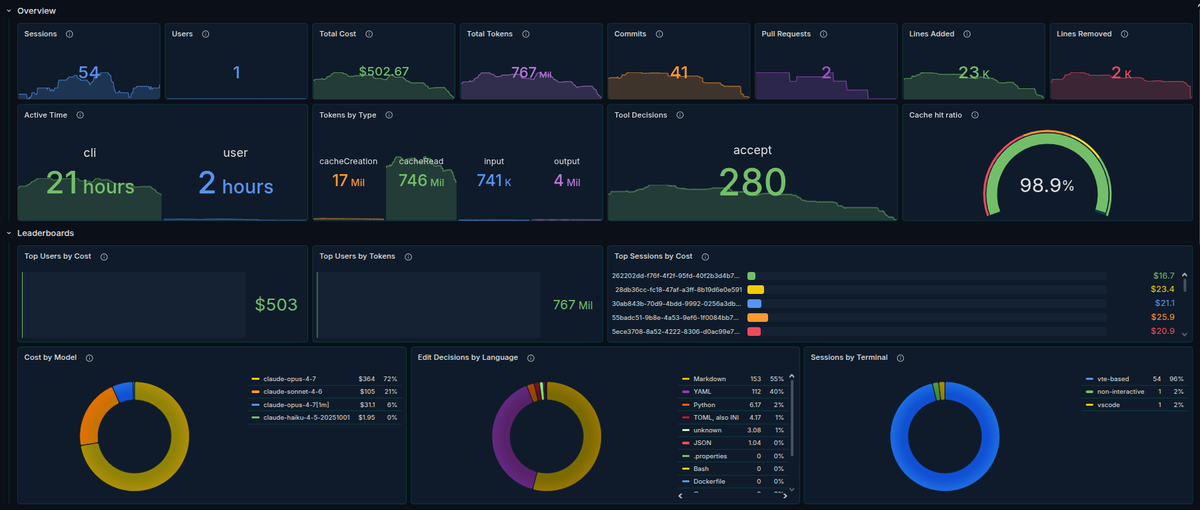
Prometheus and Grafana are the obvious open-source baseline if you mainly want Claude Code metrics.
Prometheus can ingest Claude Code's OpenTelemetry metrics, while Grafana gives you the dashboards. You can track sessions, tokens, estimated cost, active time, code changes, commits, pull requests, and permission decisions.
A simple setup looks like this:
1Claude Code -> OpenTelemetry Collector -> Prometheus -> Grafana
Prometheus can also accept OTLP metrics directly when you enable its receiver:
1prometheus --web.enable-otlp-receiver
What's good
You can run the whole setup locally, which makes it a good option for personal Claude Code monitoring. Nothing has to leave your machine, and you don't need a SaaS account just to experiment with the telemetry.
It's also a natural choice when your company already runs Prometheus and Grafana. Claude Code is just another metrics source, so you can reuse the infrastructure and PromQL knowledge you already have.
You aren't limited to someone else's dashboard either. You can build exactly the usage, cost, and adoption views you care about or start with dashboards published by the community.
The catch
Prometheus only handles the metrics part of Claude Code monitoring.
For all three OpenTelemetry signals, the stack starts to look more like LGTM: Loki for logs, Grafana for visualization, Tempo for traces, and Mimir for metrics at larger scale. Prometheus can still handle metrics for smaller deployments.
That gives you storage and querying for the full telemetry set, but you still have to build the Claude Code experience. Adoption dashboards, session views, tool analysis, alerts, and agent-specific queries are yours to create and maintain.
Pricing model
Prometheus and Grafana are open source, so you can run them locally for free.
If your organization already operates Prometheus, Grafana, or the wider LGTM stack, Claude Code telemetry is usually a marginal addition to infrastructure you're already paying for.
The verdict
Prometheus and Grafana work well for personal monitoring and for teams that already operate an open-source observability stack.
If you mainly want usage, cost, and fleet metrics, that's often enough. Once you want polished session analysis or coding-agent-specific workflows, you'll either have to build them or move to a more specialized product.
4. Amazon CloudWatch
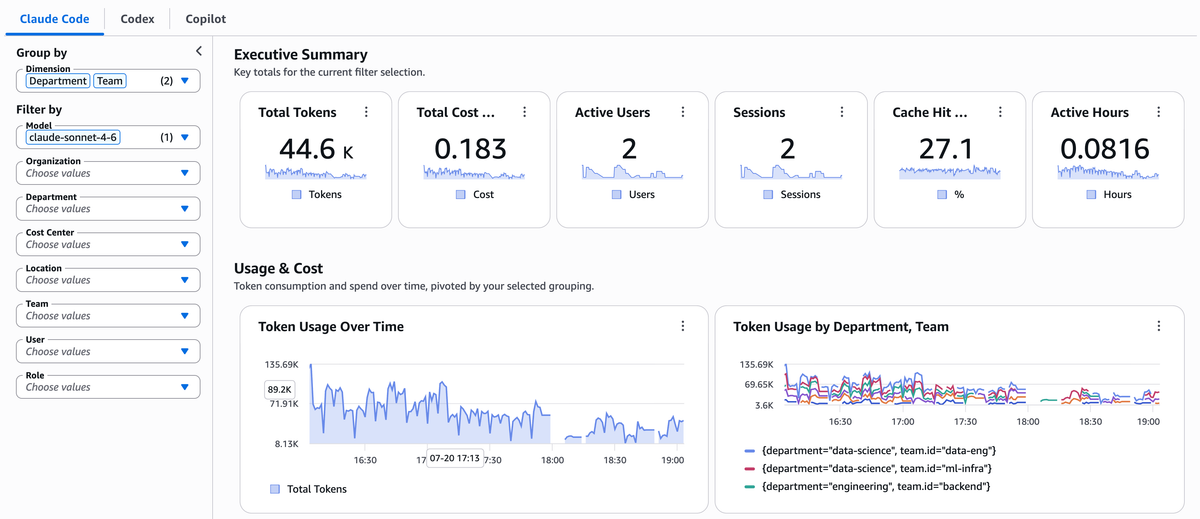
Amazon CloudWatch has a dedicated Coding Agent Insights experience for Claude Code, Codex, and GitHub Copilot.
AWS offers two Claude Code setup paths. An individual developer or small team can send OpenTelemetry metrics straight to CloudWatch's OTLP metrics endpoint using a bearer token. Larger organizations can use the Claude apps gateway to centralize authentication, configuration, model access, and telemetry routing.
Coding Agent Insights then turns the data into prebuilt dashboards for organization-wide coding-agent usage.
What's good
CloudWatch makes a lot of sense if AWS already handles your observability and identity infrastructure. You don't need a new monitoring stack just to see how Claude Code is being used.
The setup also has a clear path from one developer to a managed fleet. You can start with direct OTLP metrics and move to the Claude apps gateway when you need centralized credentials and policy.
Coding Agent Insights saves you from building the first set of dashboards, and it isn't limited to Claude Code. Codex and GitHub Copilot are supported too.
CloudWatch also supports PromQL for OpenTelemetry metrics, which is handy if your team already works with Prometheus.
The catch
Coding Agent Insights is mostly a fleet-level metrics product for Claude Code.
CloudWatch can ingest logs and traces elsewhere in the platform, but enabling those signals doesn't suddenly give Coding Agent Insights a purpose-built Claude Code session view.
If you want to open one session and break its duration down across model calls, permission waits, tools, and subagents, you'll need to build more of that investigation yourself.
Pricing model
There's no separate per-developer charge for Coding Agent Insights. You pay for the CloudWatch telemetry you ingest and retain.
For an existing AWS customer, Claude Code metrics may only add a small amount to an existing bill. The actual amount depends on your telemetry volume and which signals you keep.
The verdict
CloudWatch is a good fit for AWS shops that want centralized coding-agent usage and governance without introducing another vendor.
Its weakness is session-level depth. It's much better suited to fleet usage and cost monitoring than to detailed Claude Code execution analysis.
5. Datadog
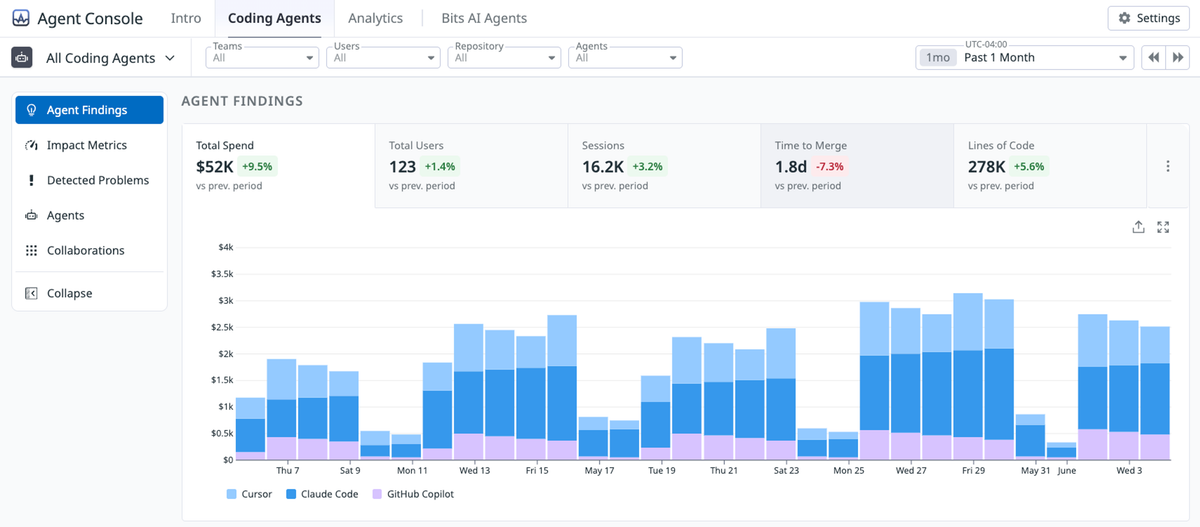
Datadog monitors Claude Code through Agent Console, which gives engineering teams one place to track coding-agent activity across an organization.
For Claude Code, Datadog supports Anthropic's Usage and Costs integration as well as direct OpenTelemetry export to Datadog. Agent Console also covers other coding assistants, so Claude Code doesn't have to be monitored in isolation.
What's good
Agent Console gives you ready-made views for coding-agent usage, spend, active users, sessions, and engineering activity instead of making you build them from raw telemetry.
It also works across several coding agents. That's useful in companies where Claude Code sits alongside Cursor, GitHub Copilot, Codex, or other tools.
Datadog becomes more attractive if it's already where your engineering telemetry lives. Claude Code data can sit beside application traces, logs, infrastructure, deployments, and software-delivery data rather than creating a new observability silo.
Agent Console can also correlate coding-agent activity with engineering measurements such as median time to merge, so its scope is broader than simple token and cost reporting.
The catch
Agent Console is still in preview.
The Claude Code experience is also weighted toward organization-level analytics. Direct OTLP gives Datadog access to richer Claude Code telemetry, but the product doesn't currently provide the same purpose-built session reconstruction as the most specialized options here.
Pricing model
Datadog doesn't currently publish a separate Claude Code-specific price for Agent Console.
For an existing Datadog customer, Claude Code monitoring may be an incremental use of a platform that's already under contract. The eventual cost depends on which Claude Code signals you send and how they map to the Datadog products you're already using.
The verdict
Datadog is a strong option if your company already uses it and wants coding agents folded into the same observability environment.
Agent Console has a broad multi-agent story and useful organization reporting. Its weaker point today is detailed, purpose-built reconstruction of individual Claude Code sessions.
6. Grafana Cloud
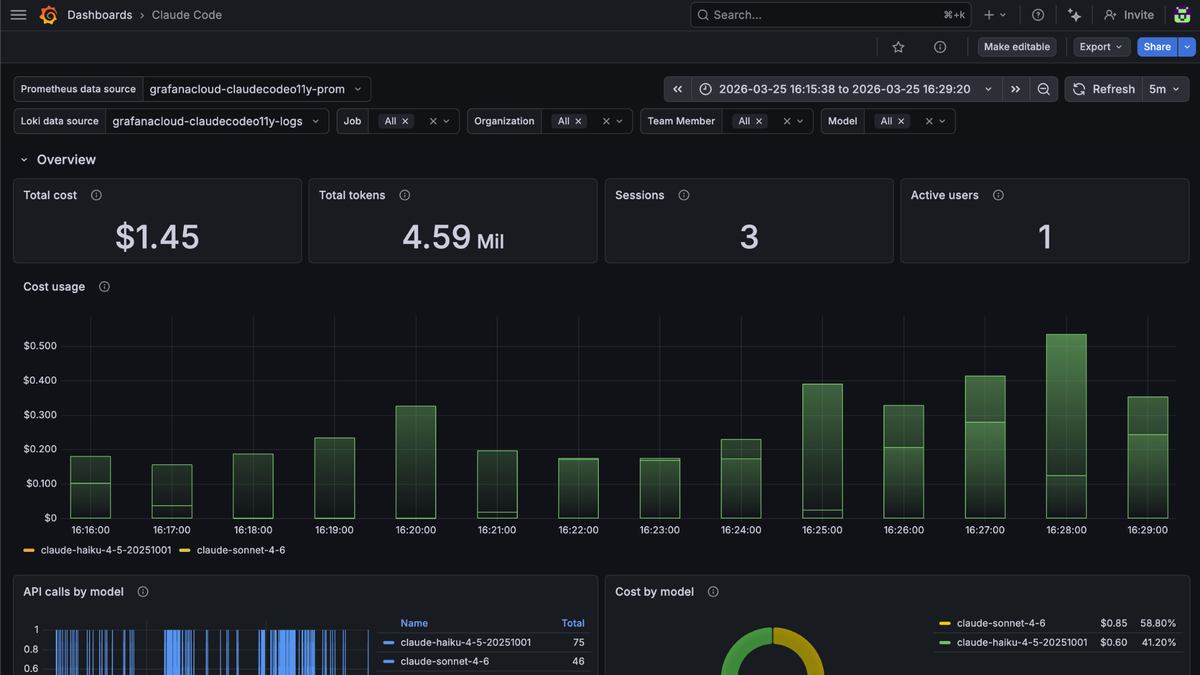
Grafana Cloud has a dedicated Claude Code integration that sends Claude Code metrics and logs over OTLP and installs prebuilt dashboards.
You can configure it for one developer or deploy it across an organization through Claude Code managed settings.
What's good
The integration gets you from telemetry to useful dashboards quickly. It comes with Claude Code views for stats, usage breakdowns, and productivity-oriented metrics, so you aren't starting with an empty Grafana instance.
You can query Claude Code's structured events as logs and send traces to Grafana Cloud separately if you enable tracing later.
There's also an MCP path for Claude Code. Grafana documents both a local
mcp-grafana setup and Grafana Cloud MCP tooling, so Claude Code can query
observability data from the coding workflow.
Grafana Cloud's free tier makes it easy to try this on a personal project before paying for a larger deployment.
The catch
The dedicated Claude Code integration currently configures metrics and logs, not a purpose-built trace experience.
Grafana Cloud can store traces, but you'll need to create the Claude Code-specific trace investigation yourself if you want to break down individual sessions by model request, tool, permission wait, or subagent.
Pricing model
Grafana Cloud has an always-free tier with limits on metrics, logs, and traces.
Paid plans are usage based. Metrics, logs, and traces have their own billing dimensions, so the price of Claude Code monitoring depends on which signals you send and how much data they generate.
The verdict
Grafana Cloud is a good fit if you already use Grafana or want a managed Claude Code dashboard without buying a dedicated coding-agent analytics product.
The prebuilt integration handles metrics and events well. Session tracing is where you'll have to do more of the work yourself.
7. Honeycomb
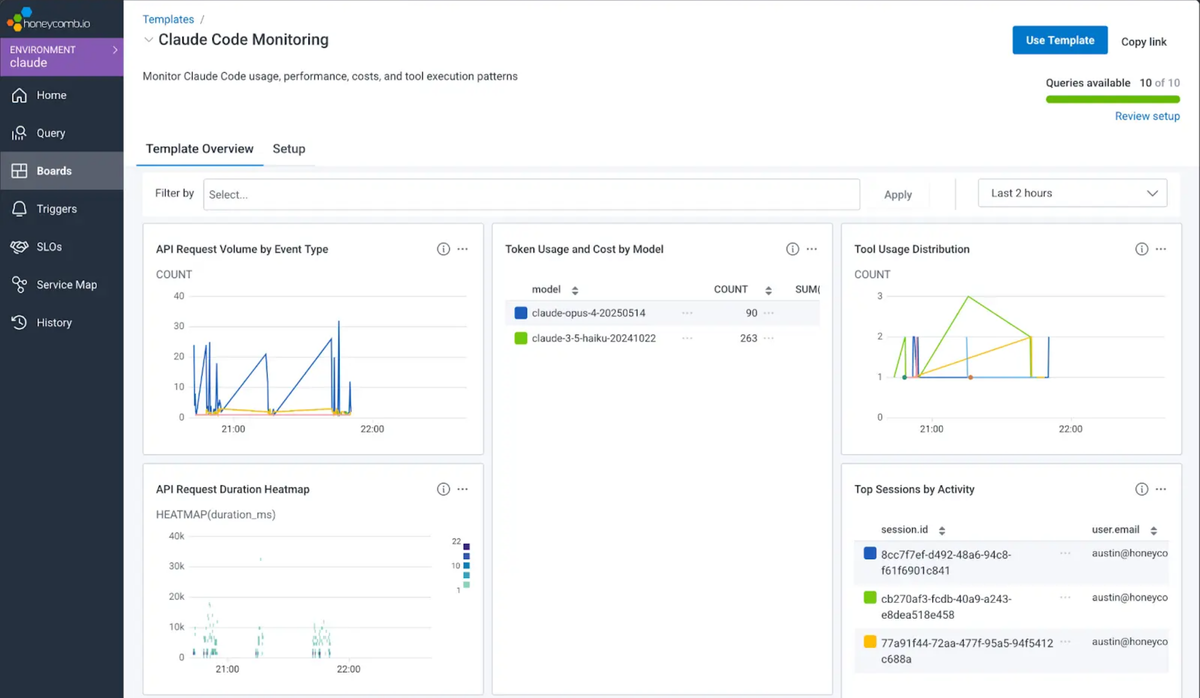
Honeycomb supports Claude Code monitoring with metrics, logs, and traces. It also publishes Claude Code-specific boards and investigation workflows rather than treating Claude Code as just another OTLP source.
Honeycomb has documented how its own engineering team uses this telemetry to track adoption, spend, models, API performance, tool behavior, and permission decisions.
What's good
Honeycomb has prebuilt Claude Code boards for usage, cost, and performance, so you don't have to begin with a blank query screen.
Its documented investigation workflows go deeper. They cover slow and expensive sessions, failing tools, permission waits, model usage, hooks, and compaction. That gives you a fairly clear route from an odd fleet-level number to the session behind it.
The MCP integration is another practical feature. Claude Code can query Honeycomb directly, inspect telemetry, run analyses, and work with Honeycomb data without leaving the coding session.
The catch
Honeycomb gives you good Claude Code building blocks, but it's still a general observability platform.
You can analyze adoption, cost, tools, and individual sessions, but you'll do more of the work yourself when you want opinionated organization-wide coding-agent reporting or delivery analysis.
Pricing model
Honeycomb's free tier includes up to 20 million events and 100 million metric data points per month, which is enough for personal use and smaller tests.
Paid pricing is driven mainly by event and metric volume rather than developer count. If you're already a Honeycomb customer, Claude Code may simply consume part of the telemetry capacity you're already paying for.
The verdict
Honeycomb is one of the better options if session investigation matters as much as fleet reporting.
Its Claude Code boards, documented investigations, and MCP support make it more useful out of the box than a generic tracing backend. The trade-off is that you'll still build more of the management and delivery reporting yourself.
8. SigNoz
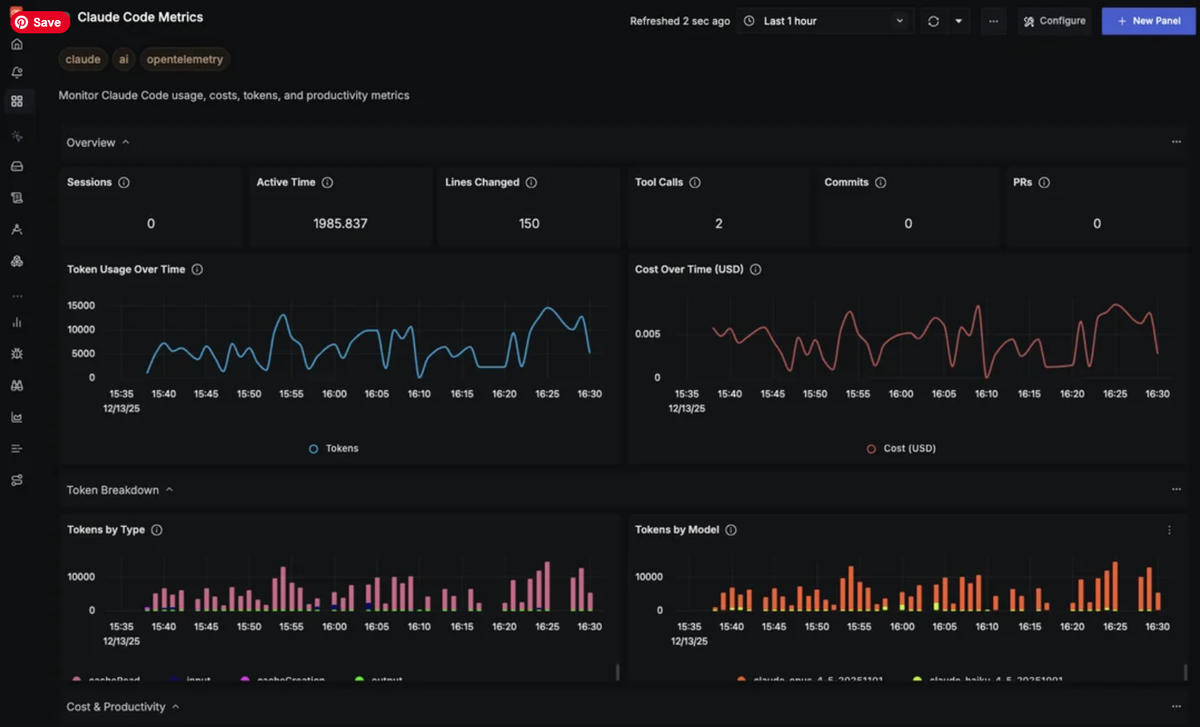
SigNoz has a dedicated Claude Code monitoring setup built around Claude Code's native OpenTelemetry output.
Its current guide covers metrics and structured logs for tokens, estimated cost, sessions, API performance, cache behavior, tool decisions, rate limits, errors, and retries.
What's good
SigNoz gives you Claude Code-specific dashboards and queries instead of an empty OTLP backend.
It can be used through SigNoz Cloud or self-hosted, which is useful if you want to keep coding-agent telemetry in infrastructure you control.
The wider AI monitoring catalog is another benefit. SigNoz has documented integrations for Codex, OpenCode, Claude Agent SDK, and other agent workloads, so your setup doesn't have to end with Claude Code.
SigNoz also has MCP tooling that lets coding assistants query metrics, logs, traces, alerts, and dashboards directly.
The catch
The main Claude Code integration is still centered on metrics and logs.
SigNoz now documents Claude Code's beta tracing configuration as well, but the dedicated experience doesn't yet provide the same polished session reconstruction as products that are built around coding-agent traces.
Pricing model
You can self-host SigNoz without a per-developer software fee.
SigNoz Cloud is usage based, so the cost depends on the metrics, logs, and traces you send rather than the number of Claude Code users.
The verdict
SigNoz is a good choice if you want an OpenTelemetry-based platform with both managed and self-hosted options.
It covers usage and operational monitoring well. You'll do more custom work if deep Claude Code session tracing is the main requirement.
Final thoughts
You don't need a dedicated Claude Code product just because Claude Code emits telemetry.
If you already have an observability setup for your services, start by seeing how far the platform you're already paying for gets you. The marginal cost may be small, and basic usage monitoring isn't hard to build.
The differences become clearer when you want more than tokens and spend. Session reconstruction, tool and MCP analysis, multi-agent reporting, and software-delivery context aren't equally developed across these products.
Dash0 AI Coding Insights is the most focused option in this comparison for teams that want those pieces already assembled. Prometheus and Grafana are hard to beat for local or low-cost metrics. CloudWatch makes sense in an AWS-heavy environment, while Datadog and Grafana Cloud fit naturally when they're already part of your observability stack. Honeycomb is particularly good for investigating sessions, and SigNoz gives you a credible self-hosted path.
For a deeper look at the telemetry Claude Code exposes, read Monitoring Claude Code Usage and Costs with OpenTelemetry.
To try AI Coding Insights with your own Claude Code sessions, sign up for a free 14-day Dash0 trial.