Teams usually start evaluating Graylog alternatives for one of two reasons: operational friction or cost.
On the operational side, Graylog can work well until a relatively small change exposes the complexity underneath it. A field that changes from a JSON number to a string, for example, can trigger OpenSearch mapper_parsing_exception errors and sharply reduce ingestion throughput. In one reported case, a cluster that had handled 10,000 events per second dropped to a few hundred while exceptions accumulated in MongoDB. Upgrades can involve similar coordination: Graylog's documented upgrade process may require sequential upgrades to MongoDB, the search backend, and Graylog itself, with version compatibility to manage at each step.
Cost is the other common reason to reassess the stack. Graylog Enterprise starts at $15,000 per year, while Graylog Security starts at $18,000 per year, with pricing based on daily volume or annual consumption. Those figures are modest compared with some enterprise logging platforms, but they can still change the economics for teams that began with Graylog Open and later need capabilities such as correlation, data tiering and archiving, Data Lake, LDAP or OIDC single sign-on, team management, or audit logs.
The challenge is that Graylog spans several categories at once. It combines log ingestion, processing, search, and—on paid plans—security and SIEM capabilities. Few alternatives replace all of those functions equally well, so choosing a replacement is less about finding a direct substitute than deciding which parts of the stack matter most.
This article compares ten Graylog alternatives across the factors that tend to matter most during a migration: supported ingest methods, storage and search architecture, replacements for pipeline rules, security capabilities, the practical limits of each open-source or free edition, and the pricing model. Where possible, claims are linked to primary sources.
What you're actually replacing when you replace Graylog
The four things Graylog does are usually bundled together in your head and separated in every alternative.
The first is the ingest surface. Graylog accepts syslog, CEF, GELF, Beats, HTTP JSON, IPFIX, NetFlow, and plain text as server-side inputs, plus an OpenTelemetry gRPC input for OTLP logs since 6.2, and it manages your collector fleet through Sidecar. Half the tools below expect OTLP and nothing else. That means the network appliances, firewalls, and legacy syslog senders you currently point straight at Graylog need an OpenTelemetry Collector or a Fluent Bit layer in front, and operating that fleet becomes your job rather than a server feature.
The second is processing. Streams, pipeline rules, extractors, lookup tables, and index sets are Graylog-specific configuration. None of it ports. Whatever you pick, someone rewrites that logic in ingest pipelines, Collector processors, visual pipeline builders, or query-time extraction. Budget for it honestly, because in most migrations this is the largest single chunk of work.
The third is search behavior. Graylog stores logs in an inverted index, so every extracted field is searchable and a request ID lookup is a cheap operation. Some of the cheapest alternatives index labels or resource attributes rather than content, which makes storage dramatically cheaper and makes that same request ID lookup a scan. That is the trade those tools deliberately made, and your team's debugging habits are built on the assumption Graylog made instead.
The fourth is security. Graylog Security is a real SIEM tier with Sigma rules, MITRE ATT&CK alignment, UEBA and anomaly detection, asset risk scoring, and guided response. If that is why you run Graylog, most of this list is irrelevant to you and only three or four entries are worth reading.
Two more things shape the decision. Graylog Open is licensed under version 1 of the Server Side Public License, which is source-available rather than OSI-approved open source, and section 13 has real implications if you offer log management as a service. And Graylog is logs only. The OTLP input maps resource and log attributes into Graylog fields, but there is no metrics or traces story, so a Graylog shop that wants correlation across signals is buying a second platform regardless.
Here are the criteria used for every tool below:
- Deployment model: self-managed, SaaS, or both, and how many stateful components you own
- Ingest surface: what you can point at it without building a collector tier
- Signal scope: logs only, or logs with metrics and traces in the same store
- Storage and query model: inverted index, columnar, or label index, and what that does to search
- Parsing and enrichment: what replaces Graylog pipeline rules and extractors
- Alerting and correlation: what is included versus licensed
- Security depth: detection content, RBAC, compliance posture
- Licensing: what the free or open edition actually permits
- Cost model: which dimensions the bill charges on, and what that incentivizes
At a glance
| Tool | Deployment | Ingest surface | Signals | Query model | Security depth | License | Cost model |
|---|---|---|---|---|---|---|---|
| Elastic Stack | Self-managed, Cloud Hosted, Serverless | Beats, Logstash, EDOT/OTLP, Fleet | Logs, metrics, traces | Inverted index; ES|QL, KQL, Lucene | Elastic Security: detection rules, MITRE | AGPL / ELv2 / SSPL, tiered features | Provisioned resources (Hosted) or per-GB ingest + per-GB retained (Serverless) |
| OpenSearch | Self-managed or AWS managed | Data Prepper, Fluent Bit, OTLP via collector | Logs, metrics, traces | Inverted index; DQL, PPL, SQL | Security plugin, no packaged detection content | Apache 2.0 | Free software; provisioned instance-hours + storage |
| Wazuh | Self-managed or Wazuh Cloud | Agents, syslog, cloud connectors | Security events, endpoint state | Inverted index via indexer | Full XDR/SIEM: FIM, SCA, vuln detection, active response | Apache 2.0 | Free software; infrastructure and support subscription |
| VictoriaLogs | Self-managed or VictoriaMetrics Cloud | OTLP, syslog, journald, Elasticsearch bulk, Filebeat, Vector, Fluent Bit | Logs only | Columnar LSM, full-text index on all tokens; LogsQL | None | Apache 2.0 community, licensed enterprise | Free self-hosted; Cloud bills deployment resources |
| Dash0 | SaaS (EU and North America regions) | OTLP only | Logs, metrics, traces, web events, synthetics | Columnar, partitioned by time and resource attributes; PromQL | Coarse RBAC, no SIEM content | Proprietary | Per million records for logs, spans and metric data points |
| OpenObserve | Self-managed or Cloud | OTLP, syslog, Prometheus remote write | Logs, metrics, traces, RUM | Parquet on object storage; SQL + PromQL | Sensitive data redaction, RBAC (Enterprise) | AGPL-3.0, Enterprise features gated | Free self-hosted; Enterprise free to 50 GB/day; Cloud per ingested volume |
| Grafana Loki | Self-managed or Grafana Cloud | OTLP native, Alloy, Fluent Bit, Vector | Logs only | Chunks in object storage, label index; LogQL | None | AGPLv3 | Free self-hosted; Cloud per-GB ingest plus per-user |
| SigNoz | Self-managed or SigNoz Cloud | OTLP only | Logs, metrics, traces | ClickHouse columnar; ClickHouse SQL builder | None | AGPL-3.0 | Free self-hosted; Cloud from $49/mo, $0.30/GB logs and traces |
| Splunk | Splunk Enterprise self-hosted or Splunk Cloud | Universal Forwarder, HEC, Edge Processor, OTel distro | Logs, metrics, traces | Proprietary index; SPL | Enterprise Security: mature SIEM, separate licence | Proprietary | Per GB/day ingested, or Splunk Virtual Compute units |
| Datadog Logs | SaaS | Datadog Agent, 200+ integrations, OTLP intake | Logs, metrics, traces, RUM | Proprietary index; Datadog log query syntax | Cloud SIEM, separate meter | Proprietary | Per-GB ingest plus per-million indexed events, plus Flex tiers |
Cost model descriptions are structural, not quotes. Rates for each tool are analyzed in its entry below.
1. Elastic Stack
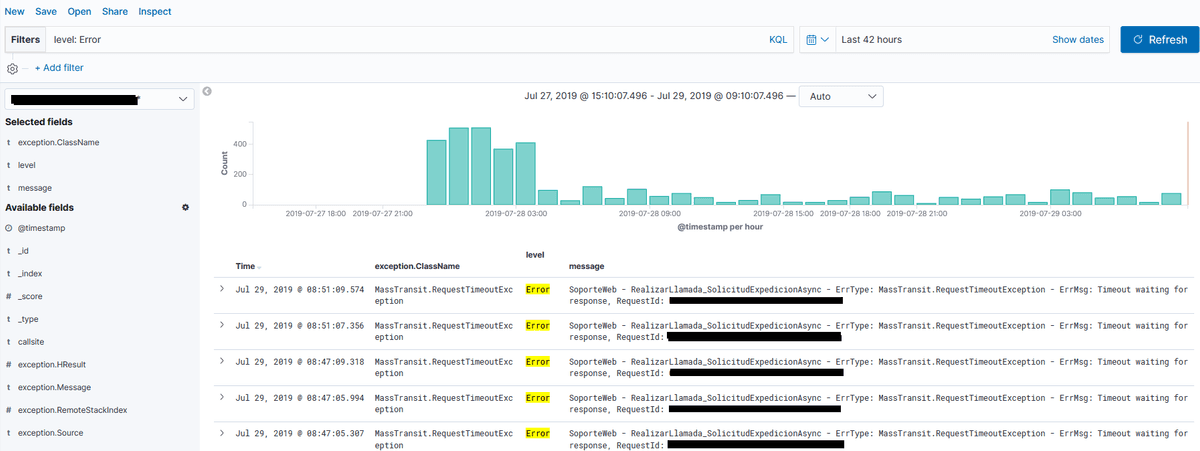
Elasticsearch and Kibana are where Graylog's storage lineage comes from, so this is the most direct comparison on the list. Elastic relicensed the Elasticsearch core under AGPL in 2024 alongside SSPL and the Elastic Licence, which put an OSI-approved option back on the table. Elasticsearch 9.x runs on Lucene 10, ES|QL reached production readiness, and Elastic ships its own OpenTelemetry distributions (EDOT) that send traces directly into Elasticsearch without an APM server.
What's good
- Your team already understands the storage engine. Graylog writes to OpenSearch, itself a fork of Elasticsearch 7.10. Moving to Elastic keeps the inverted-index behavior your search habits assume, and you gain Kibana, whose visualization layer peer reviewers consistently rate above Graylog's dashboard editor.
- logsdb changes the storage math. The logsdb index mode is applied automatically to new
logs-*-*data streams from 9.0, using index sorting, synthetic_source, and doc-value-only fields. Elastic reports up to 65% storage reduction against recent versions without it. - A first-class OpenTelemetry path. OTLP into Elasticsearch through EDOT, so instrumentation you write now is portable if you later leave.
- Logs and SIEM under one subscription. Elastic Security brings detection rules and MITRE mapping, which covers the Graylog Security use case without introducing another vendor.
The catch
Operating Elasticsearch at log volume is frequently the exact thing people are trying to escape. Shard sizing, index lifecycle policies, hot and warm and frozen tiers, and mapping explosions are all still yours. Mapping conflicts in particular behave the way they do under Graylog, because it is the same Lucene lineage and the same problem: a field that arrives as a number and then as a string breaks indexing for that field.
Feature tiering is aggressive. Basic logsdb capabilities are available on Standard, Gold, and Platinum, while the parts that actually drive the storage reduction, including synthetic _source, need Enterprise or Serverless. Plan on reading the subscription matrix before you model savings.
There is also a language tax. Between Lucene syntax, KQL, and ES|QL, your team learns a third dialect while it still remembers Graylog's.
Pricing model
Two very different meters, and picking the wrong one is expensive. Elastic Cloud Hosted charges for provisioned resources, so you pay for allocated RAM-hours and storage whether you use them or not. Elastic Observability Serverless charges per GB ingested plus per GB retained per month, with volume tiers that lower the marginal rate as you grow, and metrics in time-series index mode priced at 25% of the standard rate.
The detail that breaks forecasts: Elastic meters the uncompressed, normalized, fully enriched volume at the end of the ingest pipeline, which its own pricing pages warn will be much higher than the raw or compressed size on the wire. If you size a budget from your current Graylog GB/day figure, you will be wrong in the unhelpful direction. Self-managed carries no licence fee at the Basic level, and your cost is infrastructure plus the engineering time. Per-GB models push you toward stripping attributes and shortening log bodies, which is precisely the metadata you want at 3am.
The verdict
Elastic is the right move if you are leaving Graylog over the UI, the feature paywall, or the need for a real SIEM alongside logs, and you either have search-cluster expertise or are willing to buy it. It is the wrong move if you are leaving because you no longer want to run a search cluster, because that problem follows you.
2. OpenSearch and OpenSearch Dashboards
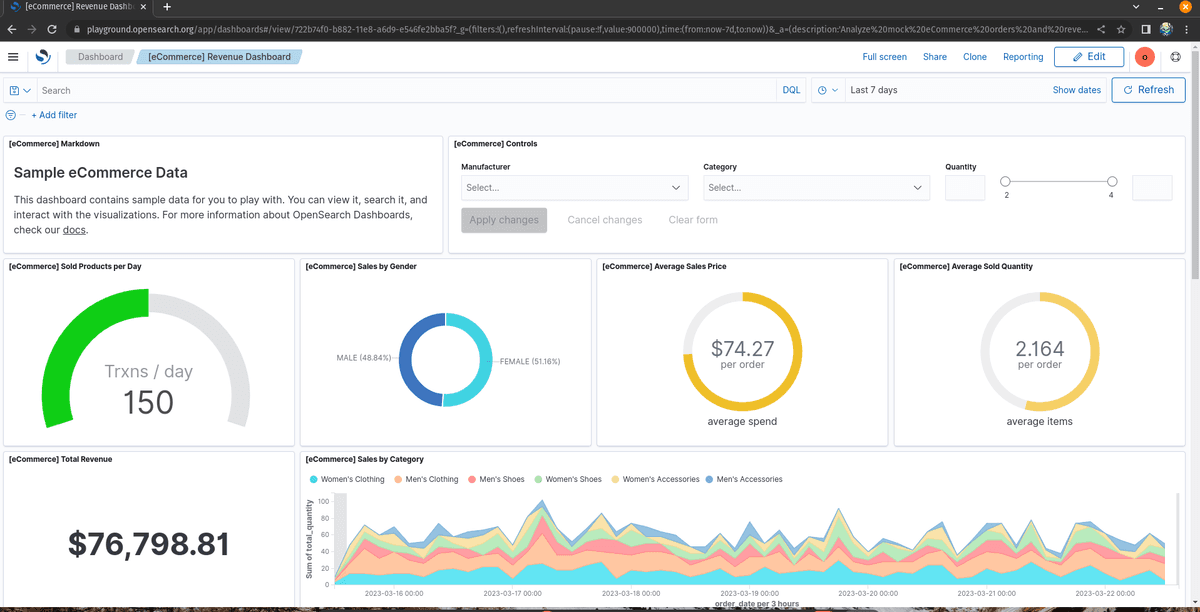
This is the option most Graylog evaluations skip, and it deserves a serious look. Graylog already stores your logs in OpenSearch, whether through the bundled Data Node or a self-managed cluster. Removing Graylog and pointing OpenSearch Dashboards at the same data deletes two components from your architecture, the Graylog server and MongoDB, without moving a byte of log data. The project has been governed by the OpenSearch Software Foundation under the Linux Foundation since September 2024, with more than 400 member organizations and the 3.x line current.
What's good
- Your data is already in it. No reindexing, no dual-write period, no cutover risk on the storage tier. You are removing a layer rather than swapping one.
- The features Graylog charges for are free here. Single sign-on, role-based access control, and audit logging ship in the standard distribution. Those are the same rows Graylog's comparison table marks as Enterprise-and-above.
- Apache 2.0 with vendor-neutral governance. If SSPL is your reason for leaving, this is the cleanest answer on the list, and no single vendor controls the roadmap.
- Real ingestion work is landing. Concurrent segment search is on by default, pull-based ingestion from Kafka and Kinesis reached general availability in 3.6, and gRPC transport is progressing.
The catch
You lose Graylog's ingest surface completely. The syslog, GELF, Beats, IPFIX, and NetFlow inputs, and the Sidecar collector management that goes with them, have no OpenSearch equivalent. You will run Data Prepper, Fluent Bit, or the OpenTelemetry Collector, and the fleet becomes yours to operate and upgrade.
You also lose streams, pipeline rules, and extractors. Ingest pipelines and Data Prepper processors can do equivalent work, but none of the configuration transfers. This is a rewrite, not a migration.
OpenSearch Dashboards forked from Kibana 7.10 and the two have diverged substantially. Kibana dashboards cannot be imported and Kibana plugins do not load, so if you were hoping to borrow community dashboards from the Elastic ecosystem, check compatibility first.
Finally, there is no packaged detection content. OpenSearch is the foundation people build a SIEM on, not a SIEM.
Pricing model
The software is free, which relocates rather than removes the cost. Amazon OpenSearch Service bills provisioned instance-hours plus EBS, UltraWarm, and cold storage, so the meter is capacity rather than data volume. That is predictable when your sizing is right and wasteful when it is not, and it never penalizes attribute richness or charges per seat. Self-managed is pure infrastructure. In both cases the dominant line item is labor, which is the number most vendor comparisons quietly leave out of the self-hosted column.
The verdict
The right pick when your objection to Graylog is licensing, cost, or the extra MongoDB dependency, and you have a platform team that already runs OpenSearch competently. The wrong pick if you were hoping to spend less time on the search tier, because you will spend more, having lost the layer that was doing your parsing and collector management.
3. Wazuh
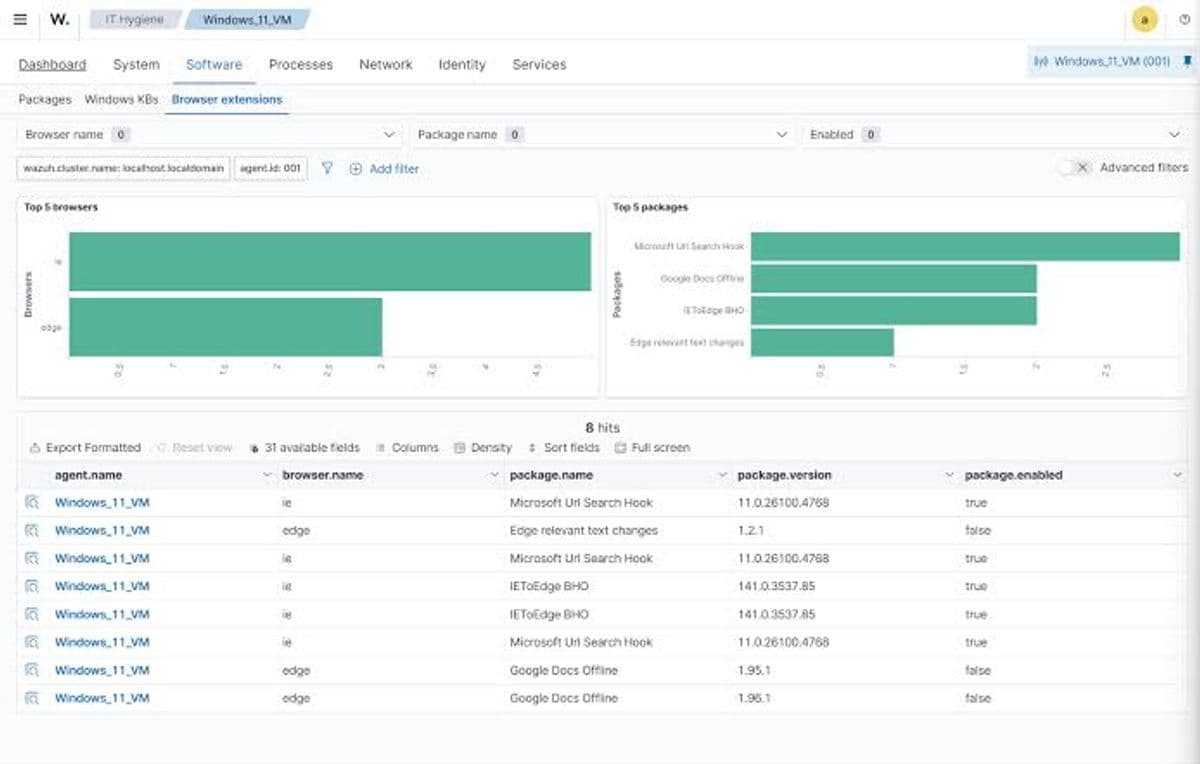
Wazuh is a free, Apache 2.0 unified XDR and SIEM platform. It deploys agents on Windows, Linux, and macOS to do log analysis, file integrity monitoring, vulnerability detection, security configuration assessment, and active response. Historically it stored data in an OpenSearch-based indexer; the 5.0 beta replaces that with a purpose-built indexer component. This entry exists because a large share of Graylog installations are really SIEMs in disguise, and for those teams the rest of this list mostly misses the point.
What's good
- It covers the Graylog Security half at no licence cost. Detection rules, file integrity monitoring, security configuration assessment policies (a Windows Server 2025 benchmark landed in 4.14.2), vulnerability detection, and the audit trail that PCI DSS and HIPAA assessors expect are all in the base product.
- Agents collect telemetry Graylog never saw. Graylog receives what you send it. Wazuh's agents inspect endpoint state, which is a different and often more useful class of evidence during an investigation.
- Active response closes the loop. Blocking an IP or disabling an account automatically is built in rather than bolted on through a webhook.
- Documentation and community are a genuine strength, and reviewers comparing it against commercial SIEMs single this out repeatedly.
The catch
Wazuh is not a general-purpose log platform. It is organized around security-relevant events. If a large fraction of your Graylog volume is application logs your developers search during incidents, Wazuh serves that workload badly and you will end up running two systems.
Dashboards and ad-hoc visualization are weaker than Graylog's, which is a low bar to be under. You will notice it within a week.
You are also still operating an indexer cluster, so the day-two operational profile resembles what you have now rather than improving on it. And the 5.0 indexer replacement is a migration to plan for, not a version bump you take on a Friday.
Agent rollout across a fleet is its own project, with its own compatibility matrix between agent and manager versions.
Pricing model
The platform is free with no ingestion cap, and Wazuh sells a managed cloud plus support subscriptions. Because there is no per-GB or per-agent meter, cost does not scale with how verbose your logs are. That is unusual in this category, and it deserves real weight if you are comparing against per-GB SaaS. What you pay instead is infrastructure and security engineering time to tune rules and suppress noise. That is the dominant cost of any SIEM regardless of licence, and it is the line item most likely to be underestimated when the software is free.
The verdict
Pick Wazuh if you were running Graylog primarily as an affordable SIEM and the $18,000/yr floor for Graylog Security is what sent you looking. Pair it with one of the log-focused options below for application logs. If your Graylog is mostly application and infrastructure logs, skip this entry entirely.
4. VictoriaLogs
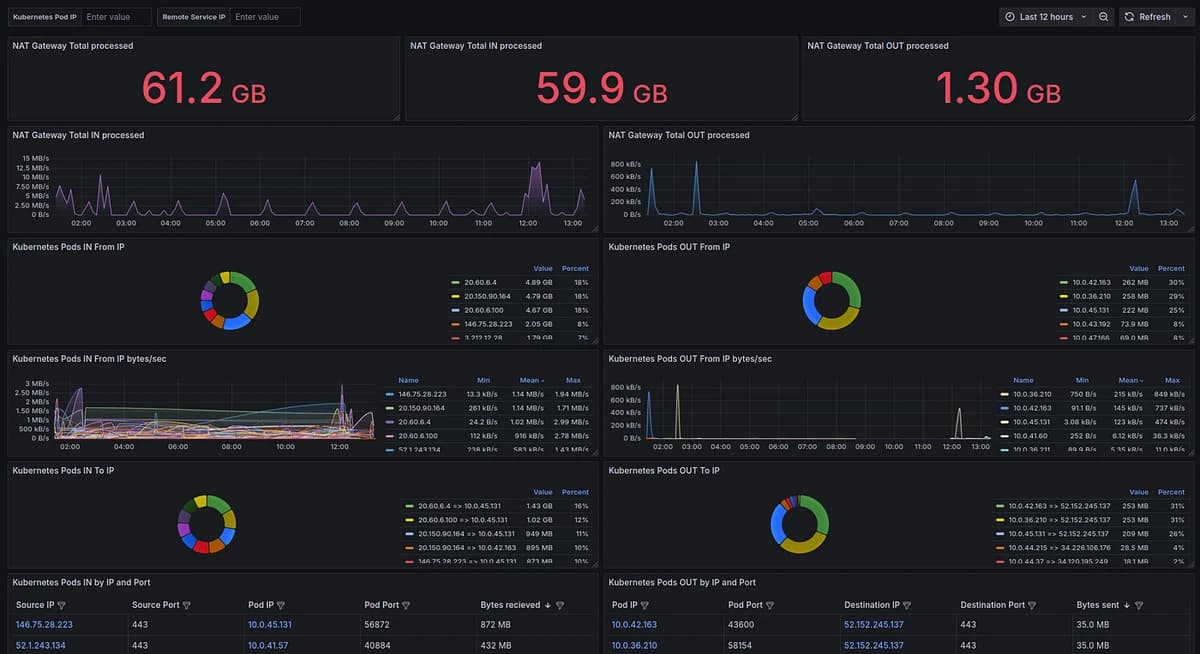
VictoriaLogs is a purpose-built log database from the VictoriaMetrics team, available as a single executable or a horizontally scalable cluster. It uses columnar LSM-style storage with per-field indices and SIMD-accelerated scanning, and its LogsQL query language supports full-text filtering, query-time field extraction, and statistical pipes.
What's good
- The ingest surface is unusually broad for a lean tool. It accepts OpenTelemetry, syslog, journald, Elasticsearch bulk, Filebeat, Fluent Bit, Fluentd, Logstash, Vector, and Splunk formats, so a meaningful share of your existing Graylog senders can be repointed rather than rebuilt. Among the lean self-hosted options, this is the one that most reduces migration work.
- Full-text index on all tokens. High-cardinality search on trace IDs, IP addresses, and request IDs is a lookup rather than a scan, which is the property Graylog gave you and label-indexed stores take away.
- Resource efficiency is the headline claim and it holds up in independent testing. A published Truefoundry benchmark on 500 GB over seven days on identical hardware reported 94% lower query latency, roughly 37% smaller storage, and under half the CPU and RAM versus Loki. Single-workload benchmarks are directional rather than definitive, but the direction is consistent across several published tests.
- One binary. No MongoDB, no separate index cluster, no version matrix.
The catch
It is deliberately narrow. No metrics, no traces, no dashboards of its own, no authentication. You bring Grafana or Perses for visualization, vmalert for alerting, and vmauth for authentication and public-network protection. That is four components you assemble and operate. It is a different kind of work from Graylog's, and not obviously less of it.
There is no security content at all: no detection rules, no compliance packs, no case management.
There is also no processing pipeline comparable to Graylog's pipeline rules. Field extraction happens at query time in LogsQL or upstream in your collector, which is workable but means the transformation logic lives somewhere other than the log store.
The ecosystem is much smaller than Elastic's or Graylog's. Expect to read source and GitHub issues more often than documentation.
Pricing model
The community edition is free to self-host with no volume cap, and an enterprise edition adds licensed capabilities and support. VictoriaMetrics Cloud bills on deployment resources, compute, storage, and networking, rather than an ingest meter, so forecasting depends on sizing and retention rather than on how chatty your applications are. The practical effect: verbose debug logging costs you disk rather than a line item, the opposite incentive from every per-GB model on this list. In exchange you carry the sizing risk instead of the vendor.
The verdict
The strongest choice if you want logs on your own infrastructure, your objection to Graylog is the three-component stack, and you are comfortable assembling the surrounding pieces. The wrong choice if you need one product that also handles dashboards, alerting, and access control, because that is explicitly not what this is.
5. Dash0
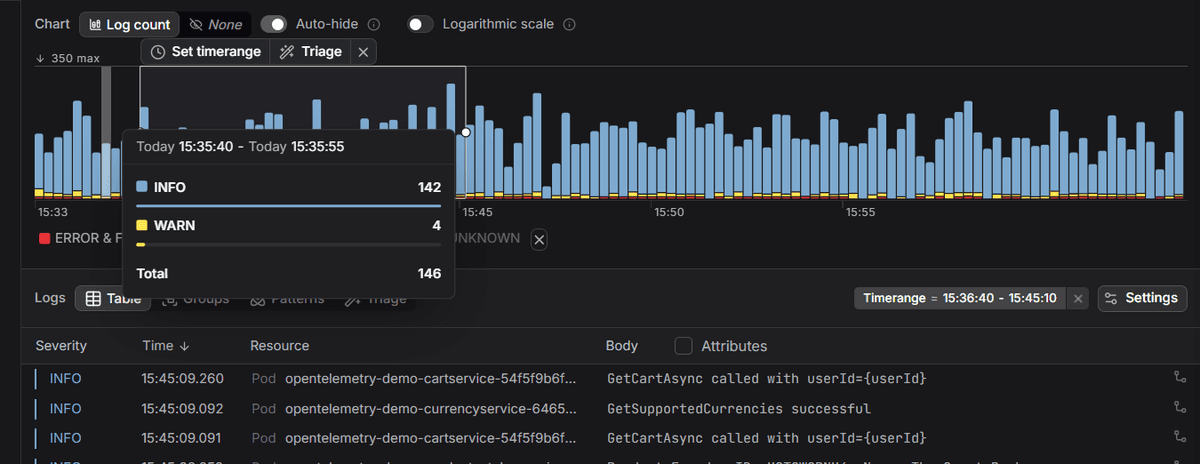
Dash0 is an OpenTelemetry-native platform covering logs, metrics, traces, web events, and synthetic monitoring in one product, built on OTLP for ingest, PromQL for querying every signal, and Perses for dashboards. It runs as SaaS with regions in the EU, on AWS and GCP, and in North America.
What's good
- PromQL across signals, including logs. Synthetic metrics derive counts, error rates, and latency percentiles from raw logs and spans without pre-defined aggregations, and check rules are PromQL expressions, so a log query becomes an alert without switching language. In Graylog, search syntax, aggregation widgets, and event definitions are three separate mechanisms.
- Log AI replaces a category of pipeline rule. Pattern mining groups similar messages, variable extraction pulls IDs and status codes out of free-text bodies, and severity inference fills in levels that were never set, all during ingestion. For a team sitting on a pile of extractors and Grok patterns, this part of the migration gets cheaper rather than harder.
- Reduced instrumentation lock-in. OTLP in, PromQL for queries, Perses-compatible dashboards, so instrumentation and telemetry export stay portable. Alerts, investigation workflows, and access control still create switching cost, as they do everywhere else here.
- Spam filters drop telemetry before storage and billing, and export as Collector configuration if you prefer to filter upstream.
The catch
There are no native syslog, GELF, or Beats inputs. Everything arrives as OTLP, so you stand up and operate an OpenTelemetry Collector fleet with the filelog, syslog, journald, and fluentforward receivers. For an estate full of network appliances and legacy syslog senders, that is the bulk of the migration work, and Graylog was doing it as a server feature.
It is not a SIEM. No Sigma rules, no MITRE ATT&CK mapping, no UEBA, no asset risk scoring, no case management, no compliance report packs. If you run Graylog Security, Dash0 replaces the log-management half and nothing else. Access control is coarser too: two organization roles plus dataset-level permissions and SAML single sign-on, where a security operations team that needs analyst-tier separation will feel the gap immediately.
Query performance also depends on your resource attributes in a way it does not on an inverted index. Storage is columnar and partitioned by time and resource attributes, so filtering on service.name prunes whole partitions and returns fast, while an unscoped full-text search does not. And it is SaaS only, so teams that chose Graylog to keep log data inside their own perimeter cannot reproduce that here.
Pricing model
Consumption-based, with no per-seat fee, no per-host fee, and no base platform charge. Log records, spans, span events, and web events bill per million, metric data points bill per million, and synthetic API checks bill per thousand runs, all at published rates.
The unit is what matters here. Billing counts records rather than gigabytes, so a verbose line carrying a full stack trace costs the same as a one-line health check, which inverts the per-GB incentive to strip metadata. There is no separate query charge. The friction is forecasting: if you have only ever measured logs in GB/day, converting to records per month is a harder estimate than reading a rate card. Agent0 usage is metered separately in credits.
The verdict
Fits teams whose Graylog is mostly application and infrastructure logs from cloud-native services, who want traces and metrics in the same query surface, and who will run a Collector as the ingest tier. A poor fit if you need on-premises deployment or a SIEM. More on the log management page.
6. OpenObserve
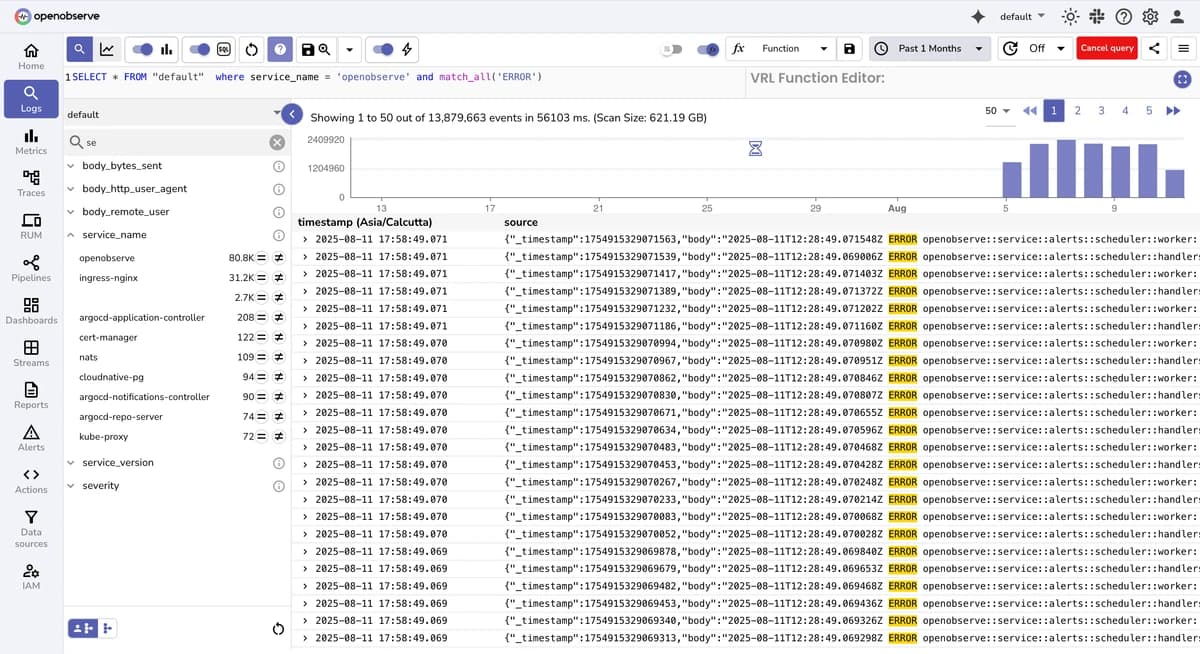
OpenObserve is an AGPL-3.0 platform written in Rust that runs as a single binary and writes Apache Parquet directly to object storage, whether S3, GCS, Azure Blob, or MinIO, with stateless compute on top. It covers logs, metrics, traces, real user monitoring, session replay, error tracking, and ingest pipelines. Queries use SQL for logs and PromQL for metrics. The project passed 20,000 GitHub stars in July 2026, and the vendor reports more than 7,000 organizations running it.
What's good
- There is no database tier. This is the largest architectural difference from Graylog on the whole list. No cluster to size, tune, or upgrade in lockstep, and durability is object storage's problem rather than yours.
- Object storage economics. The project claims roughly 140x lower storage cost than Elasticsearch on typical log workloads, with the honest caveat that results vary with data entropy and cardinality. Discount that number heavily and Parquet on S3 against a replicated Lucene index is still not a close contest on cost per retained GB.
- SQL rather than another DSL. For a team currently maintaining Graylog search syntax and pipeline rules, SQL is a smaller ask than learning a proprietary query language.
- Visual ingest pipelines. Parsing, JSON flattening, attribute extraction, and sensitive-field handling are configured in the UI, which makes this the closest analogue to Graylog pipeline rules among the self-hosted options.
The catch
The open-source headline is not the full picture. Single sign-on, role-based access control, sensitive data redaction, federated search across clusters, extended retention, cipher keys, and workload quality-of-service are Enterprise features, shipped as separate binaries behind a licence key. Enterprise is free up to 50 GB/day of ingestion, which is genuinely generous, but the moment you cross that line you are in a sales conversation with no published rate card.
Object storage trades latency for cost. Cold queries over long windows hit S3, and caching narrows but does not close the gap against local NVMe with a warm index. If your incident workflow involves repeatedly widening the time range, feel that latency during a trial rather than after.
The trace interface has lagged the rest of the product, and teams have historically pointed Jaeger or a Grafana data source at it instead. It is also a young product from a small vendor, with fewer public postmortems and fewer engineers who have run it at scale to hire.
Pricing model
Self-hosted community is free with no ingest cap. Self-hosted Enterprise is free to 50 GB/day. OpenObserve Cloud moved to fully usage-based pricing on ingested volume in June 2025, dropping both the minimum fee and the free cloud tier. Enterprise above the free ceiling is quote-based, which counts against it in a comparison where most competitors publish rates. Because the resource footprint is small, the self-hosted infrastructure bill for a given volume tends to land well below self-hosted Elasticsearch, which is the entire point of the architecture. For a fuller treatment of where it fits, we have a separate piece on OpenObserve alternatives.
The verdict
The best fit if you want Graylog's self-hosted control without Graylog's stack, and 50 GB/day covers your volume. If you are above that line and need single sign-on and role-based access control, get the quote before you commit engineering time to a migration.
7. Grafana Loki
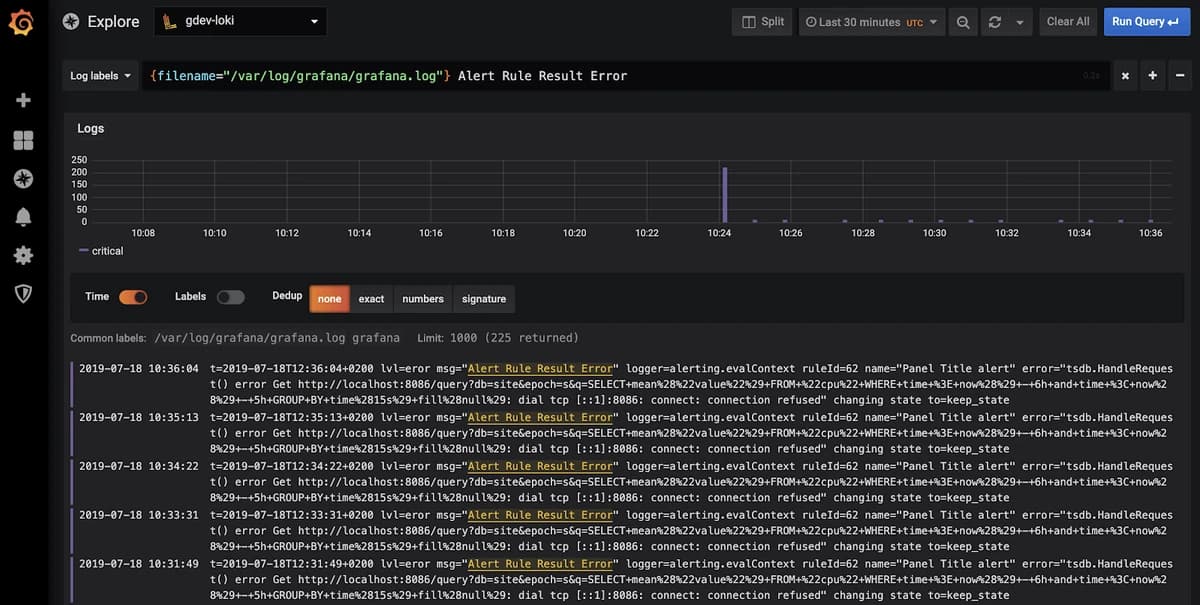
Loki is Grafana Labs' log aggregation system. It stores compressed chunks in object storage with an index built from stream labels rather than log content, queried with LogQL. Since 3.0 it has a native OTLP endpoint, so the old Loki exporter is no longer needed, and structured metadata carries OpenTelemetry attributes. The current line is 3.6.
What's good
- You very likely already run Grafana. If dashboards are where your team looks first, putting logs behind the same pane is the lowest-friction change available.
- Object storage plus a small index is why it is cheap. Indexing labels instead of content keeps the index tiny, and the chunks live on commodity storage.
- Native OTLP ingestion removed a translation layer that used to be a reliable source of confusion for OpenTelemetry users.
- LogQL converts filters into metrics. Turning a log pattern into a rate and alerting on it through the same alerting stack you already use is well-trodden.
The catch
Labels are the whole game and getting them wrong is punishing. High-cardinality labels make Loki build a huge index and flush thousands of tiny chunks, and Grafana's own labels documentation tells you to prefer few labels with bounded values. Coming from Graylog, where every extracted field is searchable, this is a real change in how your team debugs. Looking up a single request ID becomes a scan across chunks rather than an index lookup.
Bloom-filter query acceleration, the feature aimed squarely at that problem, has remained experimental across the 3.x line and was rearchitected mid-series when the Bloom Compactor was removed and replaced by a Bloom Planner and Bloom Builder. Do not plan a migration on the assumption it will land.
Component churn is a real operational tax. Promtail reached end of life in March 2026, replaced by Grafana Alloy. Simple Scalable Deployment mode is slated for deprecation before Loki 4.0, and the Loki Helm chart moved to a community-maintained repository. Each is manageable, and together they mean your log pipeline is something you revisit rather than something you finish.
Signals stay separate. Grafana's architecture uses a different backend and a different query language per signal, so correlating a log line with a trace and a metric means three stores and three dialects. It also means Grafana Labs is monetizing an open-source portfolio across all of them, which constrains how quickly the correlation and AI layers can advance compared with vendors betting on a single store.
There is no security content and no case management.
Pricing model
Self-hosted Loki is free under AGPLv3, and your cost is object storage plus compute for ingesters, queriers, and compactors, plus the engineering time to keep a distributed system healthy. Grafana Cloud Logs bills per GB ingested with retention tiers, plus per-user charges at the platform level, which reintroduces the seat dimension self-hosting avoids. Per-GB and per-user push in two directions at once: send fewer logs, and let fewer people look at them. The first is sometimes healthy discipline. The second works against incident response, and I would push back hard on it in a contract negotiation.
The verdict
Pick Loki if Grafana is already your front end, your logs are Kubernetes-shaped with clean bounded labels, and cost per retained GB is the number you are optimizing. Do not pick it if your team's muscle memory is full-text search across arbitrary fields, because that is the workload Loki's index deliberately does not serve.
8. SigNoz
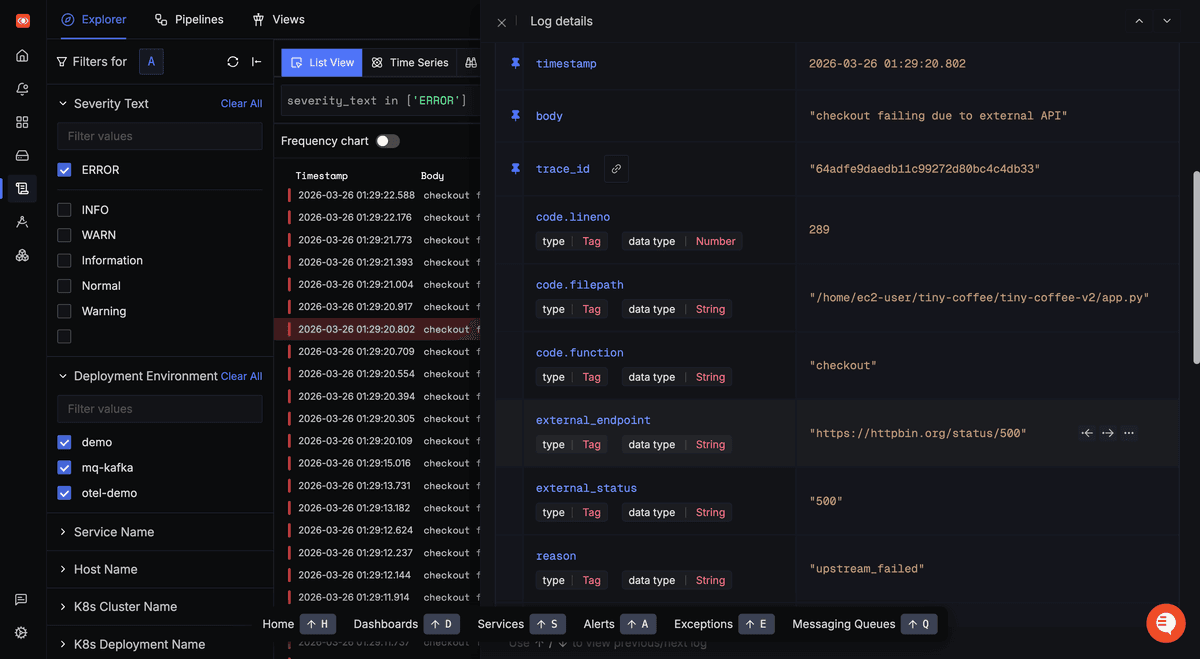
SigNoz is an AGPL-3.0, OpenTelemetry-native platform that stores logs, metrics, and traces in ClickHouse behind a single correlation model. It runs self-hosted through Docker Compose or a Helm chart, or as SigNoz Cloud.
What's good
- One store, one correlation model. Jump from a span to the log records that span emitted, filtered by the same attributes. Graylog cannot do this at all, because it has no traces.
- ClickHouse handles full-text log search and high-cardinality queries on modest hardware, which is exactly the property Loki's label index gives up. If your objection to the cheap options is search behavior, this is the answer among the open-source entries.
- Visual log pipelines parse unstructured logs, extract attributes, flatten nested JSON, and mask sensitive fields through a UI. Alongside OpenObserve, this is the closest like-for-like replacement for Graylog pipeline rules.
- OTLP in means one endpoint change if you later leave. Your instrumentation stays portable.
The catch
You have traded MongoDB plus OpenSearch for ClickHouse plus ClickHouse Keeper plus PostgreSQL. That is not fewer stateful components, and ClickHouse at streaming-insert volume brings its own well-documented pain: merge pressure, slow asynchronous mutations for deletes, and compute and storage that scale together rather than independently. If your reason for leaving Graylog is the operational burden of a multi-component stack, read that sentence twice.
The AGPL-3.0 licence creates review work if you embed or resell, which is a smaller concern than SSPL but not zero.
Single sign-on and role-based access control have lagged the SaaS field, and the tier where data-control and compliance features live starts at $4,000/month, a steep step up from the $49/month Teams plan. For a mid-market team that needs SSO and nothing else from that tier, the jump is hard to justify.
There is no security detection content, no SIEM workflow, and no compliance reporting, and the integration catalog is smaller than Elastic's or Graylog Illuminate's.
Pricing model
The community edition is free and self-hosted with no data caps. SigNoz Cloud starts at $49/month including $49 of usage, then charges $0.30/GB ingested for logs and traces with 15-day retention, and $0.10 per million metric samples. Enterprise starts at $4,000/month. Per-GB on logs means verbose logging costs money, and the mitigation SigNoz ships is a good one: you can set hard ingestion limits so the bill cannot run away. That converts an open-ended cost into a decision you make in advance, which is more than most per-GB vendors offer.
The verdict
The natural pick if the real problem is that Graylog only does logs and you want traces and metrics in the same query surface, and you either want SaaS or already run ClickHouse well. If you were hoping to reduce the number of stateful systems your platform team babysits, self-hosted SigNoz does not do that.
9. Splunk
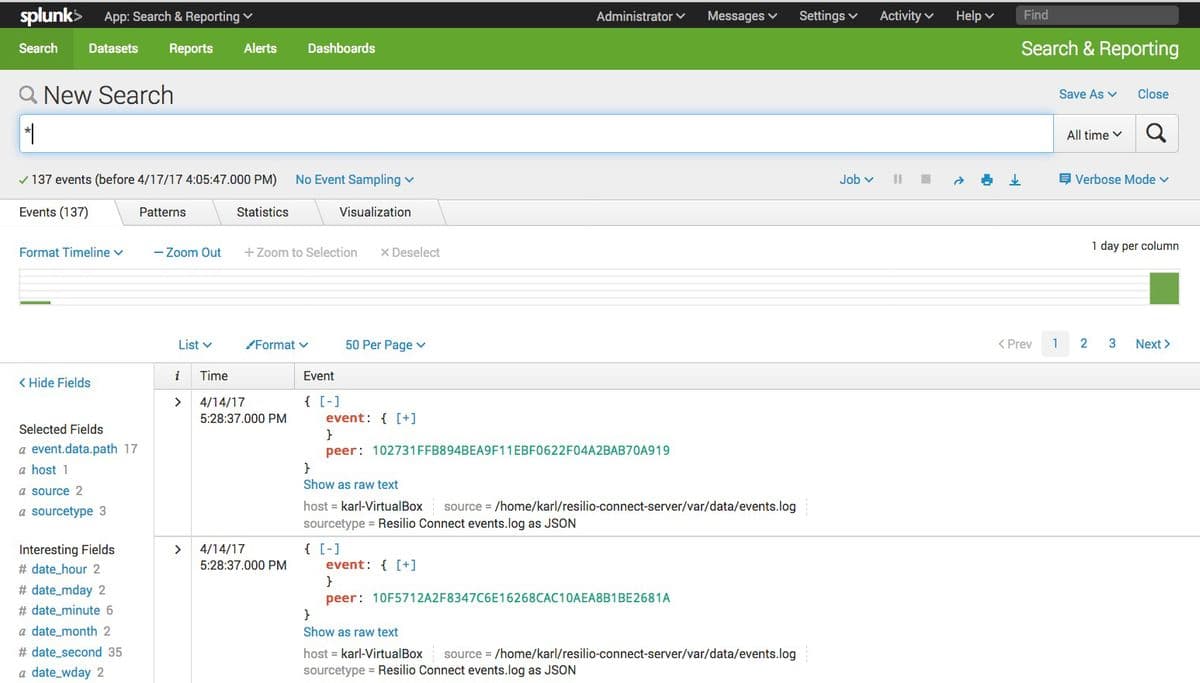
Splunk has been a Cisco company since the acquisition closed in March 2024. It remains the reference point for log analytics and SIEM at enterprise scale, available as self-hosted Splunk Enterprise or Splunk Cloud Platform, with Splunk Enterprise Security as the SIEM layer.
What's good
- SPL is still the most expressive analytics language in this category. Nothing else here handles multi-stage transformations, joins, and statistical operations over log data with the same fluency, and analysts who know it are genuinely fast.
- Splunkbase and Enterprise Security are unmatched for breadth. Nearly every enterprise vendor has a Splunk app. Notable events, risk-based alerting, and compliance dashboards are mature in a way open-source detection content is not.
- It scales past the point where the cheaper options need careful engineering, and there is a deep pool of practitioners to hire.
- Edge Processor and a Splunk OpenTelemetry Collector distribution let you filter and route before data reaches the meter, which matters a great deal given how that meter works.
The catch
Cost is the reason people leave Splunk, not the reason they arrive. If Graylog's five-figure floor felt steep, nothing in a Splunk quote will read as relief.
Under ingest pricing, compression at rest does not reduce the bill. One GB ingested is one GB billed regardless of how it sits on disk, and that single rule explains most Splunk budget overruns.
Enterprise Security is licensed separately on top of the platform, and independent analyses put it at roughly 50% to 100% on top of base ingest cost, partly because notable-event processing and risk scoring themselves increase indexed volume.
Workload pricing swaps the volume meter for a compute meter, which is better for write-heavy read-light estates and worse if your analysts run constant correlation searches and real-time dashboards. It is also harder to forecast, because your bill now moves with team behavior rather than data volume.
Almost nothing is published. You will run a sales cycle to discover your own price, which makes side-by-side evaluation against tools with public rate cards structurally unfair to you.
Pricing model
Two models, and the choice between them is the most consequential decision in a Splunk contract. Ingest pricing charges per GB indexed per day. Workload pricing charges for Splunk Virtual Compute units, where indexing, searching, alerting, and dashboard rendering all consume SVCs, sold in packs with ingest, search-compute, and concurrency envelopes plus overage rates. Splunk Observability Cloud is priced separately on published per-host tiers, which is the one part of the portfolio you can budget without a call. Verify current terms on Splunk's pricing page.
The two models nudge you in different directions. Ingest pricing pushes you to filter aggressively upstream, which is broadly healthy and is why Edge Processor exists. Workload pricing pushes you to query less, a considerably worse thing to be nudged toward when the whole point of centralizing logs is that people look at them.
The verdict
Pick Splunk if you are a regulated enterprise, you need SIEM depth and contractual accountability, and the budget exists. If you were running Graylog Open on three VMs specifically to avoid this class of spend, this is the wrong direction on every axis.
10. Datadog Log Management
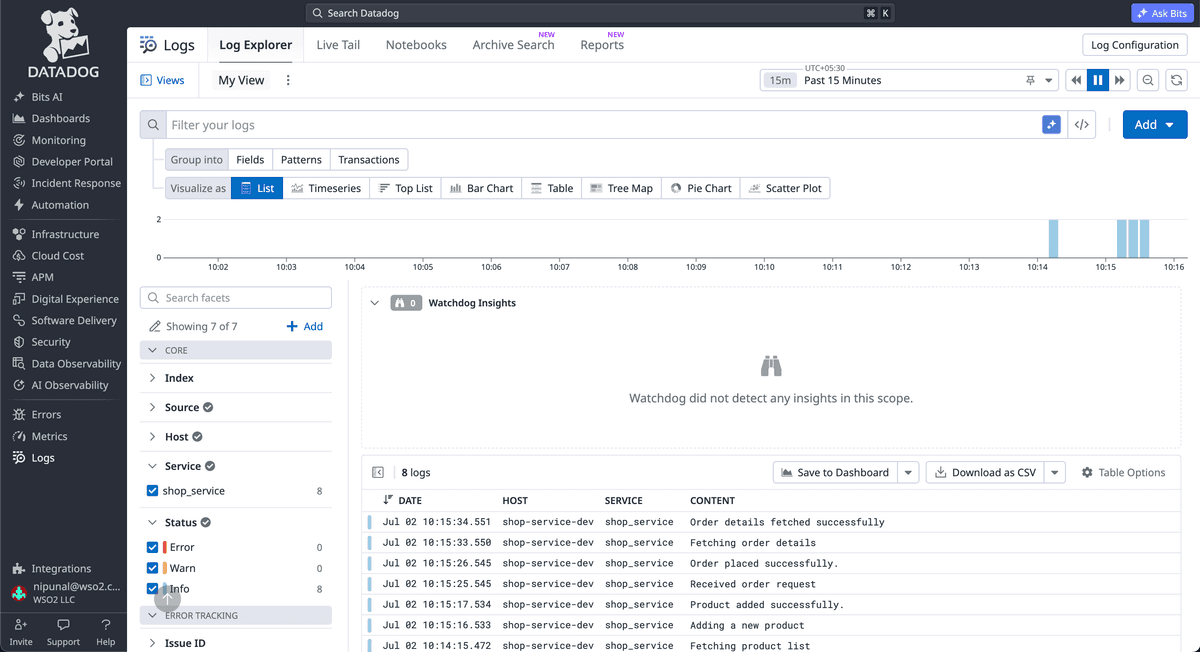
Datadog Log Management is fully managed, integrates with more than 200 sources, and is built on a "Logging without Limits" model: ingest everything, then decide what to index. Cloud SIEM analyzes ingested logs for security signals. OTLP data is accepted, though the product's native path is the Datadog Agent and its own tagging model.
What's good
- Zero operations. No cluster, no MongoDB, no compatibility matrix, no upgrade windows. For a small team, that is frequently worth more than the licence difference, and it is the clearest contrast with everything self-hosted above.
- Decoupling ingest from indexing is genuinely good engineering. You can keep everything available for archive and rehydration while indexing only what you search, which is a more honest answer to log cost than sampling at the source.
- Live Tail, log-to-metric generation, and correlation with APM traces and infrastructure metrics are polished in ways self-hosted stacks rarely match.
- Cloud SIEM with out-of-the-box detection rules covers the Graylog Security use case without adding another vendor to your estate.
The catch
The pricing model is the catch, and it is structural rather than incidental. Ingestion is metered per GB whether or not you index, and indexing is metered per million events on top, tiered by retention. Teams respond by indexing 10% to 20% of their logs, which means the majority of your data is not searchable at the moment you need it. Flex Logs mitigates this at a much lower storage rate but introduces a separate compute meter, billed by instance-hour, for querying that tier.
Underneath that sits a structural conflict. Datadog's revenue grows with the volume of telemetry you send it, while what you want is less telemetry and more signal. Every cost control is a feature you configure against the grain of the business model, and it is on you to keep doing so as your estate grows.
OpenTelemetry data is accepted but routed alongside a proprietary tagging and correlation model. Your instrumentation stays portable. Your dashboards, monitors, and retention filters do not, and rebuilding those is the part of a Datadog exit that takes months. Log spend is also rarely the whole bill, since Cloud SIEM meters analyzed events separately.
Pricing model
The most dimensioned model on this list: per-GB ingestion on uncompressed volume, plus standard indexing per million events with retention-based tiers, plus optional Flex Logs storage per million events stored with a 30-day minimum, plus Flex Compute per instance-hour to query it, plus Cloud SIEM per million analyzed events. On-demand rates run meaningfully above committed annual rates. Rates are published, and the billing documentation is the place to verify them, but the number of interacting meters is precisely why Datadog invoices surprise people who modeled only one of them.
What it incentivizes is index less, sample more, and hesitate before adding a verbose log line. Whether that reads as cost discipline or as self-inflicted blindness depends entirely on how well you guessed in advance which logs would matter.
The verdict
Pick Datadog if you want managed logs sitting beside managed APM and infrastructure monitoring, the budget exists, and cost governance is somebody's actual job rather than a good intention. Do not pick it as a cost-reduction move from self-hosted Graylog, because that is not the trade on offer.
Which tool fits your situation
You are leaving over SSPL and want genuine open source with your data where it is. Go to OpenSearch and OpenSearch Dashboards. Your logs are already there, the security features Graylog charges for are free, and governance sits with the Linux Foundation. Accept that you are rebuilding the ingest and parsing tier.
You are leaving because the three-component stack keeps breaking, and logs must stay on your infrastructure. VictoriaLogs if you want the smallest possible footprint and the broadest legacy ingest surface, OpenObserve if you would rather have one product with dashboards, alerts, and visual pipelines included and 50 GB/day covers you. Both are better answers than anything on this list for teams whose real complaint is operational.
You are running Graylog as a SIEM and the Security tier price is the problem. Wazuh, and pair it with a log store for application logs. If you need vendor accountability and mature detection content instead, Elastic Security or Splunk Enterprise Security, in that order of cost.
You need a real SIEM, logs, and an ingest surface as broad as Graylog's, in one product. Elastic Stack is the only entry that genuinely covers all three, and it is the reason it leads this list rather than Dash0.
Grafana is already the pane of glass and cost per retained GB is the metric you are graded on. Loki. Be honest with yourself first about whether your team searches by arbitrary field, because that workload does not survive the move.
Your logs come from cloud-native services and you want traces and metrics in the same query surface. SigNoz if you want to self-host and already run ClickHouse, Dash0 if you want SaaS, PromQL across every signal, and pattern extraction handled at ingestion instead of by regular expressions you maintain. Either way, plan for an OpenTelemetry Collector tier to replace Graylog's inputs.
You want the operational burden to be somebody else's problem entirely and budget is available. Datadog. Assign cost governance to a named person before you start, not after the first invoice.
Final thoughts
The ten options fall into four groups, and each answers the same question differently: where do you want the complexity to live?
Elastic, OpenSearch, and Wazuh keep the search cluster and the inverted-index behavior your team already relies on. You also keep operating it. VictoriaLogs, OpenObserve, and Loki move storage onto commodity infrastructure and delete components, paying for it with narrower scope or a change in how search behaves. SigNoz and Dash0 put logs in the same store and query surface as traces and metrics, which costs you an OTLP-only ingest path where Graylog gave you server-side inputs. Splunk and Datadog take the operational work away completely and charge you on dimensions that grow with your data.
Dash0 sits in the third group. Try it if the criteria that decide this for you are one query language over logs, metrics, and traces, parsing handled at ingestion instead of by extractors you maintain, and a bill counted in records so a rich log line costs no more than a thin one. If what decides it is on-premises deployment, a broad server-side ingest surface, or SIEM depth, one of the other nine fits better, and this article is more useful to you if it says so.
Whichever way you go, run the trial against real production volume rather than a sample, and time the query you actually run at 3am.
Sign up for a free Dash0 account with 14 days of unlimited access. No credit-card required.