If you're one the lookout for an OpenObserve alternative, one possible reason might be that the deal you started with changed. The Cloud free tier disappeared in June 2025 when OpenObserve moved everyone to pay-as-you-go. The published ingest rate went from $0.30 per GB to $0.50 per GB, and that $0.50 already assumes a 30% annual commitment discount. Self-hosting stays free, but the Enterprise edition that carries RBAC, audit trails, federated search, sensitive data redaction, and query management is only free up to 50 GB per day of ingestion. Cross that line and you are in a sales conversation.
Then there are the parts that surprise people after they deploy. OpenObserve Cloud bills query volume at $0.01 per GB scanned, so the broad exploratory search you run at 2am during an incident has a price attached to it. Non-metrics retention defaults to 30 days, and each additional 30-day window costs $0.02 per GB. Ingested data is immutable, which the project documents plainly: you cannot modify or delete individual records, only drop whole retention periods. That is a fine design decision for an append-only telemetry store and a real problem the first time a service logs a customer's personal data and legal asks you to remove it.
To be clear, none of this makes OpenObserve a bad product per se. Parquet on object storage with a DataFusion query engine is a genuinely good architecture for cheap retention, and single-binary deployment is the easiest starting point in this category. The problem is that "cheap unified observability" is now a crowded claim, and every product making it hides its cost somewhere. Some hide it in operations, where the software is free and you staff a team to run ClickHouse. Some hide it in a second meter, where ingest looks cheap and active series or query compute does the damage. Some hide it in feature gating, where the platform is open source right up until you need single sign-on.
This comparison covers nine alternatives, split into the two decisions that actually matter: run it yourself, or pay someone else to. Each one gets measured against the same criteria, including the platform I work on. Where a tool beats OpenObserve, I say so. Where staying put is the better call, I say that too.
Why replacing OpenObserve is harder than flipping a billing invoice
If your instrumentation is already OpenTelemetry, the migration mechanics look trivial. Change the OTLP exporter endpoint and the auth header in your Collector config, run both backends in parallel for a few weeks, then cut over. That part really is easy, and every vendor in this article will tell you so.
What does not transfer is everything you built on top. Dashboards, alert rules, saved queries, ingest pipelines, retention policies, RBAC assignments, and the muscle memory your on-call rotation has for one specific UI. OpenTelemetry solved instrumentation portability. It did not solve any of that, and anyone selling you "no lock-in" is talking about the one layer that was already portable.
The second thing that trips people up is that storage architecture decides most of what you experience later. An inverted index makes full-text search fast and storage expensive. Columnar files on object storage make storage cheap and make certain query shapes slow when the data is cold. Separate stores per signal make each signal fast in isolation and make cross-signal investigation a manual join. You are not choosing a feature set. You are choosing which class of problem you would rather have.
Third, and most consequential for the bill: the billing meter is a product decision, and it changes team behavior within about a month. Per-GB ingest pushes engineers to trim log verbosity and strip span attributes, which is exactly the context you need during an incident. Per-active-series pricing punishes the Kubernetes labels that make metrics useful. Per-GB-scanned query pricing makes people hesitate before running a wide search. Per-signal counting ignores payload size, so it rewards rich metadata and penalizes chatty low-value events. There is no neutral meter. Pick the distortion you can live with.
Finally, governance is where "open source" gets slippery. Almost every project in this article splits its code between a permissive core and a commercially licensed enterprise directory, and the features behind that line are usually the ones your security team requires. Check the license and the gated feature list before you fall in love with the demo.
We will evaluate each tool against the same set of questions: what the deployment model is (self-hosted, managed, or bring-your-own-cloud), what the data physically lands in and what that makes fast or slow, which signals are covered beyond logs, metrics, and traces, how portable the query languages and alert rules are if you leave, whether signals are genuinely linked or just adjacent in the UI, which dimensions the vendor bills on and what behavior that encourages, what the license actually permits around RBAC, SSO, and audit, and how many moving parts you personally keep alive at 3am.
At a glance
| Tool | Deployment | Storage | Signals | Query languages | Cost model | License |
|---|---|---|---|---|---|---|
| OpenObserve | Self-hosted or cloud | Parquet on object storage | Logs, metrics, traces, RUM, session replay | SQL, PromQL | Per-GB ingested plus per-GB queried plus retention | AGPL-3.0 core, commercial enterprise |
| SigNoz | Self-hosted, cloud, BYOC | ClickHouse | Logs, metrics, traces, APM, exceptions | ClickHouse SQL, PromQL, query builder | Per-GB logs and traces, per-million metric samples | MIT core, commercial ee/ |
| ClickStack | Self-hosted or ClickHouse Cloud | ClickHouse | Logs, metrics, traces, session replay | Lucene syntax, ClickHouse SQL | Infrastructure: compute plus storage | Apache 2.0 and MIT |
| Grafana stack | Self-hosted | Separate store per signal on object storage | Logs, metrics, traces, profiles | PromQL, LogQL, TraceQL | Free software, you pay infra and staff | AGPL-3.0 |
| VictoriaMetrics suite | Self-hosted or cloud | Purpose-built per signal | Logs, metrics, traces | MetricsQL, PromQL, LogsQL | Free software, enterprise features licensed | Apache 2.0 core, commercial enterprise |
| Dash0 | Managed only | OTLP-native store | Logs, metrics, traces, web events, synthetics | PromQL, SQL | Per-million signals, no seat or host fees | Proprietary |
| Elastic / OpenSearch | Self-hosted, hosted, serverless | Inverted index plus LogsDB and TSDS | Logs, metrics, traces, APM, RUM, synthetics | ES|QL, KQL, Lucene, SQL | Per-GB ingest and retention, or provisioned resources | AGPL-3.0 / ELv2 / SSPL, OpenSearch is Apache 2.0 |
| Grafana Cloud | Managed | Managed Mimir, Loki, Tempo, Pyroscope | Logs, metrics, traces, profiles, RUM, synthetics | PromQL, LogQL, TraceQL | Platform fee plus active series, per-GB, per-user, host-hours | Proprietary service on open source components |
| Axiom | Managed only | Schema-on-read event store plus MetricsDB | Logs, metrics, traces, events | APL, MPL | Platform fee plus data load, query compute, storage | Proprietary |
| Datadog | Managed only | Proprietary | Everything, sold as modules | Datadog query syntax | Per-host, per-container, per-GB, indexed spans, custom metrics, per-user | Proprietary |
Rates and plan details were checked against each vendor's published pricing page in August 2026. Verify before you sign anything, because three of these vendors changed pricing in the last eighteen months.
The first four entries are platforms you run yourself. Dash0 comes next because it's the OTel-native managed platform most teams leaving OpenObserve should look at before anything else. The remaining entries mix one more self-hosted engine with three additional managed services.
1. SigNoz
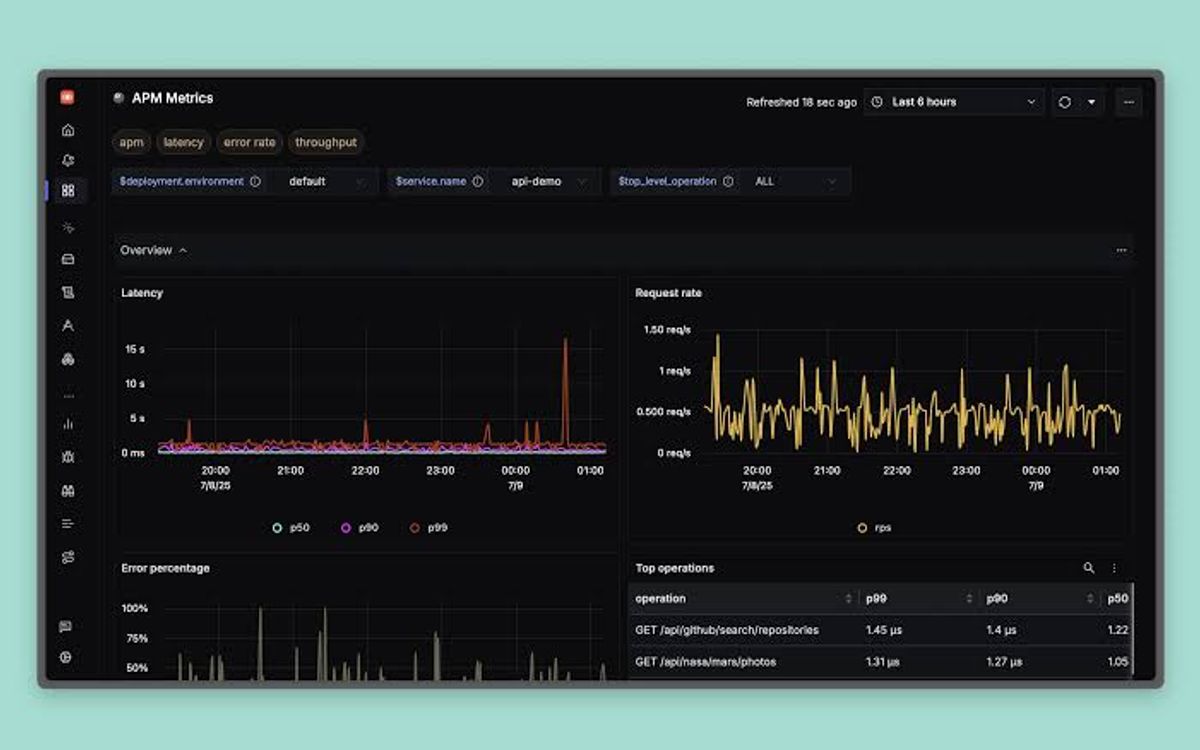
SigNoz is the closest structural analogue to OpenObserve in this article and the most common destination for teams leaving it. It is OpenTelemetry-native rather than OTel-compatible, stores every signal in ClickHouse, and ships APM as a first-class product instead of a trace viewer. You get RED metrics, service maps, flamegraphs, and exception tracking without configuring any of it, provided your services are instrumented with standard OTel SDKs.
What's good
Because logs, metrics, and traces all share ClickHouse, correlation is a join rather than a cross-system lookup. Logs carrying trace_id and span_id open the matching span directly, and aggregations across signals do not require exporting to a third tool. Deployment choice is real, too: community edition self-hosted, managed cloud, bring-your-own-cloud, and enterprise self-hosted with a support contract are all supported paths. Very few vendors offer all four, which means an infrastructure policy change does not force a product change.
Query languages are ones you already know. The visual builder covers most work, PromQL handles metrics, and ClickHouse SQL is available for anything complicated. That SQL skill is reusable outside SigNoz even though the schema is not.
The catch
The community edition is MIT-licensed, but the ee/ and cmd/enterprise/ directories carry a separate commercial license, and that is where SAML and OIDC single sign-on, fine-grained RBAC, and ingest governance live. If your security baseline requires SSO on day one, the free tier is not your answer, and the enterprise plan starts around $4,000 per month.
Running it yourself means running ClickHouse. That is a real database with real failure modes: merge pressure, disk sizing, replication, backups, and version upgrades. It is a better problem than operating a five-node Elasticsearch cluster, and it is a considerably worse problem than running an OpenObserve single binary on a VM.
One migration detail catches people out. SigNoz documents a supported path for moving dashboards, alerts, pipelines, and settings from self-hosted to cloud, but historical logs, metrics, and traces do not come with you. You either keep the old deployment running as an archive or accept a gap in searchable history.
Pricing model
SigNoz Cloud charges per gigabyte for logs and traces and per million samples for metrics, with a monthly minimum that includes an equivalent amount of usage. There is no per-host, per-user, or custom-metric surcharge, so an OTel metric costs the same as a built-in integration metric. That is the single biggest structural difference from host-based vendors.
The dimension worth modeling carefully is retention, because the per-GB rate itself increases with the retention window rather than adding a separate storage line. Default cloud retention is short by observability standards, so the headline rate and the rate you actually pay may not match. Self-hosted has no license fee, and your cost becomes ClickHouse infrastructure plus the engineering time to run it.
The verdict
Pick SigNoz if you liked OpenObserve's unified model but want a more mature APM workflow and a permissive core license, and you either already run ClickHouse or genuinely want the managed cloud. It is the safest lateral move on this list. Skip it if you need SSO and RBAC without a commercial contract, or if session replay and frontend monitoring were the reason you chose OpenObserve in the first place.
2. ClickStack (ClickHouse and HyperDX)
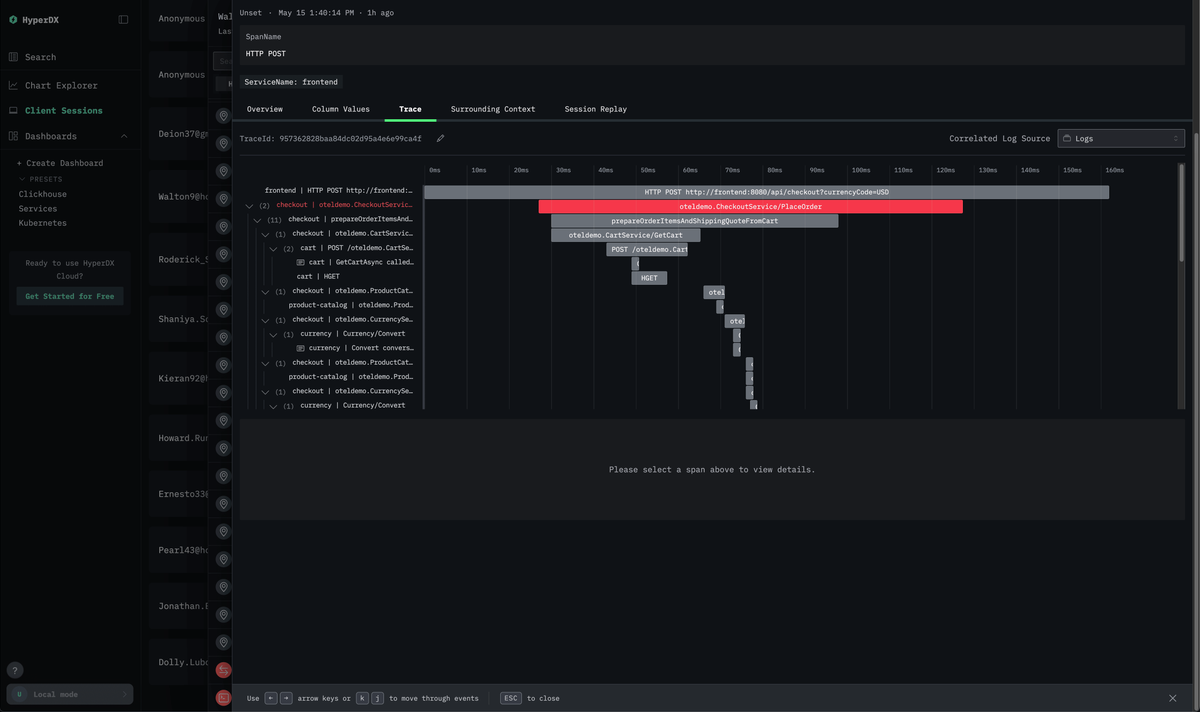
ClickStack is ClickHouse's own observability stack, built from three components: a preconfigured OpenTelemetry Collector, ClickHouse as the single store, and the HyperDX UI that ClickHouse acquired in March 2025. It is the most direct expression of the "one analytical database, wide events" philosophy, and it treats logs, traces, metrics, and session replays as rows in tables you can query with plain SQL.
What's good
- High-cardinality queries stay fast when the data is cold. ClickHouse's columnar engine, native JSON support, and parallel execution handle the aggregation-heavy work that observability actually consists of, like p99 latency grouped by customer ID. That is a different workload from full-text search, and it is the one Elasticsearch was never built for.
- Permissive licensing with no enterprise directory. ClickHouse and the Collector are Apache 2.0, HyperDX is MIT. There is no gated
ee/folder deciding whether you get access control, which makes legal review shorter than for AGPL projects. - Schema-agnostic UI. HyperDX connects to any ClickHouse instance and works against your existing schema, so you can point it at tables you already have rather than migrating data into an opinionated layout. Advanced users keep direct SQL access with no ceiling on query expressiveness.
- Agent access is built in. The ClickStack MCP server exposes search, time series, and dashboard tools to coding agents, which matters more each quarter as incident triage moves into the terminal.
The catch
You are now responsible for a ClickHouse cluster in production. Part merges, TTL tuning, replication topology, and schema evolution are yours, and the failure modes are less forgiving than a stateless single binary. Teams underestimate this constantly, and the ClickHouse consultancies that exist to clean up after them are evidence.
The metrics story is younger than the logs and traces story. If you are coming from OpenObserve's PromQL support and a large Prometheus estate, check dashboard and alert coverage carefully before committing. Alerting in HyperDX is also lighter than in a full commercial platform, and there is no RUM product beyond session replay.
On Managed ClickStack, storage is published at under $0.03 per GB per month, which is genuinely cheap. Query compute is billed separately and is not a published fixed number, so the variable half of your bill is the half you cannot forecast from a rate card.
Pricing model
Open source ClickStack has no license fee, and your cost is compute, object storage, and the engineering time to keep it healthy. That model is predictable in the way a server bill is predictable and unpredictable in the way headcount is.
Managed ClickStack bills on ClickHouse Cloud infrastructure, with compute and storage scaling independently, rather than on events or hosts. Nothing charges per seat, per host, or per signal, and no pricing mechanism forces you to sample. New accounts get $300 in credits, which ClickHouse estimates covers roughly 10 TB of observability data. The forecasting risk sits entirely in query compute, so model your heaviest dashboard refresh rates before you commit.
The verdict
Choose ClickStack if you want OpenObserve's cost profile with a more capable query engine, and your team is comfortable owning a database. It is the strongest option here for teams who want to write SQL against their telemetry and keep full control of the schema. Avoid it if nobody on the team wants to be the ClickHouse person, because that role is not optional.
3. Grafana stack (Loki, Mimir, Tempo)
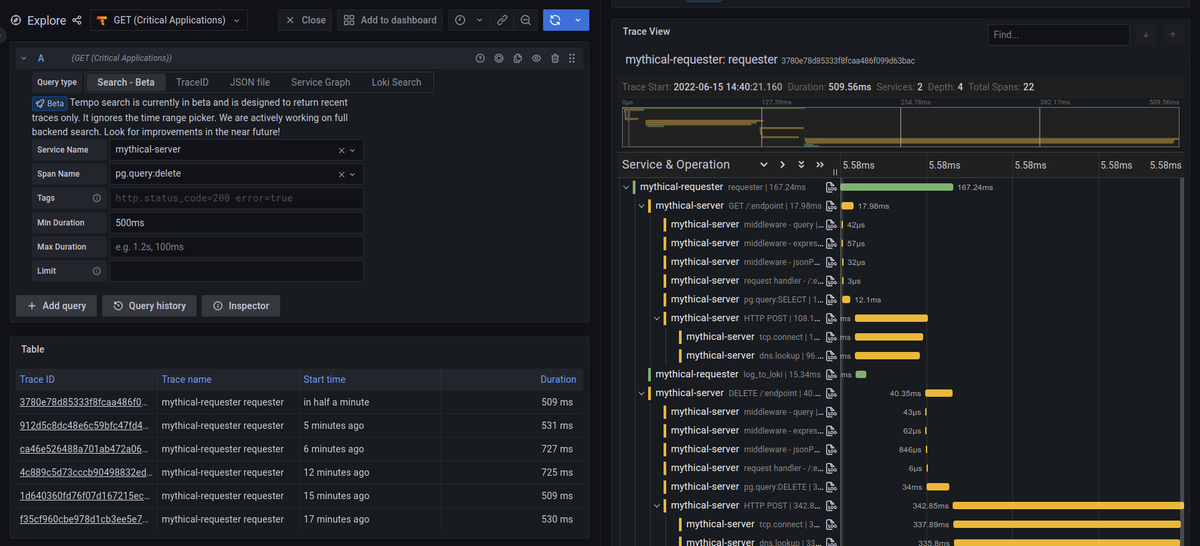
The self-hosted Grafana stack is the incumbent that most OpenObserve users were already running, or already rejected. Mimir stores metrics, Loki stores logs, Tempo stores traces, Pyroscope stores profiles, and Grafana renders all of it. Every component is AGPL-3.0 and backed by object storage, which puts its cost floor in the same territory as OpenObserve.
What's good
The dashboard ecosystem is unmatched. Whatever you are running, someone has published a Grafana dashboard for it, and that library is worth more than most feature comparisons admit, especially for infrastructure that nobody wants to instrument by hand. Every component also scales independently: Loki ingesters, Mimir queriers, and Tempo compactors can each be sized for their own workload. At very large scale that is an advantage over a single-binary design, and it is the reason large platform teams keep choosing it.
Prometheus compatibility is total. Existing recording rules, alert rules, and PromQL knowledge transfer without modification, and exemplars can link a metric measurement to the trace that produced it.
The catch
Three query languages. PromQL for metrics, LogQL for logs, TraceQL for traces. During an incident, you restate the same question three times in three syntaxes, and the muscle memory does not transfer between them. This is the fragmentation that unified platforms exist to remove, and it is the honest reason many teams left for OpenObserve.
Loki indexes labels rather than log content, which is what makes it cheap. It also means queries against non-indexed fields are slower than newcomers expect, and a badly chosen label set creates cardinality problems that surface as ingester memory pressure rather than as a helpful error. Tempo assumes you sample at the Collector, so storing complete traces at volume gets expensive quickly.
The operational load is the real number. At QCon London 2026, Colin Douch, an SRE at DuckDuckGo who previously led observability at Cloudflare, advised teams not to run their own observability stack until every other option is exhausted, and estimated the requirement at two to three additional full-time engineers plus meaningful infrastructure spend. He was describing exactly this architecture.
Pricing model
The software costs nothing. The bill is compute, object storage, egress, and the salaries of the people who keep four distributed systems healthy across version upgrades. Grafana Labs makes its money on Grafana Cloud and enterprise plugins, which is a fair trade and also a reminder that the free stack's roadmap serves a commercial model.
Compared with OpenObserve self-hosted, you are trading one binary for four systems and gaining component-level maturity, per-signal scaling, and the dashboard library. Whether that trade pays depends almost entirely on whether you have the headcount, not on the infrastructure line item.
The verdict
Run the Grafana stack if you have a platform team whose job is the platform, you are already deep in Prometheus, and the dashboard ecosystem is doing real work for you. It is a poor choice for a small team that wants observability to be a solved problem, which is the same conclusion that pushed most of those teams toward single-binary tools in the first place.
4. VictoriaMetrics, VictoriaLogs, and VictoriaTraces
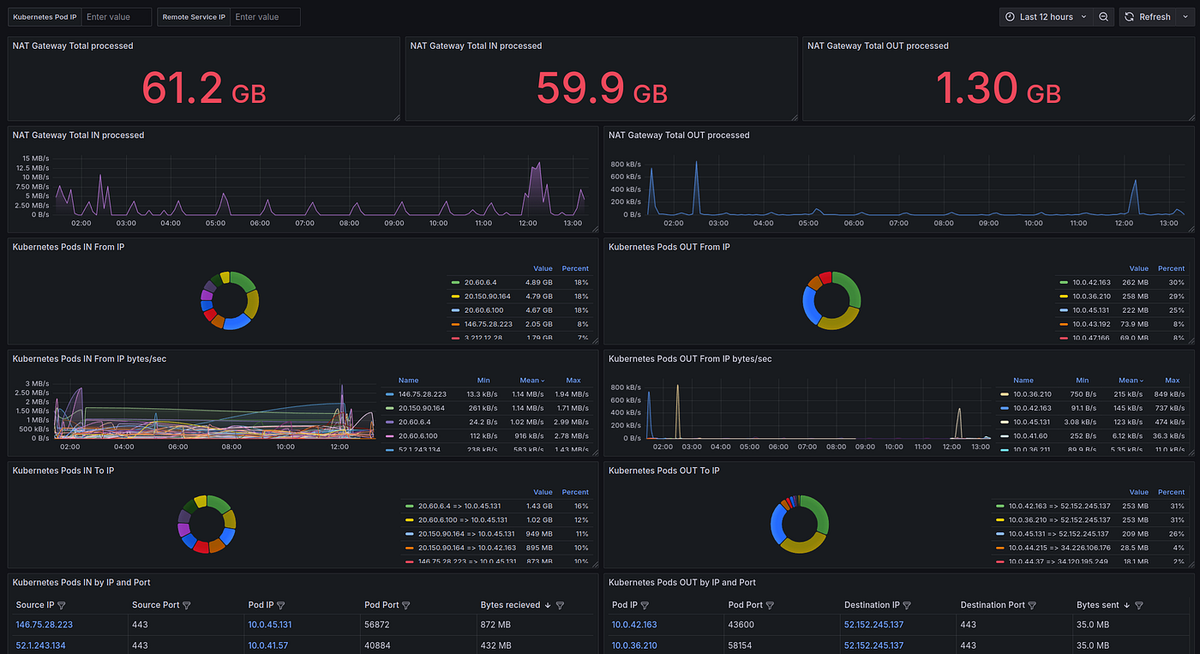
VictoriaMetrics is the efficiency play. The project's reputation was built on a time series database that replaces multi-node Prometheus or Thanos setups with a single small binary, and it has since added VictoriaLogs for logs and VictoriaTraces for spans. All three accept OpenTelemetry data, and the single-node and cluster versions are Apache 2.0.
What's good
- Resource efficiency that changes your infrastructure budget. The team claims VictoriaLogs uses up to 30 times less RAM and 15 times less disk than comparable systems, and that a single node can replace a cluster of up to 30 nodes. Those are vendor numbers, but the community benchmarks have been consistent enough that Grammarly, Roblox, and Wix run it in production.
- Operational simplicity that rivals a single binary. No dependencies, configuration through command-line flags, sensible defaults, and a Kubernetes operator. If OpenObserve's easy deployment was what you valued, this preserves it.
- Query languages built for the job. MetricsQL is a superset of PromQL, so existing queries and alert rules keep working. LogsQL is designed for log search rather than adapted from something else, and the docs include conversion guides from both LogQL and SQL.
The catch
This is a set of databases, not a platform. There is no unified investigation UI tying the three together, so you bring Grafana or Perses and wire up the correlation yourself. Compared with OpenObserve's single pane, that is a step backwards in developer experience even if it is a step forwards in efficiency.
VictoriaTraces is the newest piece and shows it. It ingests OTLP spans, stores them as structured logs on the VictoriaLogs engine, and exposes Jaeger query APIs, which works. A dedicated web UI for visualizing traces is still listed on the project roadmap as post-GA work, so today your trace UI is Jaeger or a Grafana data source.
The Apache 2.0 line is not the whole story either. Downsampling, retention filters, anomaly detection, and several multi-tenancy features are Enterprise-only, distributed as separate binaries with an enterprise suffix and gated behind a license key. Evaluation use is free with a trial license, production use is not.
Pricing model
The community editions are free with no ingestion cap, and your cost is the hardware, which is the entire point. Because the resource footprint is genuinely small, the infrastructure bill for a given ingest volume tends to land well below both self-hosted Elasticsearch and the LGTM stack.
Enterprise pricing is quote-based rather than published, which is a mark against it in a comparison where most competitors post rate cards. VictoriaMetrics Cloud offers a managed option on AWS if you want the efficiency without the operations. Model your requirements against the enterprise feature list first, because downsampling in particular is the kind of thing you discover you need at month six.
The verdict
Pick the VictoriaMetrics suite if metrics are your dominant signal, cost per ingested gigabyte is the number your CFO asks about, and you are happy assembling a stack in Grafana. Do not pick it if you want traces to be a polished first-class experience today, or if you want one product to open during an incident.
5. Dash0
Dash0 was founded in 2023 by the team that built Instana, and it is OpenTelemetry-native in a stricter sense than most platforms claiming the label. Telemetry is stored in its OTLP shape rather than translated into a proprietary model, and OTel semantic conventions drive product behavior rather than sitting in a searchable field list.
What's good
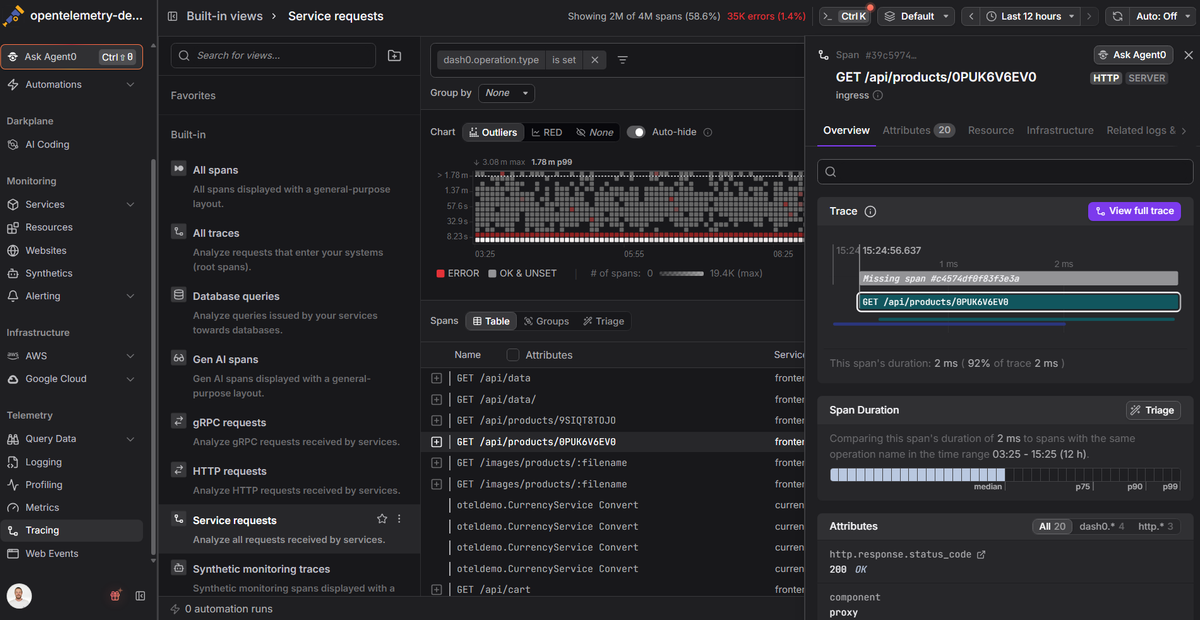
- Resource context carries through the whole investigation. You scope by service, namespace, workload, or cloud resource and that scope persists as you move between metrics, traces, and logs, because every signal is joined on the same resource identity rather than stitched together after the fact. Attributes are read according to their semantic meaning and type, so filters and service views come from OTel conventions rather than arbitrary key-value pairs.
- Filtering happens before storage, not after. SignalControl Edge processes telemetry inside your own Kubernetes cluster and drops or reshapes low-value data before it leaves your environment, so the correlation and query performance above are built on data that was already curated rather than dumped in wholesale and cleaned up later.
- Two query languages, both portable. PromQL covers metrics and time-series analysis of spans, logs, and web events, and SQL handles record-level investigation and cross-signal joins. Neither is Dash0-specific.
- Portability extends past instrumentation. Dashboards use the CNCF-backed Perses specification, service level objectives use OpenSLO, and configuration is manageable through the Dash0 Terraform provider. Those are the layers OTel does not cover, and they are the ones that usually make leaving expensive.
The catch
There is no self-hosted deployment, and for an audience that chose OpenObserve partly because it runs as a single binary in their own VPC, that is the disqualifying fact for many readers. If data residency or infrastructure ownership is a hard requirement, stop here and look at SigNoz or ClickStack instead.
Default retention is metric data points and synthetic check runs for 13 months, and spans, span events, log records, and web events for 30 days. Longer windows can however be negotiated.
Per-signal pricing has an inverse failure mode to per-GB pricing. Rich attributes are free, but volume is not, so a service emitting millions of health-check spans costs the same as one emitting millions of meaningful ones. Spam filters exist precisely because of this, and they require you to notice and configure them.
The Kubernetes operator auto-instruments Java, Node.js, .NET, Python, and Ruby, so only runtimes outside that list need manual OpenTelemetry SDK work. The integration catalog is still maturing compared to some decade-old vendor's.
Pricing model
Consumption only, with no per-seat, per-host, or base platform fee since Dash0 removed its subscription minimum in February 2025. Metric data points are $0.20 per million, spans and span events and log records and web events are $0.60 per million, and synthetic API checks are $0.20 per thousand runs. Every feature is in one plan, and rates are on the pricing page. A monthly budget cap, a cost forecast, and spam filters that reject low-value telemetry before storage sit in the ingest path.
Counting signals rather than bytes means a verbose error log with a full stack trace costs the same as a one-line health check, and adding a useful resource attribute creates no new billing dimension. Compared with OpenObserve's model, you gain the absence of a query meter, so exploratory investigation is free once the data is in. You lose the ability to cut costs by trimming payload size, and you cannot shift old data to cheap object storage.
The verdict
Dash0 fits teams standardized on OpenTelemetry who want the OTel model preserved end to end, who value predictable per-signal billing and portable dashboards, and who are fine with SaaS. Look elsewhere if you need self-hosting, or long log retention on a self-service basis rather than a negotiated one.
Start a 14-day free trial if you want to measure your own signal counts against the published rates rather than estimating.
6. Elastic Stack and OpenSearch
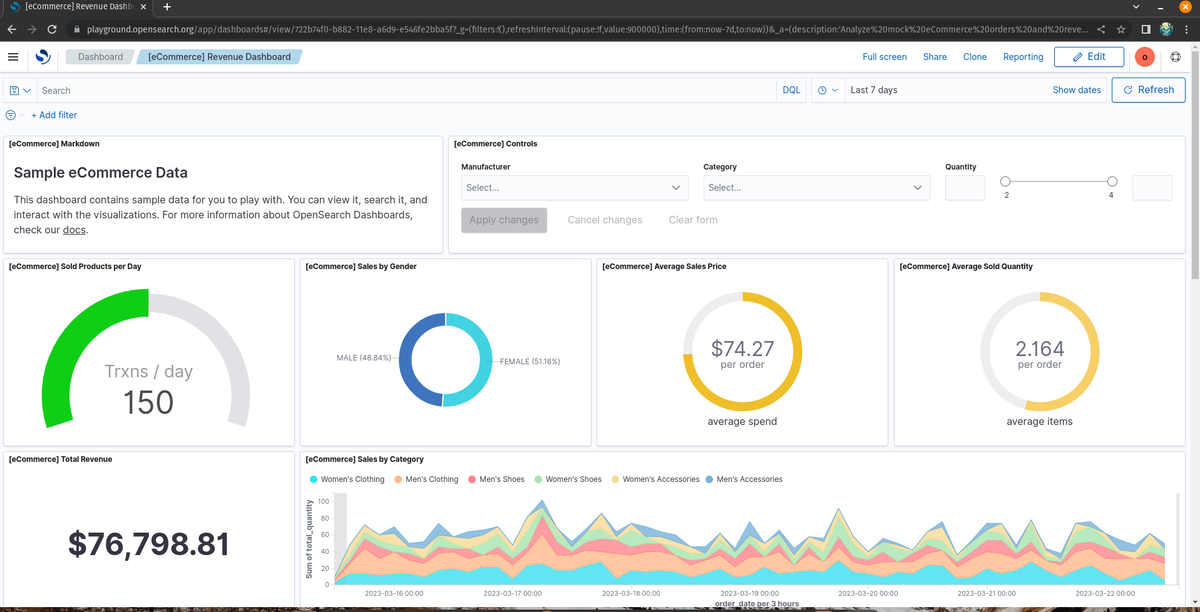
OpenObserve markets itself explicitly as an Elasticsearch replacement, so the incumbent deserves a fair hearing. OpenSearch is the Apache 2.0 fork that AWS maintains, and Elastic is the commercial original, triple-licensed under AGPLv3, Elastic License 2.0, and SSPL since September 2024. Both remain the strongest full-text search engines in this category.
What's good
- Nothing beats it for unstructured search. When an investigation starts with a fragment of a stack trace or an error string nobody anticipated, an inverted index earns its cost. Columnar scans are excellent at aggregation and merely adequate at needle-in-haystack text search.
- Elastic's OTel support got serious. The Elastic Distribution of OpenTelemetry writes logs and traces to LogsDB and metrics to Time Series Data Streams, preserving OTel field structures and semantic conventions rather than translating them into Elastic Common Schema first. Elastic's managed OTLP endpoint stores telemetry without schema translation.
- OpenSearch has no feature paywall. Security, alerting, and cross-cluster replication are all included, so there is no community versus enterprise split to navigate. For teams whose objection to Elastic was licensing, that resolves it cleanly.
- Searchable snapshots make long retention affordable, which addresses the historical reason people fled Elasticsearch for object-storage architectures.
The catch
Metric fidelity has documented gaps. Elastic discards OpenTelemetry exemplars, so a metric measurement cannot link back to the trace that produced it, and it accepts OTel histograms only with delta temporality, dropping cumulative histograms unless you convert them in the Collector first. If exemplars are part of your workflow, that is disqualifying.
The billing detail that catches everyone: Elastic meters ingest and retention on the uncompressed, normalized, fully enriched volume at the end of the ingest pipeline, before compression. Elastic says so plainly on its serverless pricing page, and your billed volume will exceed both your raw source data and your on-disk index size. Model this with real data or your estimate will be wrong by a wide margin.
Operationally, this is the heaviest option here. Shards, mappings, index lifecycle policies, ingest architecture, and cluster sizing form a much larger surface than a focused observability backend. Existing Elastic teams already carry that expertise. New adopters are signing up for a platform, not a tool.
Pricing model
Elastic sells three different models. Serverless Observability bills per GB ingested plus per GB retained per month, which is straightforward to estimate once you account for the uncompressed metering. Elastic Cloud Hosted bills provisioned resources by subscription tier, so cost tracks cluster size rather than telemetry volume. Self-managed is free on the Basic license, with advanced features requiring a subscription that Elastic does not publish rates for.
OpenSearch on your own hardware is free in every sense, and Amazon OpenSearch Service bills compute units and storage. Compared with OpenObserve's flat ingest rate, Elastic's serverless model is roughly comparable on paper and usually worse in practice because of how the billable volume is calculated.
The verdict
Choose Elastic when Elasticsearch is already strategic, when full-text search over unstructured logs is the workflow that resolves your incidents, or when you need the integration and agent ecosystem. Choose OpenSearch when you want that engine without the licensing conversation. If you are starting fresh with OpenTelemetry and left OpenObserve for cost reasons, neither is likely to be the answer.
7. Grafana Cloud
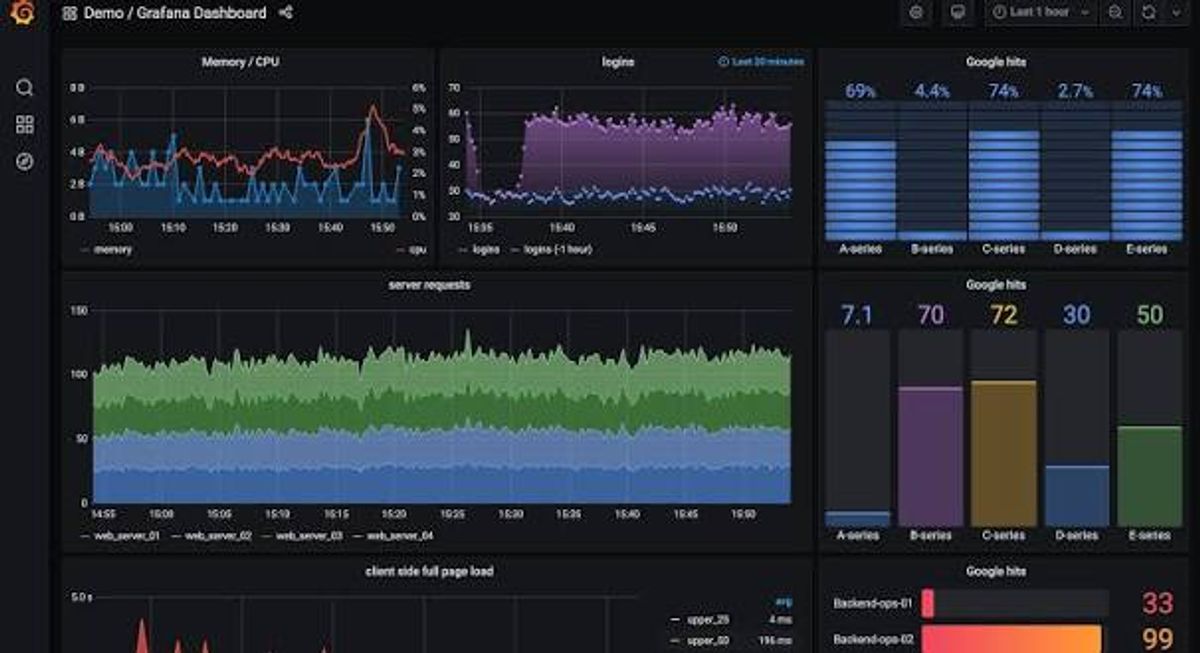
Grafana Cloud is the managed version of the LGTM stack, and it is the path of least resistance for teams who want to stop operating Loki and Mimir without retraining anyone. The free tier is the most generous in the category, and the product surface now stretches from profiles to synthetics to AI investigations.
What's good
- A free tier you can actually run something on. 10,000 active metric series, 50 GB each of logs, traces, and profiles, three active users, and 14-day retention, with no expiry and no credit card. For a small production service that is a working setup, not a demo.
- Adaptive Telemetry attacks the cost problem directly. Grafana Labs claims 35% to 50% savings by identifying and deprioritizing telemetry nobody queries. It is available on every plan including free, and it is a more honest answer to cost than telling customers to sample harder.
- A credible component-level exit. Because Mimir, Loki, Tempo, and Pyroscope are all open source, you can in principle move a signal back in-house without rewriting your instrumentation or your PromQL. Very few managed platforms offer that.
The catch
The meters multiply. Metrics bill on active series and data points per minute, logs and traces and profiles bill per GB with retention affecting the total, visualization bills per active user, Application Observability moved to host-hours plus telemetry for new customers in February 2026, and k6 bills virtual user hours. Each meter is individually transparent. Together they are difficult to forecast, and teams routinely land at several times their first estimate.
Active-series billing is the specific thing that punishes OpenTelemetry users. Adding a pod name, deployment version, or customer tier label creates new series, and those are precisely the resource attributes that make an investigation possible. You end up choosing between context and cost, which is the choice you were trying to avoid.
There is also a structural gap in the plan ladder. Enterprise features like advanced RBAC, data source permissions, and SLAs sit behind a $25,000 per year minimum commitment, with nothing between the self-service Pro tier and that cliff. A mid-sized team that has outgrown Pro has no clean option.
Pricing model
A monthly platform fee plus usage-based charges on each signal, with rates published per meter on Grafana's pricing page. Metrics are billed by active series, logs and traces and profiles by volume, and visualization by monthly active user. Grafana uses 95th-percentile billing so brief spikes do not distort the invoice, and provides usage dashboards and alerts.
The model rewards disciplined labelling and punishes the opposite, which is a coherent position for a vendor whose metrics backend is Prometheus-shaped. It is also the opposite of OpenObserve's flat volume model, where cardinality costs you nothing extra. If you left OpenObserve because of cost, run your real series count through Grafana's calculator before assuming a managed LGTM stack is cheaper.
The verdict
Grafana Cloud is the right answer when your team already thinks in Grafana, you value the dashboard ecosystem, and you would rather pay someone else to run Mimir. It is the wrong answer if high-cardinality Kubernetes metrics are the bulk of your telemetry, because the meter is aimed directly at that.
8. Axiom
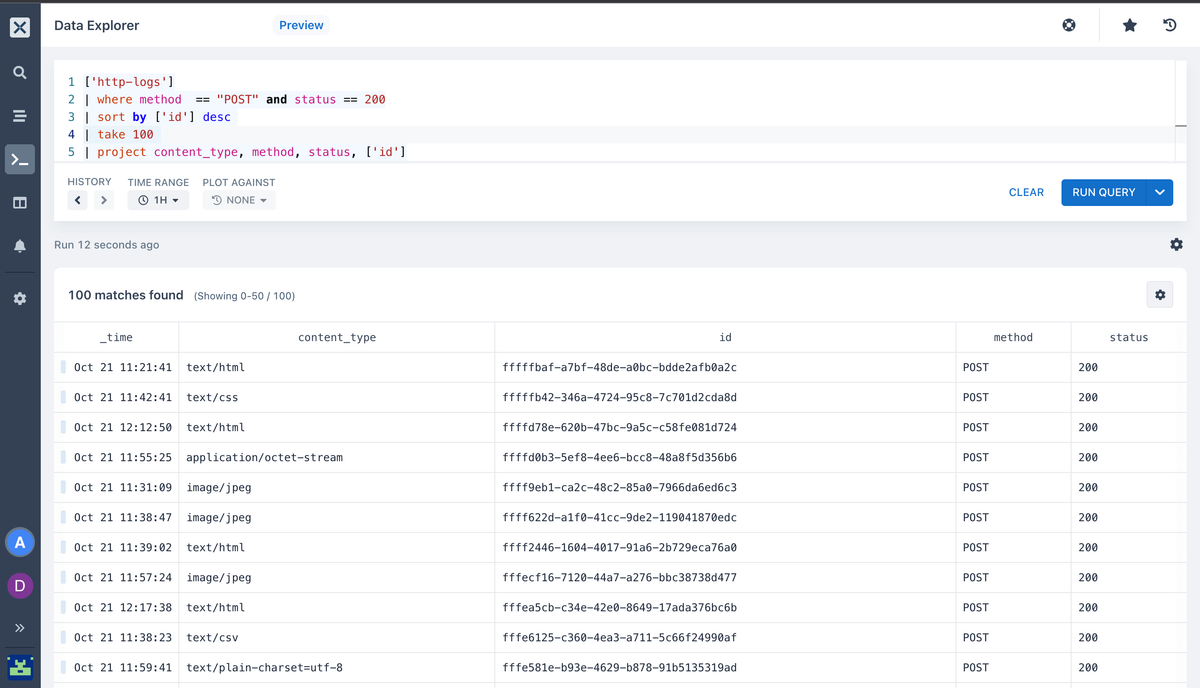
Axiom came at observability from the storage layer. Its pitch is that keeping every event should be the default rather than a premium, and it backs that with a schema-on-read event store, better than 95% compression, and no enforced retention ceiling. Metrics reached general availability in March 2026, so it now covers all three signals.
What's good
- Retention economics are the best here. Data stays queryable at full speed for as long as you pay to store it, with no cold tiers to configure and no separate archive product. Teams keeping a year of logs cite this as the reason they chose it.
- No schema decisions to regret. Schema-less ingest and virtual fields for query-time transformation mean you are not locked into the indexing choices you made six months ago. That is a meaningful advantage over both Elasticsearch mappings and rigid column layouts.
- Spending limits pause rather than bill. You set a limit in the console and usage beyond it stops instead of generating an overage invoice. Given how many teams arrive here after a surprise bill, that design deserves credit.
- High-cardinality metrics without a cardinality penalty, since MetricsDB was built for dimensional complexity rather than adapted from a series-count model.
The catch
APL and MPL are proprietary query languages. APL is Kusto-derived and pleasant to write once learned, but every query, dashboard, and alert you build is Axiom-specific, and none of it transfers if you leave. That is a heavier lock-in than SQL and PromQL, and it deserves to be weighed against the storage savings.
Cloud-only, with no self-hosted or VPC option. Same disqualifier as Dash0 for teams with residency requirements.
Query compute is its own meter, billed in GB-hours. So like OpenObserve, Axiom attaches a price to investigation, and unlike ingest volume, query volume spikes exactly when you are having a bad day. Enterprise controls including SSO, RBAC, directory sync, and audit logs are add-ons rather than base plan features.
Finally, this is an event platform rather than an APM. There is no service map, no RED metrics out of the box, and no real user monitoring. You are getting an excellent place to put telemetry, not an opinionated investigation workflow.
Pricing model
A platform fee on Axiom Cloud that includes allowances for data load, query compute, and storage, then pay-as-you-go on each of those three meters. Per-unit rates drop automatically at higher volume tiers, so total cost grows sub-linearly, and the full rate card is published at axiom.co/pricing. There is a permanent free tier with 500 GB of monthly data load.
Three meters is more complex than OpenObserve's two, and the query-compute dimension carries the same behavioral risk: engineers who know that searching costs money search less. Weigh that against retention pricing that makes keeping everything genuinely viable, which is the trade Axiom is asking you to make.
The verdict
Axiom is the right pick when logs and events dominate your telemetry, long retention is a requirement rather than a nice-to-have, and you can live with a proprietary query language. It is the wrong pick if you want APM workflows, self-hosting, or query costs that do not vary with how hard you are debugging.
9. Datadog
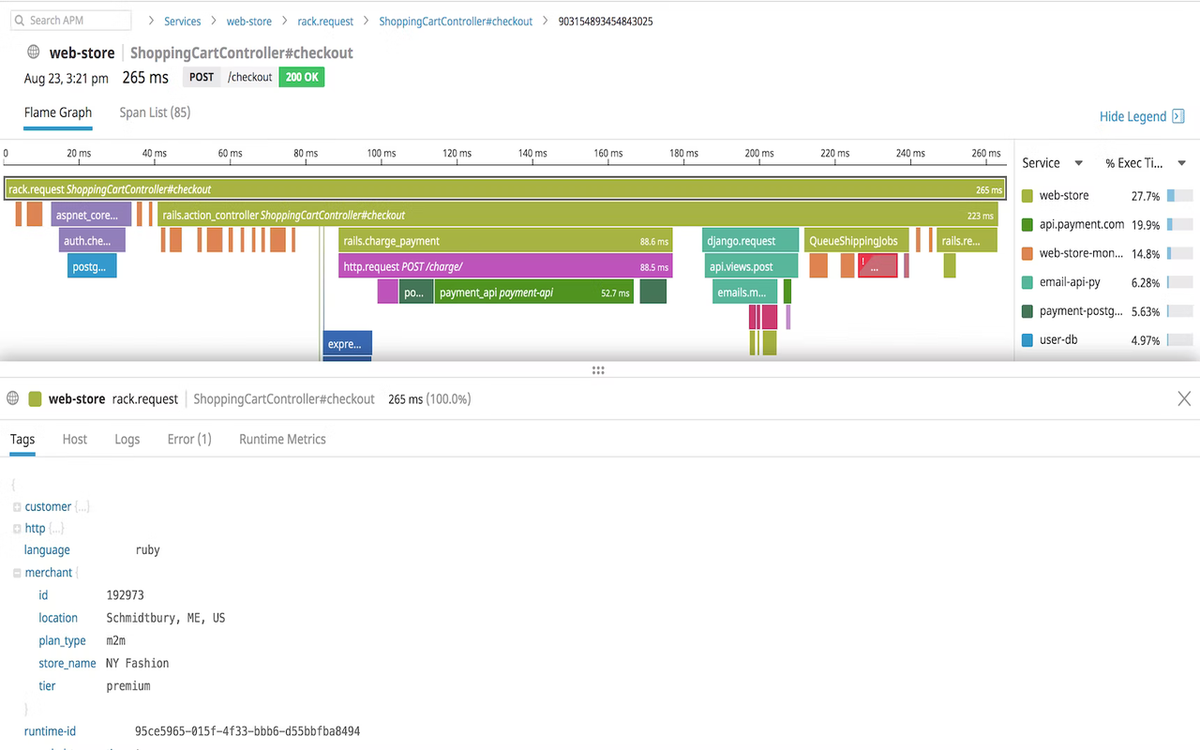
Datadog is on this list because it is what teams evaluate when the cost-optimization experiment has run its course and someone senior wants coverage instead. It is the most complete product in the category, and it is priced accordingly.
What's good
No other platform in this article matches its integration breadth. More than a thousand integrations cover infrastructure, databases, cloud services, and commercial systems, and when large parts of your environment emit no useful OTLP, that catalog does work no OTel-native platform can replicate. Adoption is also incremental rather than all-or-nothing: an upstream Collector, direct OTLP intake, OTLP in the Datadog Agent, or the Datadog Collector distribution all work, so you can bring OpenTelemetry in without replacing every existing collection path at once.
And the correlation genuinely spans a wide surface. Traces, logs, metrics, infrastructure, deployments, database activity, and frontend sessions connect inside one platform. Whatever else is true about the price, the product works.
The catch
The meters compound. Hosts, containers, custom metrics, ingested spans, indexed spans, log ingestion, log indexing, users, and each add-on product bill separately. Adding one richly instrumented service can raise five of those dimensions simultaneously, which is why Datadog forecasts are so frequently wrong in one direction.
For OpenTelemetry users specifically, only selected semantic-convention attributes map to metric tags by default. Retaining every resource attribute requires an explicit setting, and turning it on can substantially increase tag cardinality and therefore custom-metric usage. That default is the tell: Datadog treats OpenTelemetry as an input format to translate into its own model, not the native shape data lives in once it arrives. The context you want and the bill you want are in tension by design.
Then there is the structural issue. Datadog's revenue is a function of how much telemetry you send it, which means the vendor helping you reduce data volume is the vendor whose revenue falls when you succeed. Every cost-control feature it ships operates against that gradient. That is not a claim about intent, it is a claim about incentives, and it is worth stating plainly for a reader who arrived here from a tool that bills on ingest volume too.
Lock-in also runs far past instrumentation. Dashboards, monitors, facets, indexes, service definitions, tagging conventions, retention rules, and incident workflows are all Datadog-specific. OTel lowers the cost of entering Datadog, not the cost of leaving.
Pricing model
Per-host for infrastructure monitoring, per-host or per-Fargate-task for APM with an allowance for ingested and indexed spans, separate ingestion and indexing charges for logs, and custom metrics billed on unique metric and tag combinations above a per-host allowance. Additional products including RUM, database monitoring, profiling, synthetics, and security introduce their own units. Rates are published at datadoghq.com/pricing.
This is the model OpenObserve was built to argue against, and the argument is sound at high volume. Datadog provides usage dashboards, allotment calculators, and spike monitors, which help you track consumption without making the structure any simpler to forecast.
The verdict
Choose Datadog when integration breadth and a polished all-in-one experience are worth more to you than cost predictability or portability, which is a legitimate position for an enterprise with a heterogeneous estate and a procurement process. If you left OpenObserve because $0.50 per GB felt expensive, this is not your next stop.
Which tool fits your situation
If self-hosting is non-negotiable and you want the closest thing to a drop-in replacement, take SigNoz. It preserves the unified model, the OTel-native ingestion, and the PromQL familiarity, and the MIT core is easier to clear with legal than AGPL. Budget for ClickHouse operations honestly.
If you want to write SQL against your telemetry and own the schema, take ClickStack. It has the best query engine here and the cleanest licensing, and the ClickHouse Cloud option means you can start managed and move in-house later without changing products.
If metrics dominate and infrastructure cost is the metric you are judged on, take the VictoriaMetrics suite and accept that you are assembling a stack rather than buying a platform. The efficiency numbers are real, and the enterprise gate is worth checking early.
If you standardized on OpenTelemetry and want the OTel model preserved through the whole investigation, take Dash0, provided SaaS is acceptable and 30-day log retention meets your requirements. Per-signal billing with no query meter suits teams whose telemetry is richly attributed rather than merely voluminous.
If your incidents start with a raw error string in an unstructured log, stay with Elasticsearch or move to OpenSearch. Columnar stores are better at aggregation and worse at text search, and no amount of Parquet compression changes that.
If you already think in Grafana and just want to stop running Loki, take Grafana Cloud. Model your active series count first, because that meter is where a Kubernetes estate gets expensive.
If keeping a year of logs is a requirement and APM is not, take Axiom. Nothing else here makes long retention this affordable, and the proprietary query language is the price of admission.
If you need coverage of a heterogeneous enterprise estate and cost predictability is secondary, take Datadog. It will be expensive and it will work.
And if none of the above describes you, stay on OpenObserve. If you are self-hosting under 50 GB per day, the Enterprise features are free, the single binary is genuinely the simplest thing to operate in this category, and object storage retention is cheap. Migrating an observability stack costs weeks of engineering time. Do it because a specific constraint is being violated, not because a comparison article gave you a shortlist.
Final thoughts
The nine options here divide along two lines. The first is whether you run the database or someone else does, and that decision is about headcount rather than technology. SigNoz, ClickStack, the Grafana stack, VictoriaMetrics, and self-managed Elastic all ask you to own a distributed system in exchange for the lowest possible marginal cost. Grafana Cloud, Dash0, Axiom, and Datadog charge you a margin to make that somebody else's pager.
The second line is what the vendor counts. Bytes, active series, hosts, query compute, or signals. That choice propagates into how your engineers instrument services, how much context survives into production, and what they hesitate to search for during an incident. Read the meter before you read the feature list, because the meter is the thing you will still be arguing about in eighteen months.
Dash0 sits in a specific spot on both lines. It is managed rather than self-hosted, which rules it out for teams with residency requirements, and it counts signals rather than bytes, which means rich OpenTelemetry attributes and verbose stack traces cost nothing extra while high-volume noise costs the same as high-value telemetry. Combined with PromQL and SQL as the query languages and Perses for dashboards, that leaves less to rebuild if you ever leave than most platforms on this list.
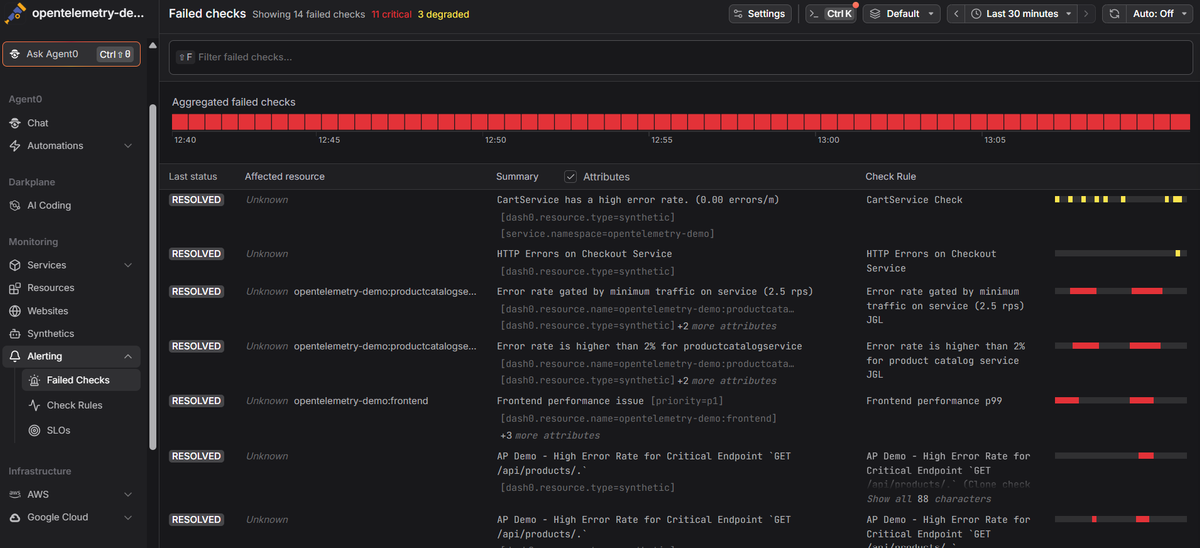
Sign up for a free Dash0 account with 14 days of unlimited access and run your own telemetry through it before deciding. No credit-card required.