Uptrace earned its following honestly. It is an OpenTelemetry-native application performance monitoring (APM) tool built directly on ClickHouse, and it ships two ways to run it: a self-hosted build you can run for free with no license, and a managed cloud plan billed on usage with no per-seat or per-host fee and a hard budget cap. Both are real, uncommon value propositions in a category where most vendors charge per host or gate ingestion behind a sales call, and they are why Uptrace built a real self-hosted base over the past few years.
That base is now doing the math on what changed. Uptrace restructured into a five-tier open-core product in 2026. The Community edition is still free and unlimited on ingest, but it now caps data retention at 14 days, and custom retention, role-based access control (RBAC), alert routing and escalation, high availability, Kafka, and audit logs sit behind four ascending paid license tiers, from a low-cost Starter plan up to custom-quoted Enterprise. The restructuring also introduced some inconsistency between Uptrace's own pages: the GitHub README lists single sign-on (SSO) via OpenID Connect (Keycloak, Google Cloud, Cloudflare) among the project's features, while the editions page puts SSO behind the second-highest paid tier. Worth confirming against your own build before you plan a deployment around it.
On the managed side, Uptrace Cloud is genuinely cheap: a metered free allowance every month, then usage-based rates per GB for spans and logs that decline with volume, plus a separate declining per-datapoint rate for metrics, no seat or host fees, and a hard budget cap. The constraints are elsewhere. Default retention is 28 days, with an optional low-cost cold-storage tier extending that to close to two years. Everything runs in Hetzner datacenters in Germany with backups in Finland, so there is no US or Asia-Pacific (APAC) region if latency or data residency demands one.
The category around Uptrace has also filled in. When Uptrace launched, "OTel-native APM on ClickHouse" was a short list. It now includes ClickHouse's own stack, a well-funded direct competitor, an extended Berkeley Packet Filter (eBPF) platform, and a set of managed vendors that were not credibly OTel-native two years ago. This article evaluates eight of them against the specific things that make an Uptrace replacement work or fail.
What you are actually replacing when you leave Uptrace
Uptrace bundles four separable things: OTLP (OpenTelemetry Protocol) ingestion, ClickHouse storage, a UI, and an alerting layer. Only the first is portable. Repointing your OpenTelemetry Collector at a new endpoint takes an afternoon. The other three are where migration effort lives, and underestimating that is how teams end up running both systems for a quarter.
The query layer is the sharpest edge. Uptrace ships two purpose-built languages: UQL, a SQL-like language for aggregating spans, and MQL, a PromQL-like language for metrics. Both compile to ClickHouse SQL under the hood, and both are Uptrace-specific. Every saved query, every alert rule threshold, every dashboard panel you have built is written in a syntax that exists nowhere else. If you are migrating, you are rewriting them regardless of destination, which means the question is not "does the new tool support my queries" but which query language do I want to be stuck with next.
Retention economics deserve a look before feature lists. Uptrace Cloud gives you 28 days by default and lets you pay a small amount to keep spans in cold storage for close to two years. Some replacements default to 15 days. Some fix retention at 30 days with no option to extend. If you have a compliance requirement or an incident-review habit that reaches back further than a month, this single number eliminates several options outright.
Then there is the storage engine, which determines how the platform behaves under cardinality pressure rather than how it markets itself. ClickHouse stores spans and logs as structured events, so adding unique attribute values does not degrade query performance the way it does in a label-indexed time-series database (TSDB). A replacement built on a Prometheus-style TSDB or a label-index log store will make different tradeoffs, and you will feel them the first time you add a customer ID attribute.
Finally, be honest about where the operational burden sits today. Running Uptrace Community means running ClickHouse, PostgreSQL, Redis, backups and upgrades. Moving to SigNoz or ClickStack keeps that burden, roughly unchanged. Moving to a managed platform removes it and replaces it with a bill and a data-residency conversation. Those are different problems, not different amounts of the same problem.
We evaluate each tool against these criteria:
-
Deployment model: self-hosted, managed, bring-your-own-cloud (BYOC), or air-gapped
-
OpenTelemetry fidelity: native OTLP ingest and semantic-convention handling versus a translation layer
-
Query surface: which languages you get, and whether queries and dashboards export
-
Storage engine and cardinality behavior: how the backend responds to high-cardinality attributes
-
Retention: defaults, ceilings, and what extending costs
-
Cost model: which dimensions the vendor charges on and what behavior that encourages
-
Operational burden: what you run and what someone else runs
-
Enterprise controls: where RBAC, SSO and audit logging sit in the plan structure
-
Data residency: which regions exist
At a glance
Pricing models below were checked against vendor pricing pages in August 2026. The specific rates move often; the structure of what you're charged on moves less, so that's the comparison worth trusting.
| Tool | Deployment | Ingest | Query surface | Default retention (managed) | Cost model |
|---|---|---|---|---|---|
| SigNoz | Self-hosted, cloud, BYOC | OTLP native | Query builder, PromQL, ClickHouse SQL | 15 days logs/traces, 30 days metrics | Per GB (logs, traces) + per million metric samples, flat monthly base |
| ClickStack | Self-hosted, ClickHouse Cloud | OTLP native, format-flexible | Lucene-style search + full SQL | No pricing-enforced limit | Infrastructure: storage per GB + separately metered compute |
| Dash0 | SaaS only | OTLP native | PromQL across all signals | 30 days spans/logs, 13 months metrics | Per million signals, no base or seat fee |
| Coroot | Self-hosted only | eBPF + OTLP | Built-in views, PromQL | Self-managed | Per monitored CPU core per month |
| Honeycomb | SaaS, customer-controlled AWS | OTLP native | Query builder, BubbleUp | 60 days | Per million events + per million metric datapoints |
| Grafana Cloud | Self-hosted (LGTM), cloud | OTLP native | PromQL, LogQL, TraceQL | 13 months metrics, 30 days logs/traces (Pro) | Active series + per GB + per active user + platform fee |
| Jaeger & Prometheus | Self-hosted | OTLP native (Jaeger v2) | PromQL + Jaeger trace search | Self-managed | Infrastructure and engineering time |
| Datadog | SaaS | OTLP compatible | Proprietary query languages | 15 days indexed logs (standard) | Per host + per GB + per indexed event + custom metrics |
The entries below are grouped by architectural approach rather than ranked. The three OpenTelemetry-native platforms that put every signal in one UI come first, since that is the shape Uptrace occupies and the shortest conceptual move. Then two tools that collect or model telemetry differently, then the composable stacks, then the full commercial suite.
1. SigNoz
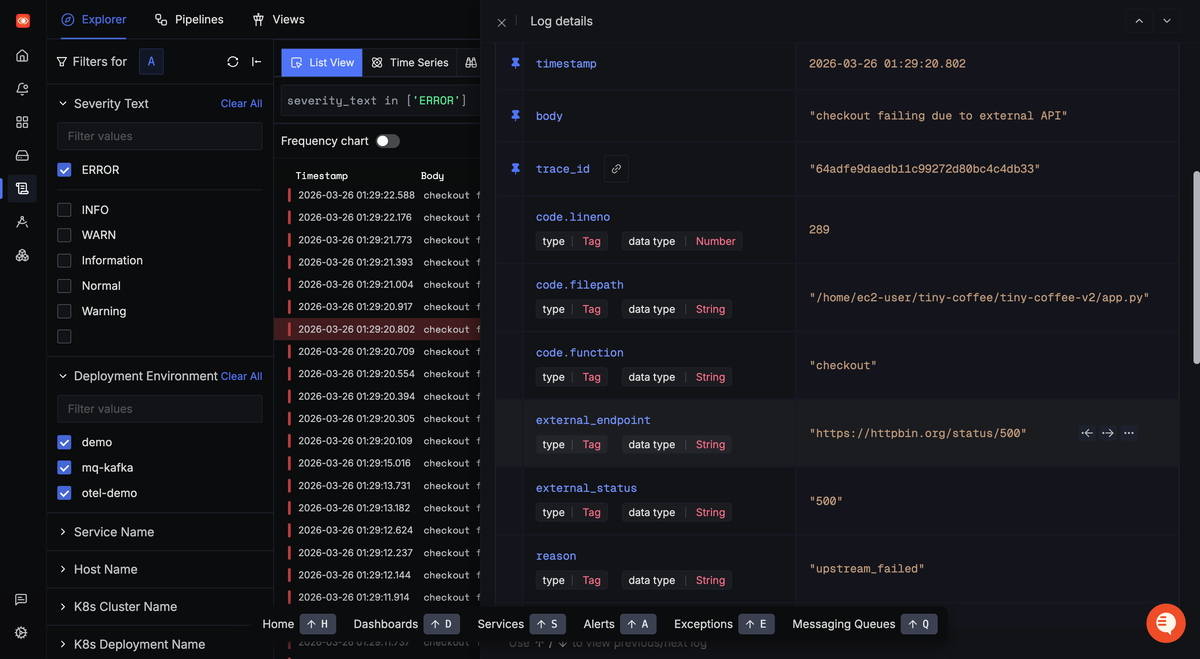
SigNoz is the closest architectural analog to Uptrace on this list. It is an OpenTelemetry-native observability platform storing logs, metrics and traces in ClickHouse, with APM, dashboards, alerting and exception tracking in a single application. It ships as a free Community Edition you run yourself, a Teams cloud plan, and Enterprise Cloud, bring-your-own-cloud, or enterprise self-hosted deployments with compliance controls, custom retention, RBAC and region selection.
If your Uptrace deployment already works and your complaint is purely about the edition ladder or the pace of development, SigNoz is the shortest migration on this list. Same ingest protocol, same storage engine, similar mental model.
What's good
-
Migration is an endpoint change, not a re-instrumentation project. SigNoz ingests OTLP natively and stores in ClickHouse. Your Collector config changes, your SDKs do not, and query performance under high-cardinality attributes behaves the way you are used to.
-
Retention is configurable per signal. Logs default to 15 days and can be extended up to a year, with only the ingestion rate changing as you extend it. There is no rehydration step and no per-query charge inside the retention window, which is a meaningful difference from index-and-rehydrate log products.
-
Cost visibility is a first-class feature. The Cost Meter breaks consumption down across logs, traces and metrics with meter alerts, and Ingestion Guard lets you cap ingestion before the bill moves rather than after.
-
AI tooling is real rather than announced. SigNoz ships an MCP server for bringing telemetry into coding agents, plus Noz, an in-product investigation agent available on SigNoz Cloud only.
The catch
Self-hosting SigNoz moves the ClickHouse problem rather than solving it. You still own capacity planning, upgrades, backups and the collector fleet. Community reports suggest planning for a meaningful ClickHouse footprint before the platform is stable under production log volume, which is the same conversation you are already having with Uptrace.
The query surface is wider than Uptrace's but not more portable. You get a visual query builder, PromQL for metrics and ClickHouse SQL for depth, which means three syntaxes to learn rather than two. Dashboards are defined in SigNoz-specific JSON, so anything you build there does not travel to another tool any more easily than a UQL dashboard does.
Cloud retention defaults are shorter than what Uptrace Cloud gives you: 15 days for logs and traces against Uptrace's 28. Extending is available and priced, but it is a line item you did not previously have.
The plan structure has its own cliff. Teams is a low, self-service monthly base, Enterprise jumps straight to a five-figure annual commitment, and there is nothing in between. Mid-sized teams that need SSO, data residency or a support SLA but do not have that kind of observability budget land awkwardly.
Pricing model
SigNoz Teams charges a small monthly base that includes a matching amount of usage, then meters logs and traces per GB and metrics per million samples, with no per-host or per-seat fees. Enterprise moves to a custom annual commitment.
The per-GB dimension for logs and traces means the model taxes attribute richness the same way Uptrace's does. A span carrying twenty useful resource attributes costs more than a bare one, which quietly encourages the exact metadata-stripping behavior that makes debugging harder later. The metrics dimension behaves differently: samples scale with collection interval, not just cardinality, so a fleet of timeseries scraped every 30 seconds produces roughly double the billable samples of the same fleet scraped every 60 seconds. Scrape interval is the cheapest lever you have.
The verdict
Pick SigNoz if self-hosting is a requirement rather than a preference and you want the migration with the fewest unknowns. Pick it also if you are moving from Community Uptrace specifically because features you needed moved behind a license, since SigNoz's community build covers a broader feature set at zero cost. Skip it if what you actually want is to stop operating ClickHouse, because this does not do that.
2. ClickStack (ClickHouse, OpenTelemetry and HyperDX)
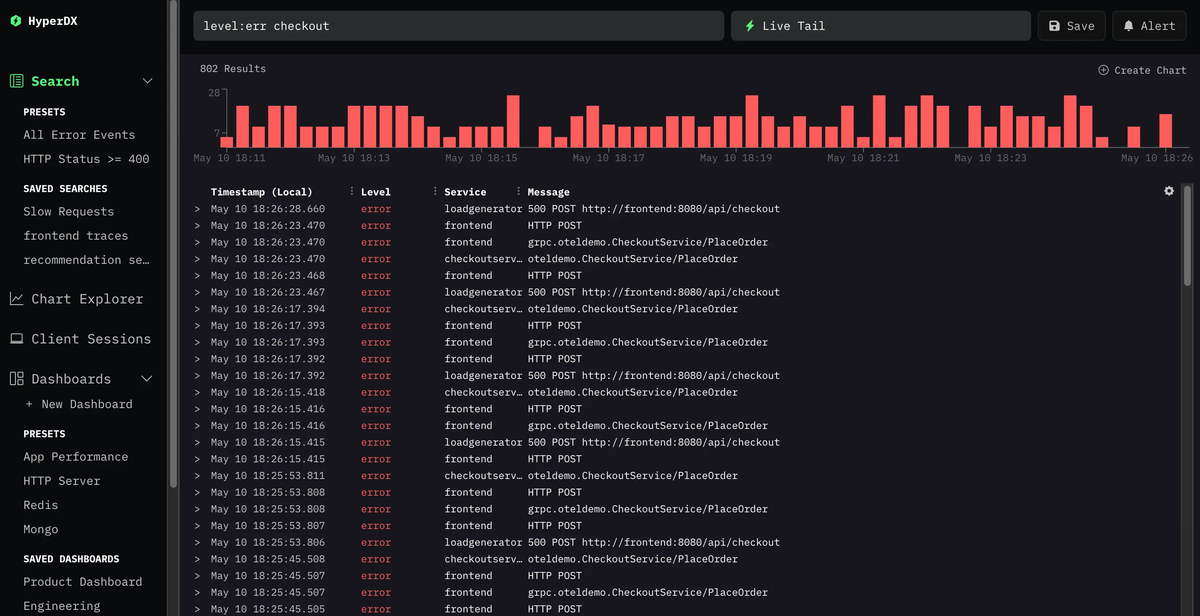
ClickStack is ClickHouse's own observability stack, assembled from an opinionated OpenTelemetry Collector, ClickHouse for storage, and the HyperDX UI. ClickHouse acquired HyperDX in March 2025 and launched the bundled stack shortly after; Managed ClickStack arrived in beta on ClickHouse Cloud in early 2026, with the UI integrated into the console, native RBAC and enterprise alerting.
For an Uptrace user, the pitch is direct. You already bet on ClickHouse as an observability store. This is that bet, maintained by the people who maintain the engine.
What's good
-
No query ceiling. HyperDX supports Lucene-style search for incident work and full SQL against the underlying tables for anything harder. Uptrace generates ClickHouse SQL for you through UQL but does not let you drop below it. Here you can, which matters the first time you need a join the product designers did not anticipate.
-
The schema tracks the engine. ClickStack ships optimized OTel schemas maintained inside ClickHouse Inc., so storage-layer improvements land without waiting for a third party to adopt them.
-
Session replay and frontend telemetry share a store with backend traces. Correlation happens by
trace_idandsession_idin one database rather than across two products. -
Storage economics are unusually good. Managed ClickStack separates storage and compute billing and prices storage well below what per-GB observability platforms typically charge, and the pricing model does not enforce a retention ceiling or push you toward sampling.
The catch
ClickStack is a stack, not a product, and the open-source path makes that obvious. Self-managed, you own ClickHouse cluster health, part merges and time-to-live (TTL) tuning. Those are not exotic skills, but they are ClickHouse skills specifically, and they are the reason a chunk of Uptrace's self-hosted base is reading this article in the first place.
Managed ClickStack was still described as a beta in ClickHouse's own launch material earlier this year. Verify the current status before you put production alerting on it.
Metrics are the least developed leg. ClickStack's strength is logs, traces and wide events. If your Uptrace deployment leans on its 50-plus prebuilt metric dashboards and Prometheus ingestion, expect to rebuild more here than the marketing implies.
The cost caveat is structural: storage pricing is published and predictable, but query compute is metered separately and is not a published number. For teams whose engineers query aggressively during incidents, the variable half of the bill is the half you cannot forecast.
Licensing splits across components, with ClickHouse and the OpenTelemetry pieces under Apache 2.0 and the HyperDX UI under MIT.
Pricing model
Managed ClickStack charges on infrastructure rather than telemetry: low-cost per-GB storage, with compute billed separately and scaled independently, and a trial credit ClickHouse sizes to cover a meaningful volume of observability data before you pay anything. Self-managed, your cost is whatever ClickHouse and object storage cost you.
Charging on infrastructure inverts the incentives most observability pricing creates. Nothing about the model discourages you from keeping full-fidelity, richly attributed data for a long time, which is the correct behavior and the opposite of what per-GB ingestion pricing encourages. The tradeoff is that your bill becomes a function of query behavior rather than ingest volume, and query behavior is harder to predict and harder to attribute to a team.
The verdict
Pick ClickStack if you chose Uptrace for ClickHouse rather than for Uptrace, and you want SQL access to your own telemetry without a product layer deciding what questions are askable. Pick Managed ClickStack if you want that without operating the cluster and can accept a variable compute line. Skip it if metrics and Prometheus-shaped dashboards are the center of your monitoring practice.
3. Dash0
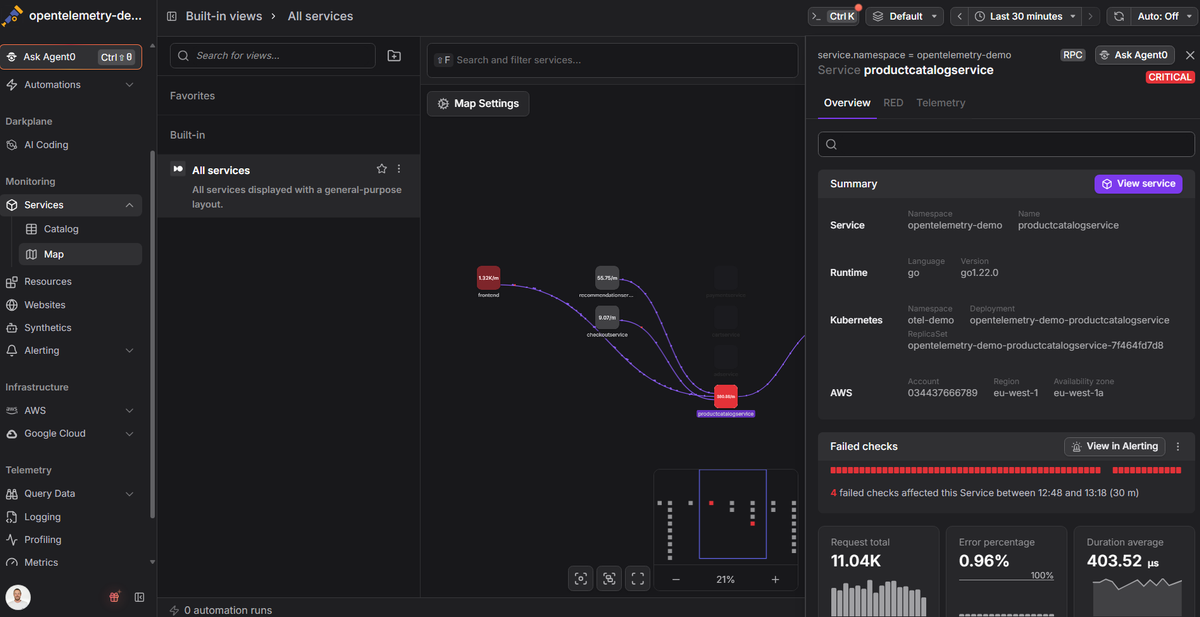
Dash0 is a managed OpenTelemetry-native platform covering logs, metrics, traces, APM, Kubernetes and infrastructure monitoring, website monitoring, synthetic checks, dashboards and alerting in one plan. Ingest is OTLP, queries are PromQL across every signal, and dashboards are Perses-compatible, which is the Cloud Native Computing Foundation (CNCF) dashboard standard rather than a vendor format.
For an Uptrace user, the relevant question is whether trading self-hosting for a managed platform is acceptable, because that trade is not optional here.
What's good
-
One query language across signals. PromQL covers metrics, and synthetic metrics derive counts and latency distributions from raw spans and logs on demand (
dash0.spans,dash0.logs,dash0.spans.duration) without pre-defining aggregations. Since you are rewriting UQL and MQL regardless, landing on a language you already use for Prometheus is worth something. -
The artifacts you build stay portable. Perses dashboards export cleanly, Prometheus alert rules and remote-write setups carry over, and existing OTel instrumentation works without a translation layer. Instrumentation and dashboards travel; investigation workflows, spam filter configuration and RBAC setup still do not, so this reduces switching cost rather than eliminating it.
-
Cost control is a product surface rather than a dashboard. Spam filters drop low-value telemetry at ingestion so you never store or pay for it, configurable in two clicks from the explorers and manageable as infrastructure as code. A monthly budget cap, warnings before the limit, and a cost-forecast integration that breaks spend down by service, namespace or resource type round it out.
-
The Kubernetes operator does the setup work. It installs a Collector, collects cluster and pod metrics, scrapes Prometheus endpoints including ServiceMonitor and PodMonitor custom resource definitions (CRDs), and auto-instruments Java, Node.js, .NET and Python workloads, with Ruby 3.3 and later available as an opt-in flag.
The catch
Dash0 is SaaS only for now. There is no self-hosted build, no bring-your-own-cloud option and no air-gapped deployment. If you run Uptrace Community specifically because telemetry cannot leave your network, this is disqualified before any other consideration, and that describes a meaningful share of Uptrace's installed base. SigNoz and ClickStack above have self-hosted paths, as does Coroot below; this does not.
Auto-instrumentation coverage has gaps. Go and PHP are not on the operator's list, so those services need manual OpenTelemetry setup or eBPF tooling. Python auto-instrumentation deactivates itself when it detects existing instrumentation, logging the conflict as a warning rather than a failure, and it requires the http/protobuf OTLP setting to activate in the first place, which means someone has to be watching for both cases.
The platform stops at observability. There is no incident management, no on-call scheduling and no status pages. Alerts route to PagerDuty, Opsgenie, incident.io, All Quiet, Slack and email, but the alert-to-resolution loop lives in other tools.
Pricing model
Dash0 meters each signal type separately: metric data points at one rate, spans, span events, log records and web events at another, and synthetic API check runs at a third. Agent0, the autonomous production AI, bills separately per credit consumed. There is no base platform fee, no per-seat charge and no per-host charge, so every feature sits in one plan and the bill is the sum of volume times published rate.
Counting signals rather than bytes means attribute richness is free. Adding another resource attribute or Kubernetes label does not create a new billing dimension, which is a real difference from Datadog's custom-metric cardinality counting and from Grafana's active-series meter, and it matters because those attributes are what make resource-scoped investigation possible.
The honest flip side, and it is the one to model before switching: span-count pricing punishes chatty instrumentation in a way per-GB pricing does not. A service emitting 40 small spans per request costs forty times one emitting a single span, regardless of how little each span carries. Uptrace makes exactly this argument on its own pricing page, noting that per-GB billing is fairer to microservice architectures generating many small spans and RPC calls, and that argument is correct. If your traces are deep and your spans are thin, run the numbers on span count per request against your current Uptrace GB volume rather than assuming the switch is cost-neutral. Spam filters and sampling are the levers that close the gap, and both work, but they are levers you have to pull.
The verdict
Pick Dash0 if you want to stop operating ClickHouse, your team already writes PromQL, and cost attribution per service is something you actively need rather than something you would like. It fits teams whose Uptrace migration is really an OpenTelemetry standardization project. Skip it if self-hosting is a hard requirement, if you need trace retention beyond 30 days, or if your fleet is mostly Go and PHP and zero-code instrumentation is the reason you are shopping.
Start a free Dash0 trial with 14 days of unlimited access if you want to test span-count economics against your own telemetry.
4. Coroot
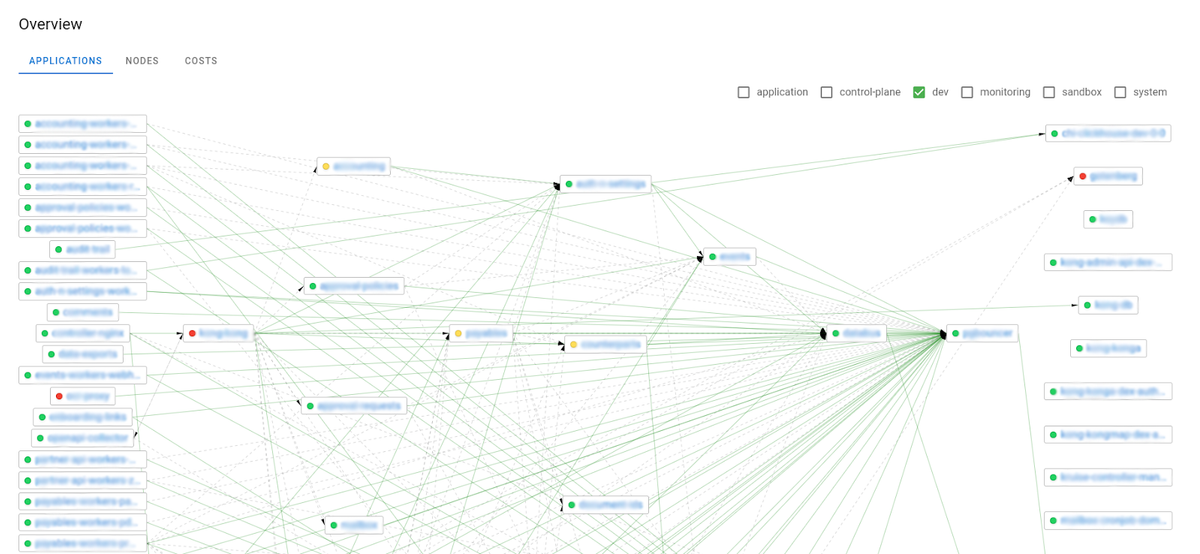
Coroot takes a different route to the same destination. It is an Apache 2.0 licensed observability and APM platform written in Go, storing metrics in Prometheus and logs and traces in ClickHouse, with an eBPF node agent that captures service-to-service calls, database queries and continuous profiling data without touching application code. It layers automated root cause analysis, service-level objective (SLO) alerting and predefined inspections on top.
The reason it belongs on an Uptrace list: Uptrace only sees what you instrumented. Coroot sees what the kernel sees.
What's good
-
Coverage without instrumentation. eBPF captures traffic from legacy services, third-party databases and anything you cannot or will not add an SDK to. Teams running Uptrace with a service map full of holes because half the estate predates their OTel rollout will notice the difference immediately.
-
Continuous profiling is included, not an add-on. CPU and memory attribution down to the line of code sits alongside traces, which is a capability Uptrace does not offer at all.
-
Alerting is consolidated rather than granular. When a service misses its SLO, Coroot sends one alert carrying the results of every relevant inspection instead of a page per symptom.
-
The pricing dimension is infrastructure, not data. A flat per-monitored-core monthly rate, with volume discounts at scale, means telemetry volume has no effect on the bill.
The catch
eBPF has hard environmental prerequisites. You need privileged DaemonSet-style node agents and kernels you control, which rules out most serverless and function platforms, some managed Kubernetes configurations, and hardened clusters where security policy forbids privileged agents. If your Uptrace deployment monitors Lambda or Cloud Run workloads, this is not a replacement for that part of your estate.
The zero-instrumentation claim has a ceiling worth naming. eBPF observes at process and network boundaries, so you get accurate service maps and request-level latency but not spans inside your own business logic. Coroot ingests OpenTelemetry traces alongside eBPF data specifically because of this, which means for deep application tracing you are back to instrumenting.
Coroot is also open core, and the shape will feel familiar if the Uptrace editions page is why you are here. The Community Edition is free, Standard adds SSO, RBAC, AI root cause analysis, profiling and cost monitoring for a per-core license fee, and Enterprise is contact-sales. You are choosing a different open-core vendor, not escaping the model.
Storage is entirely your problem: you run ClickHouse and Prometheus, size them, back them up and upgrade them.
Pricing model
Coroot charges a flat rate per monitored CPU core per month on Standard, with a free Community Edition and custom Enterprise pricing. License cost scales linearly with core count, plus whatever the underlying ClickHouse and Prometheus infrastructure costs.
Charging on cores rather than data means your bill does not move when a service starts logging at DEBUG or a new deployment triples span volume. That is the most predictable model in this comparison and the friendliest to verbose telemetry. It is also the least fair to CPU-dense, low-traffic fleets: a batch-processing cluster with 500 idle cores pays the same as one saturated with traffic. Model it against your core count, not your data volume, and remember the license fee excludes storage.
The verdict
Pick Coroot if you own your kernels, run a lot of code you cannot instrument, and want a bill that does not respond to telemetry volume. It is the strongest option here for teams whose real problem is coverage gaps rather than cost or query power. Skip it if you run serverless workloads, if privileged node agents are off the table, or if application-level tracing depth matters more than infrastructure-level coverage.
5. Honeycomb
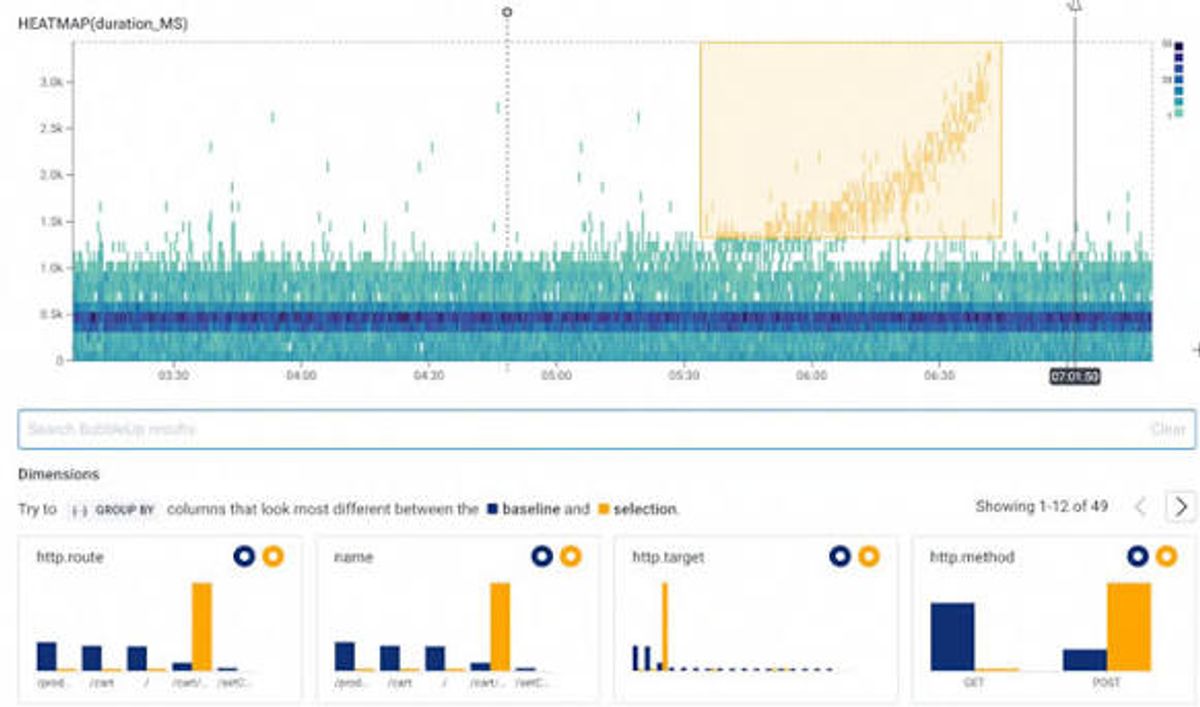
Honeycomb approaches observability from a different premise than everything else here. Rather than three signals in one UI, it stores wide, richly attributed events and gives you a query engine designed to slice them by any dimension at read time, with BubbleUp for automatically surfacing what distinguishes anomalous events from normal ones. It has been OpenTelemetry-first since before that was a common position and remains a significant contributor to the project.
What's good
-
High-cardinality querying is the product, not a feature. Filtering millions of events by customer ID, deployment version or request path returns fast without pre-aggregation or index planning, which is exactly the workload that breaks label-indexed systems.
-
BubbleUp shortens the "what changed" step. Select an anomalous region of a heatmap and it computes which attribute values differ from baseline, which is a genuinely different investigation loop from filtering by hand.
-
SLOs and error budgets are built in. No separate tool, no external burn-rate calculation.
-
The free tier is usable in production. 20 million events and 100 million metric datapoints per month with 60-day retention, which is longer than any other retention default on this list.
The catch
The event model is a real adjustment, and it is the wrong shape for a chunk of what Uptrace does. There is no traditional grep-style logging product. Teams accustomed to searching raw log lines find themselves restructuring how they emit data before Honeycomb pays off, and if your Uptrace deployment is mostly a log store with tracing attached, this is not the replacement.
Pricing changed materially on July 1, 2026. Honeycomb's Pro plan restructured from three tiers to four and roughly doubled its per-event rate, now topping out at a much higher monthly event ceiling. The increase bundles in Time Series Metrics and the Honeycomb Intelligence AI features, and teams on legacy plans can hold their old rate for one more annual term at a smaller increase during a grace period. The rate change happened recently enough that older comparison articles are quoting numbers that no longer apply.
Metrics are a secondary concern rather than a peer signal. They bill separately as datapoints, and infrastructure-monitoring depth does not match a platform built around it.
Deployment is SaaS, with a customer-controlled AWS option available for teams that need the data plane in their own account.
Pricing model
Honeycomb charges per million events and per million metric datapoints, with a usable free tier and Pro pricing scaling from there at the new, higher per-million rate.
Counting events rather than bytes flips the incentive Uptrace's per-GB model creates. Adding twenty attributes to a span costs nothing, which is the correct signal to send engineers and the reason Honeycomb users write unusually wide events. What costs money is emitting more events, so the lever is sampling rather than metadata-stripping, and Honeycomb ships Refinery for tail-based sampling to make that lever usable. The risk is that event volume is harder to forecast than byte volume: a new service that emits deep traces can move you a tier without anyone changing a logging config.
The verdict
Pick Honeycomb if your hard problem is debugging unknown failure modes in a distributed system and you are willing to restructure instrumentation around wide events to get there. Skip it if log volume is the bulk of your telemetry, if infrastructure metrics are central, or if the July 2026 rate change puts your projected event volume outside budget.
6. Grafana Cloud and the LGTM stack
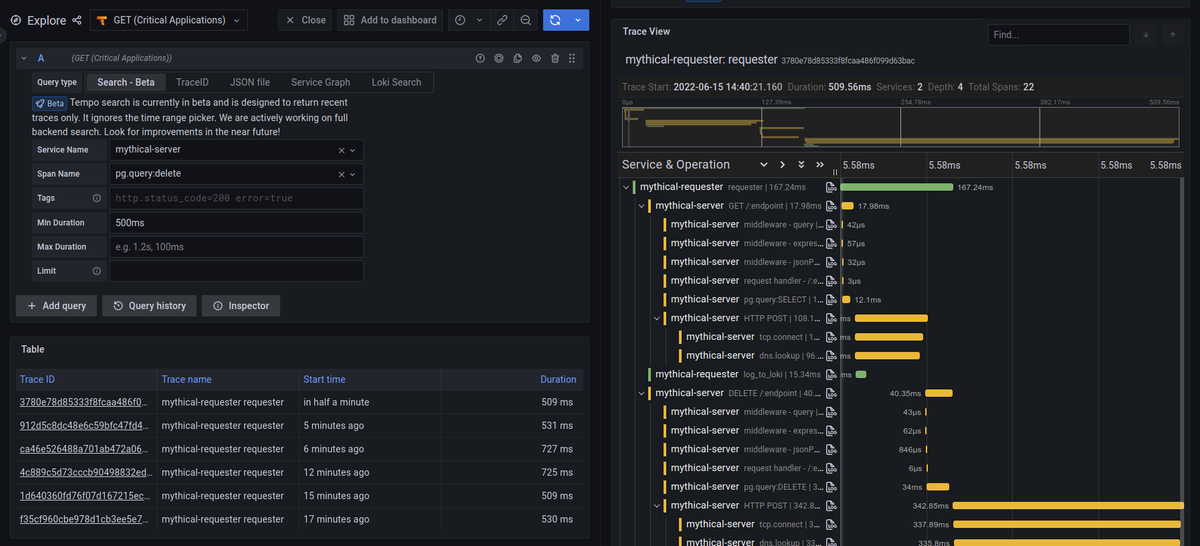
Grafana Cloud bundles Mimir for metrics, Loki for logs, Tempo for traces and Pyroscope for profiling behind the dashboard layer most engineers have already used. The same components are available to self-host, which is the standard alternative path for teams that want an open-source stack with more polish than raw Jaeger and Prometheus.
Uptrace itself supports Grafana compatibility: you can configure Grafana to read Uptrace as a Tempo or Prometheus datasource. If your team already lives in Grafana dashboards, the migration surface here is smaller than it looks.
What's good
-
The query languages are open and widely known. PromQL, LogQL and TraceQL are documented, implemented outside Grafana Labs in several cases, and already familiar to most site reliability engineers (SREs). Your team's existing knowledge transfers.
-
The free tier is the most generous in the category. 10,000 active metric series, 50 GB each of logs, traces and profiles, three users, and 14-day retention, permanently and without a credit card.
-
Adaptive Telemetry actively reduces spend. It identifies low-value telemetry and deprioritizes it, with Grafana Labs claiming 35 to 50 percent savings. Results depend on tuning, but the mechanism is real and available on all plans.
-
Profiling is included in the same platform. Pyroscope covers the continuous-profiling gap that Uptrace leaves open, billed on the same per-GB basis as logs and traces.
The catch
The architecture is exactly the fragmentation Uptrace's single UI was built to avoid. Four storage backends, three query languages, separate retention settings per signal. Correlation happens in the dashboard layer rather than in the data, which works well when someone has configured it and poorly when they have not.
Loki's index model is the specific thing to test before committing. It deliberately indexes labels rather than content to keep costs down, and queries on high-cardinality fields that are not labels are slower than teams coming from a ClickHouse-backed store expect. This is a real architectural regression from Uptrace for log-heavy debugging, and it is covered in more depth in the Grafana Loki alternatives roundup.
Self-hosting the full stack is a substantially larger operational commitment than one ClickHouse and one PostgreSQL. Multiple distributed systems, each with its own scaling characteristics and failure modes.
The plan structure has the widest gap on this list. Pro is self-service and usage-based; Enterprise requires a substantial annual spend commitment. A mid-sized team that has outgrown Pro's controls but has nowhere near that budget has no clean option, and reports of slow enterprise sales response are common enough to factor into planning.
Pricing model
Grafana Cloud Pro, per its published pricing page as of August 2026, layers a monthly platform fee on top of several usage meters: a per-active-metric-series rate that varies by resolution, a per-GB rate for logs, traces and profiles across process, write and retain components, and a per-active-visualization-user fee. Enterprise moves to a custom annual commitment.
That is five or more meters running at once, and they respond to different things. Active-series billing means cardinality and scrape interval both move the metrics line, which is the dimension teams underestimate: one badly chosen Kubernetes label can multiply series count without changing a single byte of log volume. The per-user meter is a dimension Uptrace does not have at all, and it works against the goal of giving everyone on the team access to production data. Grafana Labs' commercial position also creates a genuine tension worth naming, since the same components you would self-host for free are the ones the cloud business monetizes.
The verdict
Pick Grafana Cloud if metrics dominate your workload, your team already writes PromQL fluently, and dashboard breadth matters more than cross-signal correlation. Pick the self-hosted LGTM stack only if you have a platform team that wants to own it, because the operational delta from Uptrace is significant. Skip both if log-search flexibility over high-cardinality fields is central to how you debug.
7. Jaeger & Prometheus
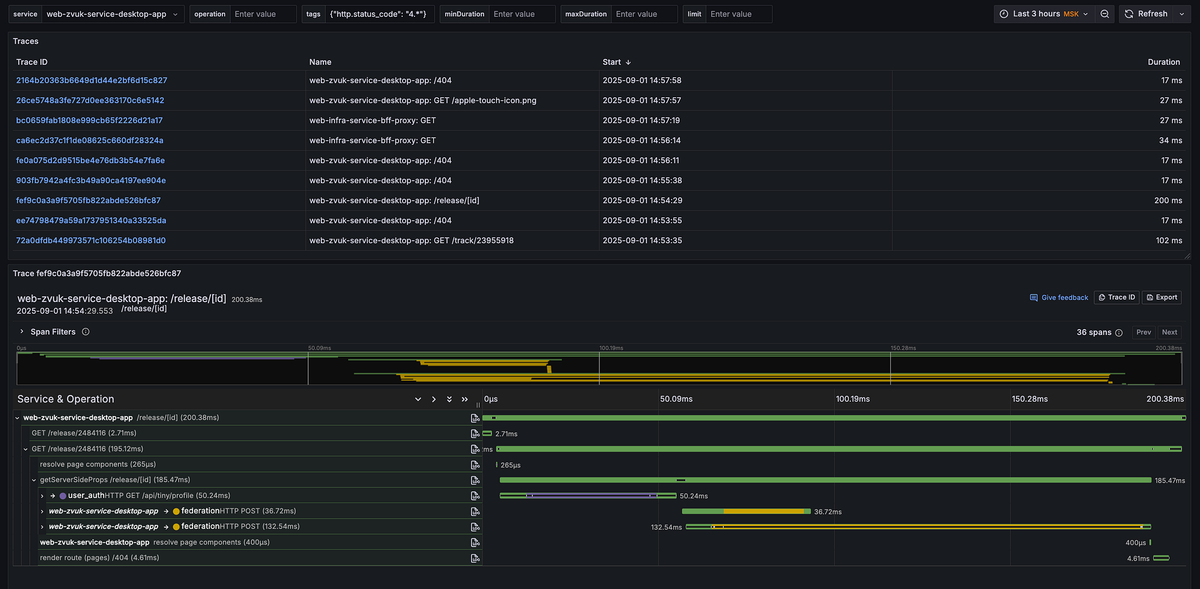
Uptrace exists partly because assembling Jaeger and Prometheus yourself is annoying. Still, this pairing is the honest floor of the category, and for some teams leaving Uptrace it is the right destination: two CNCF projects, no vendor, no license tier, no company that can change its editions page.
Jaeger v2 is built on the OpenTelemetry Collector, so OTLP ingest is native rather than adapted. Prometheus remains the default metrics store for cloud-native infrastructure and the reason PromQL is the nearest thing this category has to a portable query language.
What's good
-
Nothing is gated. There is no Community edition, no feature ladder and no vendor whose commercial interests can move features you depend on. For teams whose objection to Uptrace is structural rather than technical, this resolves it permanently.
-
PromQL travels. Alert rules and metric queries written against Prometheus work against Thanos, Cortex, VictoriaMetrics, Grafana Cloud and several managed platforms. It is the one artifact in observability that genuinely ports.
-
The ecosystem is enormous. Exporters, dashboards, runbooks and operational knowledge for both projects are abundant and free, which is not true of any product on this list.
-
Jaeger v2 on the Collector reduces the moving parts. Ingest, processing and export share one binary and one config format with the rest of your OTel pipeline.
The catch
You are giving up the thing Uptrace does best. A single UI over logs, metrics and traces with faceted filtering and cross-signal navigation is genuinely valuable, and this combination does not have it. You will run two systems with two retention models, two query languages and no correlation between them beyond copying a trace ID by hand.
Logs are simply absent. You will add a third system, and whichever you pick becomes another storage engine to operate.
Prometheus is where cardinality bites hardest. The local TSDB was designed for bounded label sets, and observability data in 2026 is not that. Adding a high-cardinality label is not a cost event here, it is a stability event, and long-term storage means adding Thanos, Cortex or VictoriaMetrics on top.
For an Uptrace user specifically, this is a step backwards in daily experience traded for a step forwards in independence. Be sure that is the trade you want.
Pricing model
There is no license cost. Your bill is infrastructure plus engineering time, and the second number dominates. Storage sizing, retention policy, high-availability topology, upgrades and the eventual long-term-storage layer are all yours.
Charging nothing for software means the model imposes no behavioral pressure at all, which is either freeing or dangerous depending on whether anyone owns cardinality discipline. Without a bill that responds to volume, nothing stops a team from adding a label that quadruples series count until Prometheus falls over.
The verdict
Pick this if independence from vendors is the actual requirement and you have platform engineers with capacity to own it. It is the right answer more often than vendor comparison articles admit. Skip it if the single-pane experience is why you liked Uptrace, because reassembling that on top of these projects is a Grafana deployment, which is the previous entry.
8. Datadog
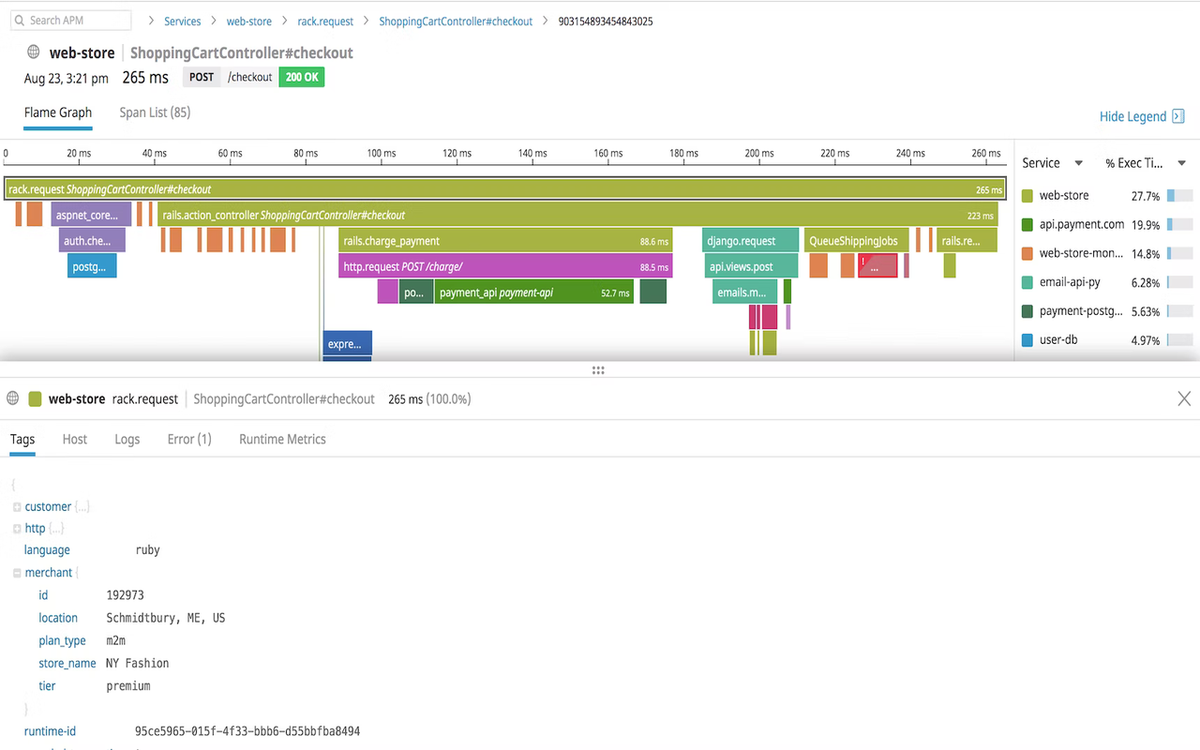
Datadog is the full commercial suite: infrastructure monitoring, APM, logs, real user monitoring (RUM), synthetics, database monitoring, security and cloud cost management under one vendor with the largest integration catalog in the category. It belongs on this list because some teams leaving Uptrace are not leaving for a cheaper or more open tool, they are leaving because they need more product than a focused APM provides.
What's good
-
Breadth is unmatched. If a system emits data, Datadog probably has an integration for it, prebuilt dashboards for it and a monitor template for it. Nothing else here comes close on long-tail coverage.
-
Time to first dashboard is short. Deploy the agent, get useful screens immediately. Uptrace's 50-plus auto-created dashboards are good; Datadog's catalog is an order of magnitude larger.
-
Enterprise controls are mature. RBAC, audit trails, compliance certifications and support structures have been shipped and refined over more than a decade, which is not true of most of this list.
-
Consolidation is real value. One vendor, one contract, one support relationship across observability and security, which matters more to procurement than to engineers but matters.
The catch
Datadog is OpenTelemetry-compatible rather than OpenTelemetry-native, and the pricing model makes that distinction concrete. Metrics sent via OpenTelemetry are billed as custom metrics, counted by unique metric-and-tag combinations, with a modest allotment included per infrastructure host and a per-unit rate charged beyond that. Following the open standard costs more than using the proprietary agent, which is an odd position for a platform to hold and an expensive one for a team migrating off an OTel-native tool.
There is also a structural tension worth stating plainly: a vendor whose revenue scales with the volume of data you send has limited incentive to help you send less. Every cost-optimization feature exists inside that constraint.
Host counting compounds the unpredictability. On the high-water-mark plan, Datadog meters host count hourly and bills the maximum of the lower 99 percent of readings, so a five-day traffic spike can set the rate for the whole month. In containerized environments, a misconfigured agent deployed per-pod rather than per-node multiplies the count without anyone noticing until the invoice.
Leaving is expensive in a way leaving Uptrace is not. Dashboards, monitors and saved queries are written in Datadog's own languages against Datadog's data model. Your OTel instrumentation stays portable; nothing you build on top of it does.
Pricing model
Datadog meters each product separately, and prices step up between tiers and between annual and on-demand commitment. Infrastructure is billed per host per month, with Pro and Enterprise tiers priced above it. APM is billed per host on top of infrastructure, or higher standalone, with each APM host including a fixed allotment of ingested and indexed spans and a per-million overage rate beyond that. Logs are billed per GB to ingest plus a per-million-events rate to index at 15-day retention. Custom metrics carry their own per-unit overage rate beyond the per-host allotment.
The model charges on several unrelated dimensions at once, which is why forecasting is hard: host count, byte volume, event count and metric cardinality all move independently, and reducing one does not reduce the others. Coming from Uptrace's two dimensions (GB and datapoints) with a hard budget cap, this is the largest structural change on the list. Datadog's billing documentation is thorough, which helps, but thoroughness is not the same as predictability.
The verdict
Pick Datadog if the reason you are leaving Uptrace is that you need capabilities a focused APM does not have, you have procurement budget for a premium platform, and consolidating vendors is worth more to you than cost control. Skip it if the OpenTelemetry investment you have already made is something you want to keep benefiting from rather than pay a surcharge for.
Which tool fits your situation
If self-hosting is non-negotiable and you want the shortest migration, go with SigNoz. Same protocol, same storage engine, broader free feature set than Uptrace Community, and a well-understood upgrade path if you later want managed.
If you chose Uptrace for ClickHouse rather than for Uptrace, ClickStack is the more direct expression of that decision, with full SQL access and a schema maintained by the engine vendor. Take the managed version if you want to keep the database and drop the cluster administration.
If you want to stop operating storage entirely and standardize on one query language, Dash0 fits, with the firm caveat that SaaS-only and 30-day trace retention are not negotiable. Model span count per request before assuming the per-signal model is cheaper than what you pay Uptrace today.
If your service map has holes because half your estate is not instrumented, Coroot solves a problem none of the others do, provided you control your kernels and can run privileged node agents.
If your hard problem is debugging failure modes nobody anticipated, Honeycomb's wide-event model is the strongest tool here for that specific job, as long as your telemetry is trace-shaped rather than log-shaped and the July 2026 rates fit your event volume.
If metrics dominate and your team writes PromQL in its sleep, Grafana Cloud gives you the largest dashboard ecosystem and the most generous free tier, at the cost of returning to per-signal backends and adding a per-user meter.
If vendor independence is the actual requirement, Jaeger and Prometheus with a log store of your choosing is a legitimate answer. You will lose the single-pane experience and gain a guarantee that nobody's editions page can change your deployment.
If you need more product rather than a smaller bill, Datadog is the honest answer, with the equally honest caveat that its pricing model is shaped in the opposite direction from what you have now.
Final thoughts
The options split into three groups, and the split is about where operational burden sits rather than about features. SigNoz, ClickStack, Coroot and the Jaeger and Prometheus pairing keep the burden with you, which is the right call if data residency, cost at high volume or vendor independence is the binding constraint. Grafana Cloud, Honeycomb, Dash0 and Datadog move it to a vendor and hand you a bill whose shape you should understand before you sign, because bill shape is what determines whether your engineers instrument generously or defensively two years from now.
The thing worth carrying forward from Uptrace is the instinct that made you choose it: OpenTelemetry in, open storage behind it, no proprietary agent between your code and your data. That instinct is now servable by most of this list, which was not true when Uptrace launched. Dash0 sits in the managed group for teams whose replacement project is also an OpenTelemetry standardization project, where PromQL across every signal, Perses dashboards, per-signal billing without seat or host fees, and spam filters that drop telemetry before it becomes a line item address the query-portability and cost-attribution criteria this article set out. It does not address self-hosting or retention beyond 30 days, and if either of those is your constraint, one of the open-source options above is the better fit.
Whichever you shortlist, replay a week of representative production telemetry into two candidates and run the investigations your team actually performs at 3am. Cardinality behavior, retention defaults and cost model interact in ways that no comparison table predicts for your specific workload.
Sign up for a free Dash0 account with 14 days of unlimited access.