Bugsnag became SmartBear Insight Hub in January 2025, and the rebrand was honest about the direction: the product moved past error monitoring into real user monitoring, backend performance, and OpenTelemetry-native distributed tracing. If you are shopping for a Bugsnag alternative right now, that shift is probably part of why. The tool you bought to answer "which release broke, and for how many users" is now sold as an observability hub, and you are being asked to decide whether it should be your observability hub.
The other reason teams move is the meter. Insight Hub prices on monthly error events plus packs of performance spans, so a bad release costs more than a good one. That is a strange incentive to live with. Once you have argued about event tiers twice, the idea of folding crashes into telemetry you already pay for starts to look appealing.
The problem is that "error tracking" means two different things. In an error-first tool it means an issue: a fingerprinted group of exceptions with an owner, a snooze button, a regression alert, and a stability score measured against sessions. In an observability platform it usually means an error span or an error log you can query. Both are useful. They are not the same product, and swapping one for the other quietly deletes a workflow your release process may depend on.
This comparison looks at eight platforms where error tracking sits inside a broader telemetry system rather than standing alone, which is what most teams leaving Insight Hub actually want. I have weighted the things that break during a migration and get glossed over in vendor pages: whether crash-free rates survive, whether your mapping files still resolve stack traces, what sampling does to error visibility, and which billing dimension your errors land on.
Considerations when choosing a Bugsnag alternative
Start with the denominator. A stability score is errors divided by sessions, and Insight Hub sells release stability targets on top of that. Sentry has the equivalent through Release Health, where SDKs report session data and you get crash-free session and crash-free user rates per release. Most observability platforms never see a session at all. They see spans and log records. You can build an error rate from those, but "1.4% of requests failed" and "0.3% of user sessions crashed" answer different questions, and only one of them tells you whether to promote a build.
Then the symbolication pipeline, which is where mobile migrations stall. Insight Hub takes dSYMs, ProGuard mappings, and source maps. So does Datadog, which needs .dSYM files uploaded before iOS stack traces resolve, matched by a generated build ID. Elastic takes RUM source maps through the APM server. Some platforms take none of it, and an unsymbolicated iOS crash is a column of memory addresses. Whatever you pick, someone has to wire the upload into every release build in CI, and that job is nobody's favorite afternoon.
Sampling is the trap that only shows up during an incident. Error trackers capture every event by design. Tracing platforms sample, and error tracking layered on sampled traces inherits the gaps. Datadog is explicit that an error span needs error.stack, error.message, and error.type and must belong to a complete trace to be tracked, with a stack of at least two lines containing one meaningful frame. Per-GB platforms create the same pressure through the bill: SigNoz's analysis of New Relic pricing walks through a 20-service estimate where full trace ingestion runs into thousands per month, so teams sample, and at 1% an error affecting 2% of requests becomes nearly invisible.
Cost models differ in what they punish, not just in what they cost. Per-event pricing scales with your worst days. Per-host pricing decouples the bill from error volume and instead taxes your fleet, including the nodes that autoscale away by lunchtime. Per-seat pricing decides who is allowed to look at a crash. Per-signal and per-GB pricing scale with total telemetry, which is more predictable but rewards sending less of it.
Finally, the parts nobody demos. Issue assignment, two-way Jira sync, snoozing, regression alerts when a fixed error resurfaces, and the release annotations that make a spike interpretable. Insight Hub has all of that, including automatic error assignment on its top tier. A query-driven platform can find your errors faster than you expect and still leave you rebuilding triage in Slack. Worth checking too: browser and mobile capture pulls in user identity, URLs, and breadcrumb trails, so redaction, retention, and consent become your problem in whichever tool you land on.
We'll evaluate each tool against these criteria:
- Error grouping and triage: fingerprinting quality, plus assignment, snooze, and regression detection
- Release health: whether crash-free or stability metrics exist, and what the denominator is
- Symbolication: dSYM, ProGuard, NDK, and source map handling
- Platform coverage: native mobile, browser, and backend
- Frontend-to-backend correlation: can you get from a crash to the trace that caused it
- Sampling and completeness: what the defaults drop, and how much control you have
- Cost model: which dimension the bill scales on
- Instrumentation portability: what you keep if you leave
At a glance
| Tool | Grouping and triage | Release health | Symbolication | Platforms | Correlation | Sampling control | Cost model | Portability |
|---|---|---|---|---|---|---|---|---|
| Sentry | Issues, assignment, regression alerts | Crash-free sessions and users | Source maps, dSYM, ProGuard | Mobile, web, backend | Errors linked to traces and replays | Per-signal quotas, SDK filters | Base plan plus ~10 metered categories | Sentry SDKs proprietary; OTLP ingest for traces and logs in beta |
| Raygun | Issues, assignment, workflows | Release and deployment tracking | Source maps, mobile mappings | Mobile, web, .NET-heavy backend | Crash to RUM session to APM trace | Spike protection, reserved events | Per event, per module | Proprietary SDKs |
| Embrace | Crash and ANR fingerprinting, session timelines | Session-based, per release | Mobile mappings | Mobile and web only | Exports to backend via OTLP | 100% session capture by default | Per user session | OTel-native SDKs, exportable |
| Dash0 | Grouping and Triage on error spans and web events | Not a packaged product | Web source maps only | Web and backend | Frontend event to backend trace | Spam filters, collector-side | Per million signals | OTLP, PromQL, Perses |
| Datadog | Issues across spans, logs, RUM | Version and RUM session views | dSYM, ProGuard, NDK, IL2CPP, Dart, source maps | Mobile, web, backend | Strong, one platform | Retention filters, ingestion rules | Per host plus per GB plus per session | Proprietary agents, OTel-compatible |
| New Relic | Errors Inbox across services | Mobile crash rates, deploy markers | Mobile and browser mappings | Mobile, web, backend | Strong, one data store | Sampling on ingest, drop rules | Per GB plus per seat | OTLP ingest supported, NRQL proprietary |
| Elastic | Server-side grouping_key and culprit | Not a packaged product | RUM source maps, mobile via EDOT | Mobile, web, backend | Strong, one index | Tail-based sampling on higher tiers | Per GB ingested plus per GB retained | OTel-native path, ES|QL proprietary |
| Grafana Cloud | Automatic error grouping in Frontend Observability | Not a packaged product | Web source maps, mobile via partners | Web and backend, mobile via Embrace or OTel | Frontend to trace correlation | Adaptive Telemetry, collector-side | Host hours plus per series, per GB, per session | Faro and OTel open source; per-signal query languages |
Pricing sources are linked in each entry below. Verified August 2026.
1. Sentry
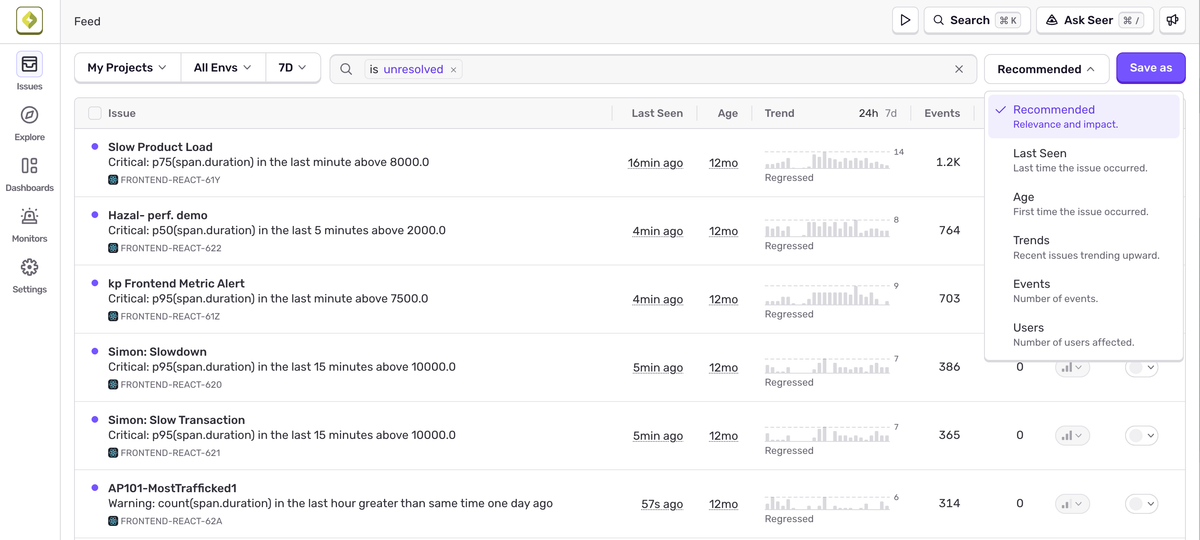
Sentry is the tool most teams shortlist first, and for good reason: it is the only option here that competes with Insight Hub on its own terms rather than asking you to think in spans. Errors, releases, session health, and session replay are one workflow, and the SDK coverage is the broadest in the category.
What's good
- Release Health does what stability scores do. Sessions carry a status and a release, which produces crash-free session and user rates you can alert on. Alerts support both crash-free session rate and crash-free user rate, so the "do we ship or roll back" conversation survives the migration intact.
- The error detail is still best in class. Stack traces, breadcrumbs, commit attribution, and replays attached to the error that triggered them. Suspect commits and assignment mean triage is a product, not a saved search.
- OTel is now a supported entry path. Sentry shipped OTLP ingestion endpoints for traces and logs in open beta in October 2025, and followed with log forwarding from the OpenTelemetry Collector, Vector, and Fluent Bit. If you already run a collector, you are not starting over.
The catch
The OTLP support has a hard boundary that matters for anyone planning to standardize. Sentry ingests OpenTelemetry traces and logs but not metrics, and the SDKs provide their own metrics capability instead, with an open issue tracking the gap. More importantly, OpenTelemetry does not capture and send errors to Sentry, so error monitoring still requires the Sentry SDK. The thing you are buying Sentry for is the part that stays proprietary.
Crash-free rate has edges worth knowing before you set targets on it. Sentry's own support documentation notes that SDKs report crashed sessions even when the crash events themselves are filtered or dropped, which is why a release with no visible unhandled errors can still show under 100%. On platforms without native support, sessions that do not end gracefully are reported as abnormal, which produces a 100% crash-free reading.
The billing surface is the other thing. Errors, spans, logs, application metrics, replays, profile hours, cron monitors, and attachments are separate meters. Events and attachments beyond quota are rejected rather than billed silently, which is a real protection, but it means quota management becomes a recurring chore rather than a setup step.
Pricing model
Sentry charges a base plan plus per-category usage. Paid plans include 50,000 errors, 5GB of logs, 5GB of application metrics, 5 million spans, 50 replays, and one uptime and cron monitor, with anything above running through reserved volume or a pay-as-you-go budget, and users are unlimited on every paid tier, so what you buy is quota. Reserved volume runs cheaper than on-demand, and Seer AI is billed at $40 per active contributor per month, where an active contributor makes two or more pull requests to an enabled repository in a cycle. Current rates are on the Sentry pricing page.
Where this interacts badly with error tracking: your error volume is the loudest meter, and error volume spikes exactly when you least want a billing conversation. A runaway loop after a bad deploy burns the included quota in hours. Sentry's spike protection and SDK-side filtering exist because this is the normal failure mode, not an edge case.
The verdict
If the error workflow is the product you want, Sentry is the straightest swap for Insight Hub and the one your developers will complain about least. Pick something else if you are consolidating onto OpenTelemetry as a matter of policy, because errors and metrics both keep you on Sentry's SDKs.
2. Raygun
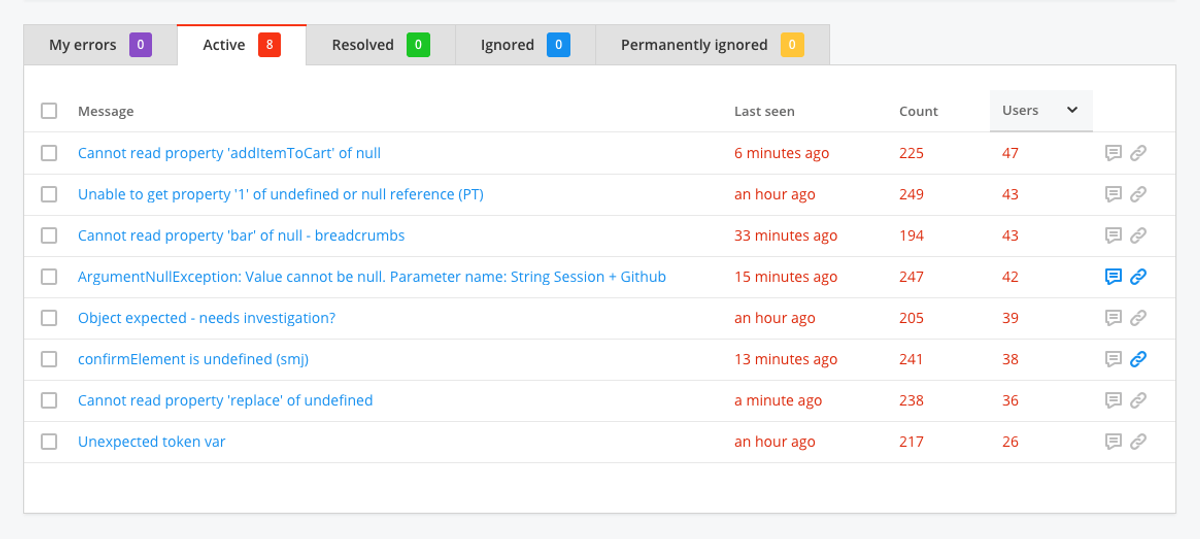
Raygun has been doing crash reporting from Wellington since 2007, and it sells three separate products that share a UI: Crash Reporting, Real User Monitoring, and APM. That modularity is the whole pitch. You buy the error tracking and skip the rest, or stack all three for a frontend-to-backend picture.
What's good
- Diagnostic depth on .NET and mobile. Full stack traces, breadcrumb trails, environment details, affected user counts, and release-correlated error rates. Better Stack's teardown, written by a competitor, still concedes that for teams asking why one specific user is crashing and what went wrong in the code, Raygun's diagnostic depth is impressive.
- Seats are not a cost dimension. All plans include unlimited apps and members, which is the opposite of the New Relic problem further down this list.
- Spike protection is built into the pricing model. Raygun added it alongside usage-based billing specifically to handle a sudden influx of errors well above the previous 24-hour average, with notifications rather than a silent overage.
The catch
Raygun's scope is narrower than the word "observability" implies. Crash Reporting, RUM, and APM are the platform, per Raygun's own product pages; logs, infrastructure metrics, and synthetic monitoring live in other tools. There is no session replay either, so "what was the user doing" means reading a session timeline rather than watching one.
Each module carries its own event quota, which sounds flexible and behaves like three budgets to babysit. Reserved events start at 100,000 per plan and increase in increments of 50,000, with usage above the allocation charged as on-demand. There is also no free tier, only a 14-day trial with no credit card, with usage capping and SAML SSO sold as add-ons on lower tiers. Making SSO an add-on in 2026 is a choice.
Correlation stops where Raygun's own products stop. You can pivot from a crash to a RUM session to a Raygun APM trace, and that is it. If your backend runs on OpenTelemetry into a different platform, the trace link breaks at the boundary.
Pricing model
Per event, per module. Published tiers run Crash Reporting from $40/month annually for 100,000 errors, $80 for 200,000, and $400 for one million, with RUM and APM each starting at $80/month for 100,000 sessions or traces, and on-demand overage at $0.001 per error or $0.002 per session or trace. Annual billing saves roughly a third against monthly. Current tiers are on the Raygun pricing page.
This is structurally the same incentive Insight Hub has, so a migration here does not fix the "bad release costs more" complaint. What it does fix is scope creep: you are not paying for a platform you use one corner of, and the per-unit rate at 100,000 events is competitive.
The verdict
Raygun is the honest answer for teams who liked Bugsnag's shape and disliked its vendor or its bill. Strong fit for .NET shops and mobile teams that want crash reporting plus real user data without a platform migration. Wrong fit if consolidation is the goal, because you will still run a separate logging and infrastructure stack.
3. Embrace
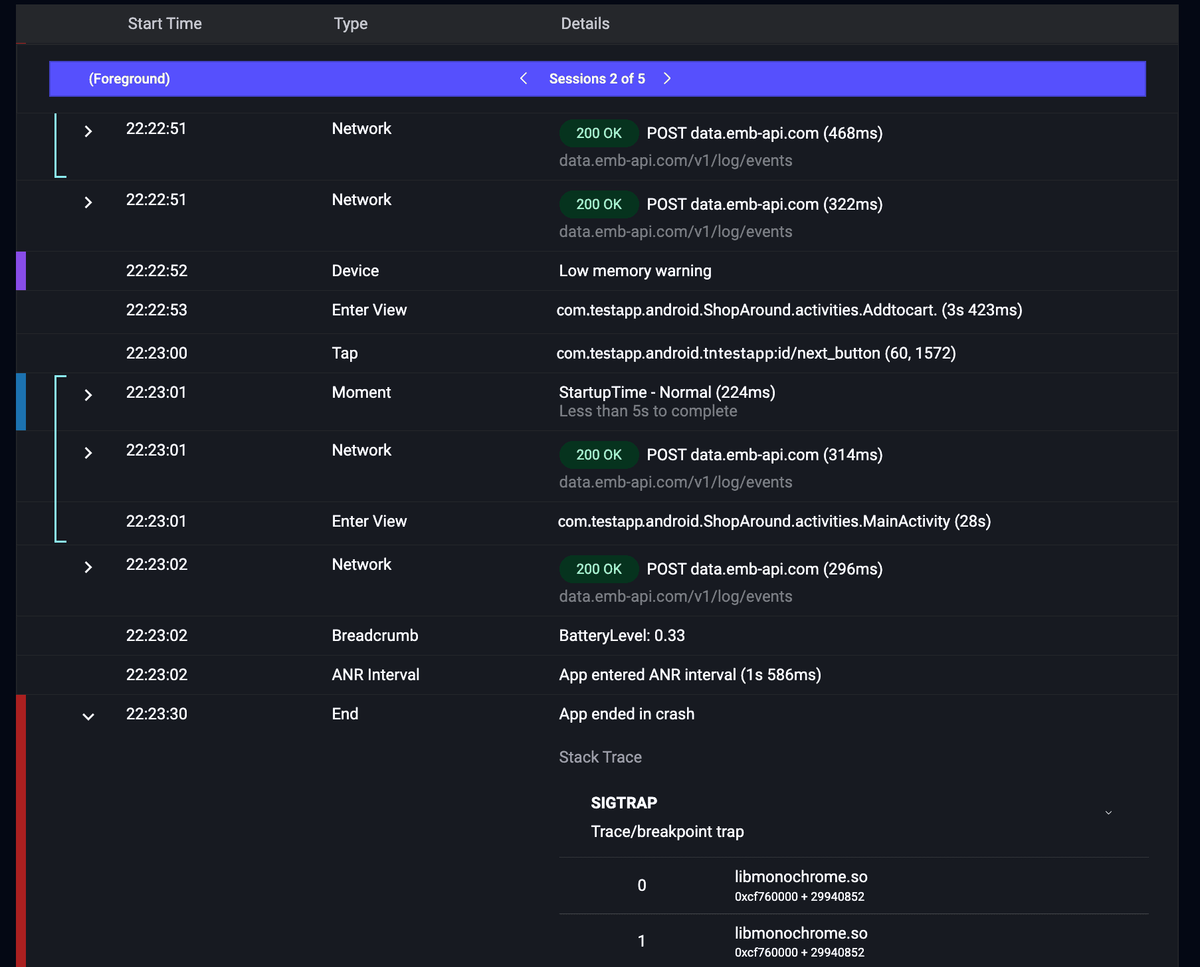
Embrace is the mobile specialist, and the only vendor here that built on OpenTelemetry from the SDK up rather than adding OTLP support later. Its iOS and Android SDKs are open source OTel distributions that capture crashes, errors, ANRs, performance traces, memory issues, and full user sessions, modeled as spans and logs.
What's good
- Mobile signals that generic platforms miss. A Capterra reviewer running it in production put it plainly: Embrace has better tooling around out-of-memory, ANR reporting, and crashes than most multi-purpose observability platforms. Session-level drill-down covers backgrounded sessions too.
- Your mobile telemetry is genuinely portable. Embrace telemetry exports to any OTLP-compatible backend through standard SpanExporter and LogRecordExporter interfaces, with existing paths into Honeycomb, Grafana, Datadog, and Chronosphere. The Honeycomb integration surfaces frontend session data, crash signals, network insights, and Core Web Vitals inside Honeycomb.
- Coverage over sampling. The platform is built around capturing every session rather than a percentage, which is the correct default for crash analysis and unusual in this list.
The catch
Embrace covers mobile and web frontends. There is no backend APM, no log management, no infrastructure monitoring. It is a component of an observability stack, not the stack, which means it replaces the half of Insight Hub you probably cared about and none of the rest.
Analysis and dashboarding are the weak spot, and users say so. The same Capterra reviewer noted that dashboarding features in data search are practically non-existent, and an independent review found that detailed analytics generally means exporting to an external tool such as Grafana, with custom metrics apparently limited to the Enterprise version. Embrace ships a Prometheus endpoint and a dashboard template to make that path easier, which is pragmatic and still means two tools.
Pricing is not published. The model is session-based rather than per user or per install, with a free tier of one million user sessions per year for up to five users, and that free account comes with three days of retention. Three days is enough to evaluate and not enough to investigate anything a user reported on Friday. Everything above it requires a sales conversation.
Pricing model
Per user session, with tiers behind a demo request. The structural advantage is real: sessions are a function of traffic, not of stability, so a catastrophic release does not inflate the bill the way per-event pricing does. You can also forecast sessions from your existing analytics, which is more than most teams can do with span counts.
The structural cost is that a session is a coarse unit. A user who opens the app twice a day generates 60 sessions a month whether or not anything interesting happened, and there is no published rate card to model against before you talk to sales. Unpublished pricing is itself information: it usually means the model is negotiated per account.
The verdict
If your product is a mobile app and Insight Hub's crash reporting is the part you cannot lose, Embrace is the strongest replacement and the only one that hands you portable OTel data on the way out. Pair it with a backend platform rather than expecting it to be one. Skip it if mobile is a side channel for a web product.
4. Dash0
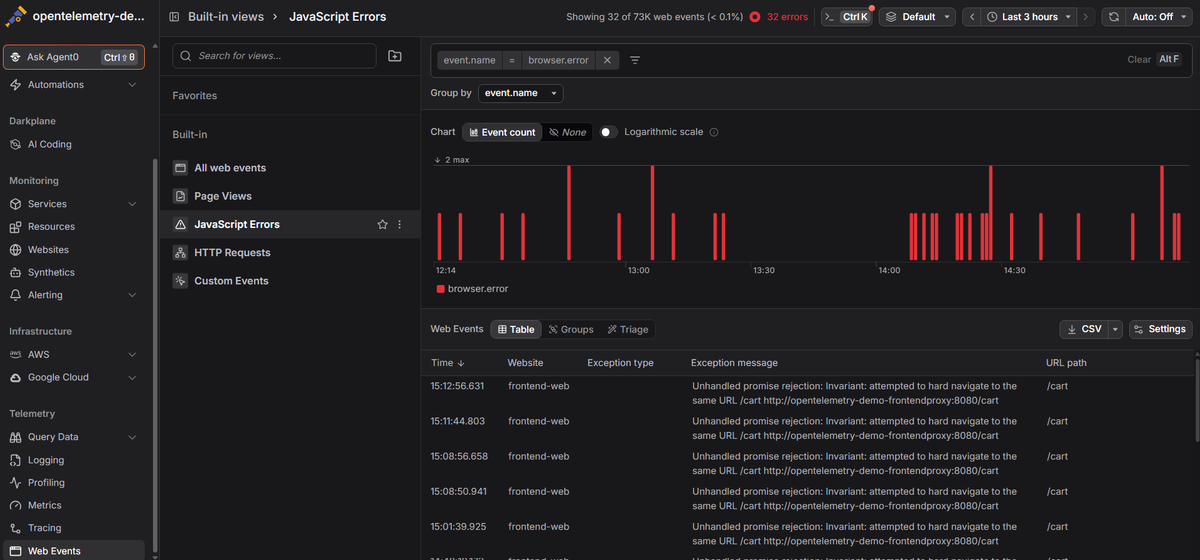
Dash0 is an OpenTelemetry-native platform built by the team behind Instana, covering logs, metrics, traces, and browser telemetry with PromQL as the query language across all of them and Perses for dashboards. Errors show up in two places: as failed spans and error logs in the backend, and as browser error events from the Web SDK.
What's good
- Frontend errors resolve to source and link to backend traces. The Web SDK captures unhandled exceptions and unhandled promise rejections with exception.type, exception.message, exception.stacktrace, and url.path attributes, and session detail shows page flow, events, frontend-to-backend trace correlation, and JavaScript errors with source map resolution.
- Triage is comparative rather than manual. The Groups tab aggregates by attribute with counts and sparklines for ranking the most common error messages, while Triage highlights anomalies and outliers in the current filtered set, and Triage runs automated comparative analysis to surface which attributes differentiate erroneous or slow spans from a baseline.
- Counting errors does not cost extra. Synthetic metrics are calculated on the fly from telemetry you already sent, are not charged on your bill, and can count and alert on logs, spans, and span events without predefined aggregations. Error rate alerts without a custom metric line item.
The catch
The biggest one for this audience: there is no native mobile SDK. Dash0's documentation covers a Web SDK for websites and single-page applications, and iOS and Android crash reporting is the reason a lot of teams bought Bugsnag in the first place. The workable path is sending OTel mobile telemetry from Embrace or EDOT into Dash0 over OTLP, which is a real option and still means two vendors and no packaged crash view.
Release health is also not a product here. No stability score, no crash-free session rate, no stability targets to gate a rollout on. The triage workflow is thinner too: no issue assignment, no snooze, no regression alerts when a fixed error resurfaces, no two-way Jira sync. If your release process is built on Insight Hub's stability targets and automatic assignment, Dash0 does not replace that layer and you will rebuild parts of it with alerts and dashboards.
Two more. PromQL is the only query language, which is comfortable if your team came from Prometheus and a learning curve if they came from SQL or a search DSL. And auto-instrumentation coverage is narrower than agent-based vendors: the Kubernetes Operator handles Java, Node.js, .NET, Python, and Ruby, with other runtimes needing manual OTel SDK work. On the data-handling side, browser session capture carries user identity, URLs, and page context, so redaction and consent stay your responsibility. Dash0 is SOC 2 Type II certified and GDPR compliant, which is table stakes rather than a differentiator.
Pricing model
Consumption per signal, with no seat or platform fee. Costs are calculated per million data points for metrics, spans, log records, and web events, or per thousand runs for synthetic API checks, with no per-seat fees, no base platform charge, and no hidden fees. Published rates on the pricing page are $0.20 per million metric data points and $0.60 per million spans, span events, log records, and web events, with synthetic API checks at $0.20 per thousand runs, and every capability is in one plan.
What that means for errors: an error is priced as one span, log record, or web event, at the same rate as a successful one. Adding stack traces, breadcrumb-style attributes, and release metadata does not change the unit cost, because a verbose log line with a full stack trace costs the same as a one-line health check. Error volume is not its own pricing dimension, though a crash loop still emits telemetry and still costs money.
Cost control is point-and-click rather than architectural. Monthly budget limits, spam filters that suppress noisy data, and a cost forecast let you drop health-check noise before it counts against billing, and the cost forecast integration breaks spend down by service and namespace for scenario planning.
The verdict
Dash0 fits web and backend teams standardizing on OpenTelemetry who want error context sitting in the same data as their traces and logs, priced so that every engineer can look without a seat conversation. It is the wrong choice if native mobile crash reporting or a packaged release-health workflow is the requirement you cannot compromise on.
5. Datadog
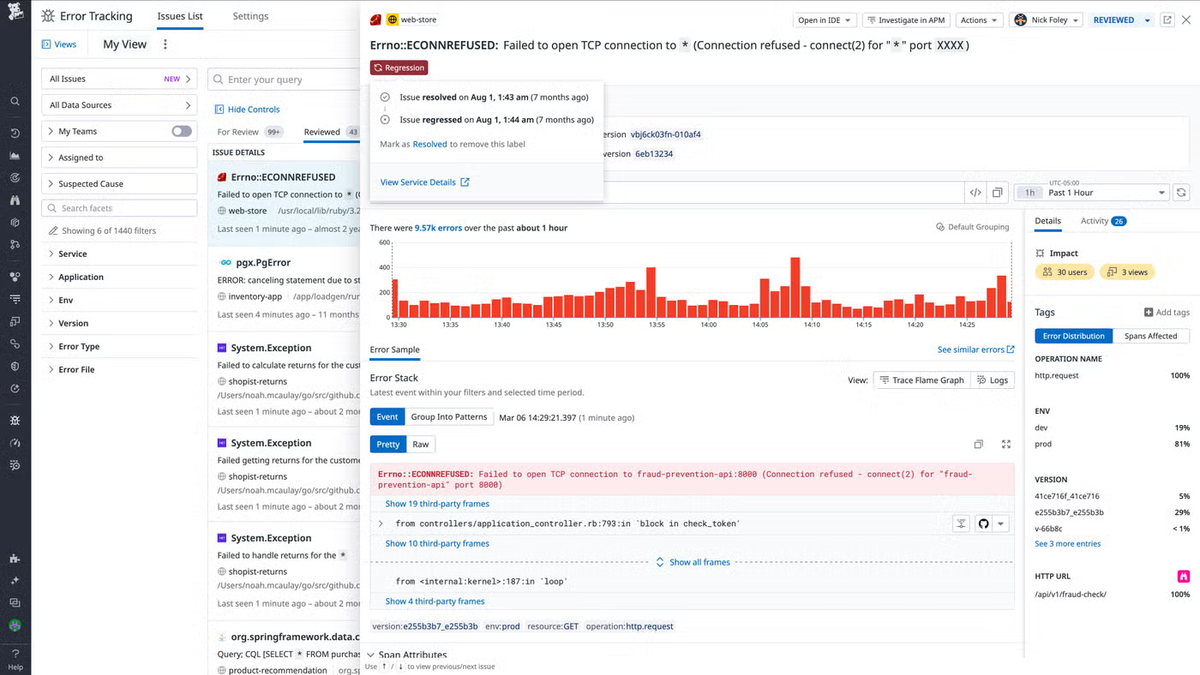
Datadog folded error tracking into a product that already had your spans, logs, and sessions, and the result is more coherent than the pricing suggests. Error Tracking groups similar errors into issues that show when they started, whether they are ongoing, and how often they occur, and supports monitors on high error volume or new issues.
What's good
- One issue model across every error source. Error Tracking captures errors across web, mobile, and backend applications, from Browser and Mobile SDKs or ingested from logs, traces, and RUM events, and it fingerprints each error span from the error type, message, and stack frames so matching errors belong to one issue.
- Mobile symbolication is thorough and automated. The Android Gradle plugin uploads the right ProGuard or R8 mapping file for each build variant automatically, and Datadog handles NDK, IL2CPP, and Dart symbols too. A generated build ID matches stack traces to symbols regardless of when the symbols were uploaded, which removes the most annoying class of migration bug.
- You can buy it without buying RUM. Error Tracking works standalone or alongside Real User Monitoring, and is already included if you use RUM.
The catch
Ingestion rules are strict enough to create silent gaps. For RUM, Error Tracking only processes errors whose source is custom, source, report, or console and that carry a stack trace, and it ignores errors from browser extensions. On the backend, an error needs a complete trace, and when an error is reported multiple times within a service, only the top-most error is kept. None of that is unreasonable. All of it means "we sent it" and "it shows up as an issue" are different claims.
The billing mechanics deserve their own paragraph, because they are the reason Datadog dominates cost-complaint threads. Host-based products meter hourly and bill the month on the high-water mark of the lower 99% of hourly readings, so a five-day launch at scale sets the rate for the whole month. Logs are billed twice, once on ingestion and once on indexed events. Custom metrics, RUM sessions, session replay, and database monitoring are each their own line.
There is also the OTel question. Datadog accepts OpenTelemetry data and even counts an OpenTelemetry Collector as a billable APM host when it submits traces, but the agents, the SDKs, the dashboards, and the query experience are proprietary. Your instrumentation can be portable here. Everything built on top of it is not.
Pricing model
Per host for infrastructure and APM, per GB and per indexed event for logs, per thousand sessions for RUM, with error tracking metered separately when bought standalone. List rates published on the Datadog pricing page put infrastructure monitoring at $15 per host per month billed annually, APM at $31 per host, and log management at $0.10 per GB ingested plus $1.27 per million ingested events, with browser and mobile RUM at $1.50 per 1,000 sessions and session replay adding $1.80 per 1,000 replays.
The model rewards buying breadth and punishes narrow use. Error tracking on 50 hosts means paying for APM on 50 hosts, and the incentives all point at collecting less: strip log fields, sample sessions, prune custom metrics. That works against the reason you collect error context in the first place.
The verdict
If you already run Datadog, stop shopping and turn on Error Tracking, because the correlation you get from having crashes in the same platform as traces and logs is worth more than a marginally better issue view. If you do not run Datadog, buying it to replace Insight Hub is an expensive way to solve a narrow problem.
6. New Relic
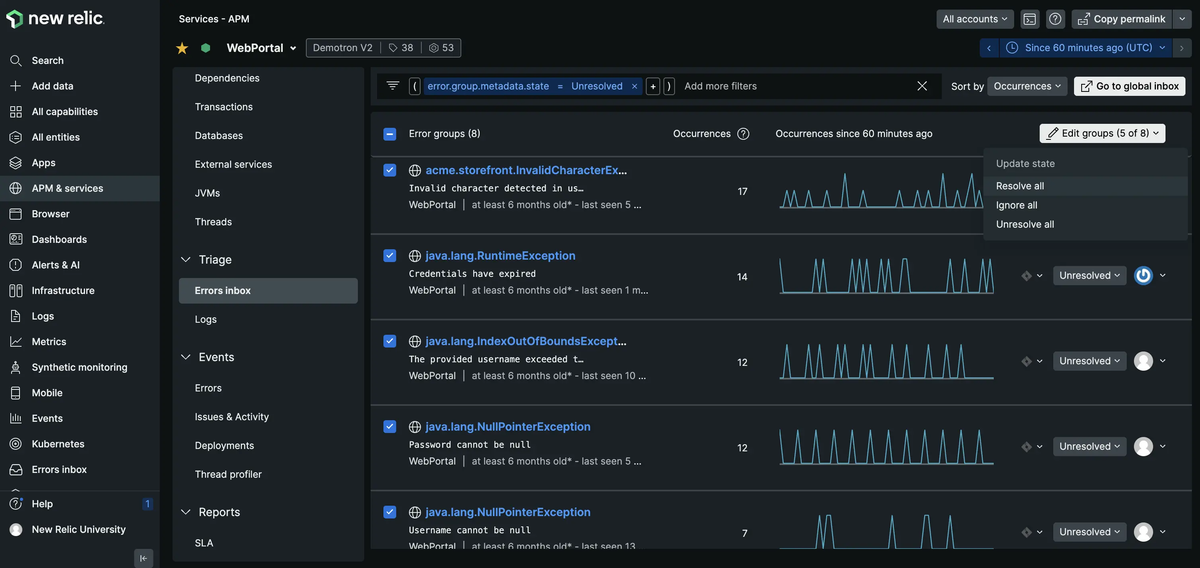
New Relic rebuilt its pricing around data and users in 2020, which makes it the closest thing here to "one meter for everything." Errors Inbox groups errors across services alongside APM, browser, mobile, logs, and infrastructure in a single store you query with NRQL.
What's good
- No host or container tax. Hosts, agents, containers, and CPUs are unlimited at no extra cost, which separates New Relic from host-priced rivals. For a Kubernetes fleet that autoscales, this alone can decide the comparison.
- The free tier is unusually usable. The perpetual free tier includes 100 GB of data ingest per month with one full platform user and unlimited basic users, which is enough to run a real evaluation rather than a demo.
- One query language over one data set. Errors, traces, logs, and mobile crash data land in the same place, so correlating a spike in exceptions with a deploy and a saturation metric is one query rather than three tools.
The catch
The seat model is the catch, and it is a big one. Basic users are free and can run queries and build dashboards, but cannot use curated experiences such as the APM, browser, or mobile UIs. Error triage lives in those curated experiences, so it needs a paid seat: Core users are $49 per month and include CodeStream, Errors Inbox, and the log management UI, while full platform users run $99 each on Standard, capped at five, or $349 per user annually on Pro. A 15-person team with five full platform and ten core seats is $2,235 per month in user fees before any data cost. When looking at a crash costs $49 a head, fewer people look at crashes.
The free tier also fails hard rather than degrading. Exceeding the free 100 GB stops ingest and platform access until you upgrade or the next month begins. Fine for a trial, alarming as a production edge.
Billing on stored volume adds a forecasting wrinkle. Ingested data means what New Relic stores after its trimming and transformation rules, not the raw volume you sent, which cuts both ways: harder to predict, sometimes cheaper than expected. And as the trace math earlier showed, per-GB pricing at scale pushes teams toward aggressive sampling, which is exactly the wrong reflex for error visibility.
Pricing model
Two independent meters plus an optional compute add-on. Data is billed per GB beyond the free 100 GB, listed on the New Relic pricing page at $0.40 per GB for Original data and $0.60 per GB for Data Plus, which adds up to 90-day retention. Seats are billed by user type as above.
The interaction with error tracking is specific: errors are cheap as data and expensive as access. A mobile app's crash reports are a rounding error against your log volume, while the seats needed to triage them are not. That is the inverse of Insight Hub, where paid plans include unlimited users and events cost money.
The verdict
New Relic suits teams that want one platform, ingest a lot, and can live with a small number of people holding full access. If your model is "every engineer owns their errors," price the seats before you get attached to the data model.
7. Elastic Observability
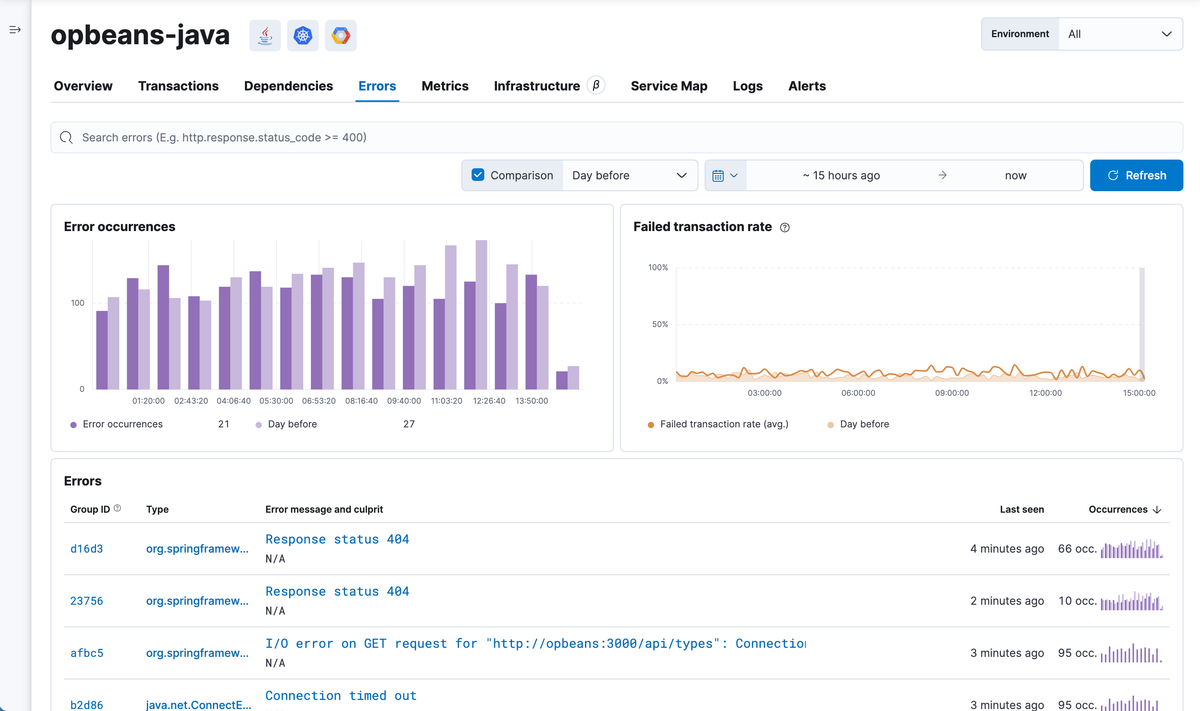
Elastic treats an error as a first-class document with server-computed grouping, which is more sophisticated than most people expect from a search company. Errors carry a grouping_key hash of selected properties for grouping, a grouping_name, and a culprit identifying the function that primarily caused the event, and when source mapping is applied, the culprit is set from the first non-library frame.
What's good
- Deployment range no one else matches. Self-managed, Elastic Cloud Hosted, or serverless, with the same error data model. For teams with data residency constraints that rule out SaaS, this is often the shortlist of one.
- Mobile went OTel-native and shipped crash reporting. The iOS and Android agents are open source distributions of the OpenTelemetry Swift and Android SDKs, with remote config and session-based sampling on top, and EDOT Android provides distributed tracing, crash reporting, session tracking, and disk buffering with prebuilt Kibana dashboards.
- Metrics got cheaper and faster in 2026. Time series metrics on serverless are now priced at 25% of the standard per-GB rate for both ingest and retention, after a rebuild on a columnar engine that added native Prometheus ingest and PromQL support.
The catch
There is a genuine gap between the browser story and the cheap deployment model: the Elastic APM RUM JavaScript agent is not compatible with Elastic Cloud Serverless and cannot send data to the serverless APM endpoint. If frontend error tracking is why you are here, that removes the most cost-effective managed option or pushes you to an OTel browser path instead.
Billed volume is bigger than the number you expect. Ingest and retention volumes are based on the fully enriched, normalized data size at the end of the ingest pipeline, before compression, so they run higher than reported Elasticsearch index size. Retention is a recurring monthly meter rather than a one-time charge, which changes how you think about keeping errors around for a quarter.
Support pricing scales with spend: beyond the included Standard level, Gold adds 5% of your charge, Platinum 10%, and Enterprise 15%. And there is no packaged release health product. No stability score, no crash-free rate widget, no assignment workflow. You get excellent primitives and a Kibana canvas.
Pricing model
Serverless Observability meters ingest per GB, retention per GB per month, and egress beyond a free allowance, across two feature tiers. Rates are volume-tiered and step down as usage grows, published on Elastic's serverless observability pricing page; Elastic Cloud Hosted uses resource-based pricing instead, and self-managed is a license.
For error tracking specifically, the model is friendly to rich errors and unfriendly to keeping them. Attributes and stack frames are just bytes at a low per-GB rate, so detailed error documents cost little to ingest. Long retention on high-volume error indices is where the bill grows, which is a manageable lever if someone owns index lifecycle policies and a trap if nobody does.
The verdict
Elastic is the pick when deployment flexibility or existing Elasticsearch investment dominates the decision, and when you have a platform engineer who enjoys Kibana. It is not a crash reporter, and pretending otherwise sets your mobile team up for disappointment.
8. Grafana Cloud
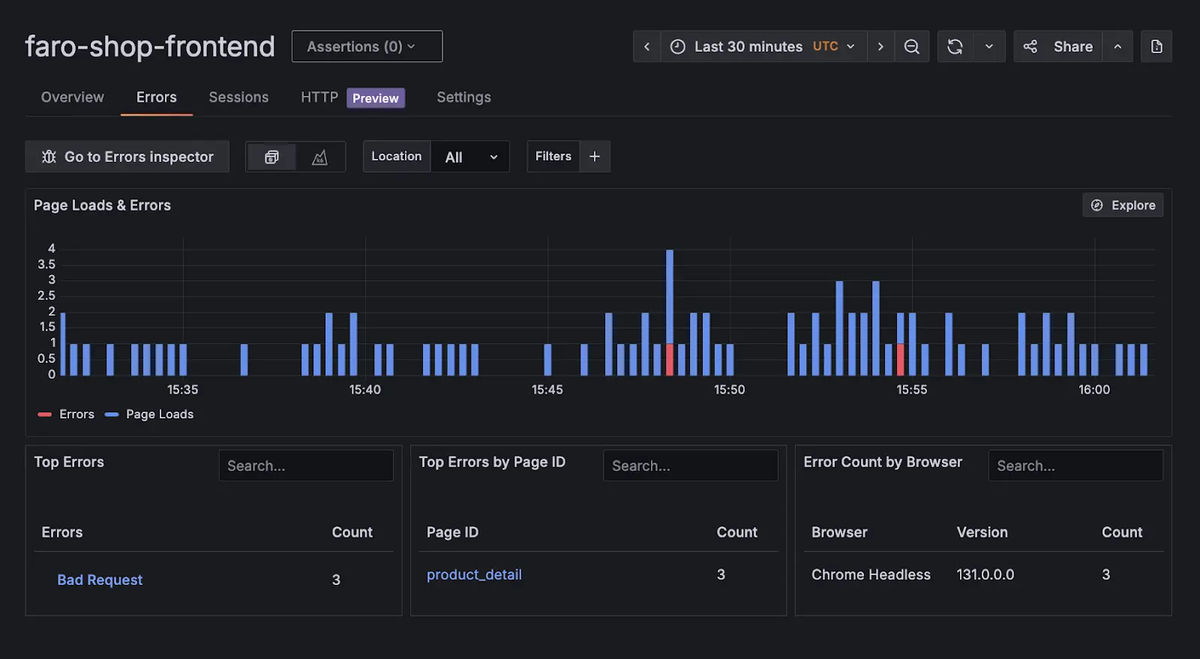
Grafana Cloud reaches error tracking from the frontend, through Faro. Faro is an open source JavaScript agent embedded in web applications to collect performance metrics, logs, exceptions, events, and traces, announced in 2022, and Grafana Cloud Frontend Observability is the managed product on top of it.
What's good
- Automatic grouping with code-level drill-down. Grafana's product page describes grouping similar errors automatically and investigating down to the specific line of code, with frontend health correlated against backend data in one place.
- The SDK is open source and OTel-friendly. Error instrumentation subscribes to window.onerror and onunhandledrejection, extracts stack traces where available, and reports through the Faro API. You can point Faro at your own collector rather than at Grafana Cloud, though openness at the SDK layer does not carry through to the backend, where signals still land in separate stores.
- The free tier is genuinely generous across metrics, logs, traces, and profiles, which makes side-by-side evaluation against your current tool cheap.
The catch
Grafana Cloud's meters multiply. Application Observability changed model for new customers on 13 February 2026: $0.025 per host hour plus separate telemetry charges of $0.50 per 1,000 active series for metrics and $0.50 per GB for traces, logs, and profiles, with no included telemetry credits, while customers from before that date stay on $0.04 per host hour with credits. Frontend Observability meters separately by session, with a free allowance of 50,000 sessions per month and Pro at $0.75 per 1,000 sessions above it, where a session ends after four hours or 15 minutes of inactivity. Two pricing models in the same product line, one of which changed this year, means most third-party cost guides you find are wrong.
Session replay, the feature that makes frontend errors reproducible, was still gated behind a waitlist on Grafana's own Frontend Observability page as of this writing. And the architecture that gives Grafana its flexibility also fragments it: separate backends per signal, with different query languages, so a frontend error, its trace, and its logs are three query dialects away from each other.
Mobile is the real gap for Insight Hub refugees. There is no first-party mobile crash SDK. The practical route is Embrace or an OTel Android or Swift SDK feeding Grafana Cloud, which works and adds a vendor. Nothing here replaces stability targets or an assignment workflow either.
Pricing model
Multiple meters, resolved per product: host hours plus per-series and per-GB telemetry for Application Observability, per thousand sessions for Frontend Observability, with separate rates for synthetics and profiles. Rates and volume discounts are published in Grafana Cloud's pricing documentation, and the Advanced tier carries an annual minimum commitment.
For error tracking, the shape is workable but hard to forecast. Frontend errors ride along inside session pricing rather than being metered individually, which is the right instinct, and Adaptive Telemetry can drop unused data before it bills. The cost is cognitive: you need to model at least three meters to know what a frontend and backend error workflow will run, and the model moved for new customers six months ago.
The verdict
Grafana Cloud makes sense if Grafana is already where your team looks during an incident and you are comfortable assembling the error workflow yourself. It is the weakest option in this list if you want error tracking to work like a product on day one, and it needs a partner for mobile.
Which tool fits your situation
If your product is a mobile app and crash reporting is the job, look at Embrace first for OTel-native mobile depth and portable data, or Sentry if you would rather have mobile and backend errors in one workflow. Firebase Crashlytics is free and covers crash-only needs, which is worth knowing before you buy anything.
If you want Insight Hub's shape from a different vendor, Raygun and Sentry are the two real options. Raygun keeps modules and seats simple. Sentry keeps release health and gives you a better story if you later consolidate.
If you are already paying Datadog, New Relic, or Elastic, turn on the error tracking you already own and spend the evaluation time on ingestion rules and sampling instead. Correlation in one platform usually beats a slightly better issue view in a second one.
If you are standardizing on OpenTelemetry for web and backend services, Dash0 puts frontend errors, spans, and logs in the same OTLP data with per-signal pricing and no seat fees, which matters when you want every engineer looking at errors. Bring a mobile tool if you ship apps.
If you have a platform team that wants to own the pipeline, Grafana Cloud or self-managed Elastic both give you the primitives and expect you to build the workflow. Choose Elastic if data residency or search matters most, Grafana if dashboards are already your team's habitat.
If crash-free session rate gates your releases, your shortlist is short: Sentry, Raygun, Embrace, or staying on Insight Hub. The observability-first platforms measure error rates against spans and requests, not sessions, and that difference will show up in your first release review.
Final thoughts
Three approaches, three trade-offs. The error-first tools that grew into observability (Sentry, Raygun, Embrace) keep the workflow you already depend on and either stop at the frontend or keep you on proprietary SDKs for the part that matters most. The full-platform vendors (Datadog, New Relic, Elastic) give you the best correlation story and charge on dimensions that have nothing to do with errors: hosts, seats, gigabytes. The OTel-native platforms (Dash0, Grafana Cloud) keep your instrumentation portable and expect you to accept a thinner triage layer than a dedicated crash reporter provides.
The gap worth naming is between correlation and cost of access. Errors are most useful next to the trace and logs that explain them, and most observability platforms make that expensive to share, either by seat or by fleet size. Dash0 sits in that gap for web and backend services: OTLP in without conversion, PromQL across every signal, per-million-signal pricing with no per-seat or per-host charge, and spam filters that drop noise before it bills. What it does not do is replace a mobile crash reporter or a stability-score workflow, and you should weigh that honestly against the criteria above.
Sign up for a free Dash0 account with 14 days of unlimited access.
Frequently asked questions
Can an observability platform fully replace a crash reporter? For web and backend services, usually yes. For native mobile, usually not on its own. The gaps are session-based stability metrics, mapping-file symbolication for iOS and Android, and the triage workflow of assignment, snoozing, and regression alerts. Check those three specifically rather than comparing feature tables.
Which pricing model is cheapest for error tracking? It depends on which dimension your workload is heavy on, not on the headline rate. Per-event pricing costs more during bad releases. Per-host pricing costs more with large or autoscaling fleets. Per-seat pricing costs more with broad team access. Per-GB and per-signal pricing scale with total telemetry regardless of stability. Model your own volumes against each vendor's published rates before comparing quotes.
Will switching platforms break my existing instrumentation? If you use vendor SDKs, expect to reinstrument. If you use OpenTelemetry, expect to change an exporter endpoint and auth headers. Instrumentation portability is the part OpenTelemetry solves. Dashboards, alerts, saved queries, ingestion rules, and incident workflows still have to be rebuilt in any migration, so budget for that rather than assuming OTel makes switching free.
Does sampling affect error tracking? Yes, and it is the most common surprise. Error trackers capture every event; tracing platforms sample. Datadog requires complete traces for backend error tracking, and per-GB platforms create financial pressure to sample aggressively. Confirm whether errors bypass your sampling configuration before you rely on the numbers.