Last updated: April 17, 2026
Manage Dashboards
Dashboards are the primary way to visualize and monitor your data. Each dashboard is a collection of panels arranged on a canvas, displaying metrics, logs, or traces over a configurable time range.
This page covers the tools available for configuring, viewing, and navigating dashboards — including editing settings, inspecting the underlying definition, controlling the time range, and presenting dashboards in a distraction-free TV Mode.
Click Settings to configure the dashboard name and description.

The panel on the right lets you add or change the dashboard's name and description.
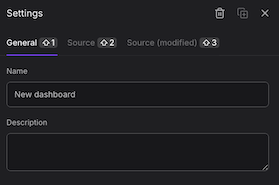
Settings are saved when you save the dashboard.
View the Source
The Edit JSON / View Source option exposes the underlying Perses JSON definition.
Two views are available:
- Plain Source: The last saved version of the dashboard definition.
- Draft Source: The current working version, including any unsaved modifications. This view only appears if the dashboard has been previously saved and subsequently modified.
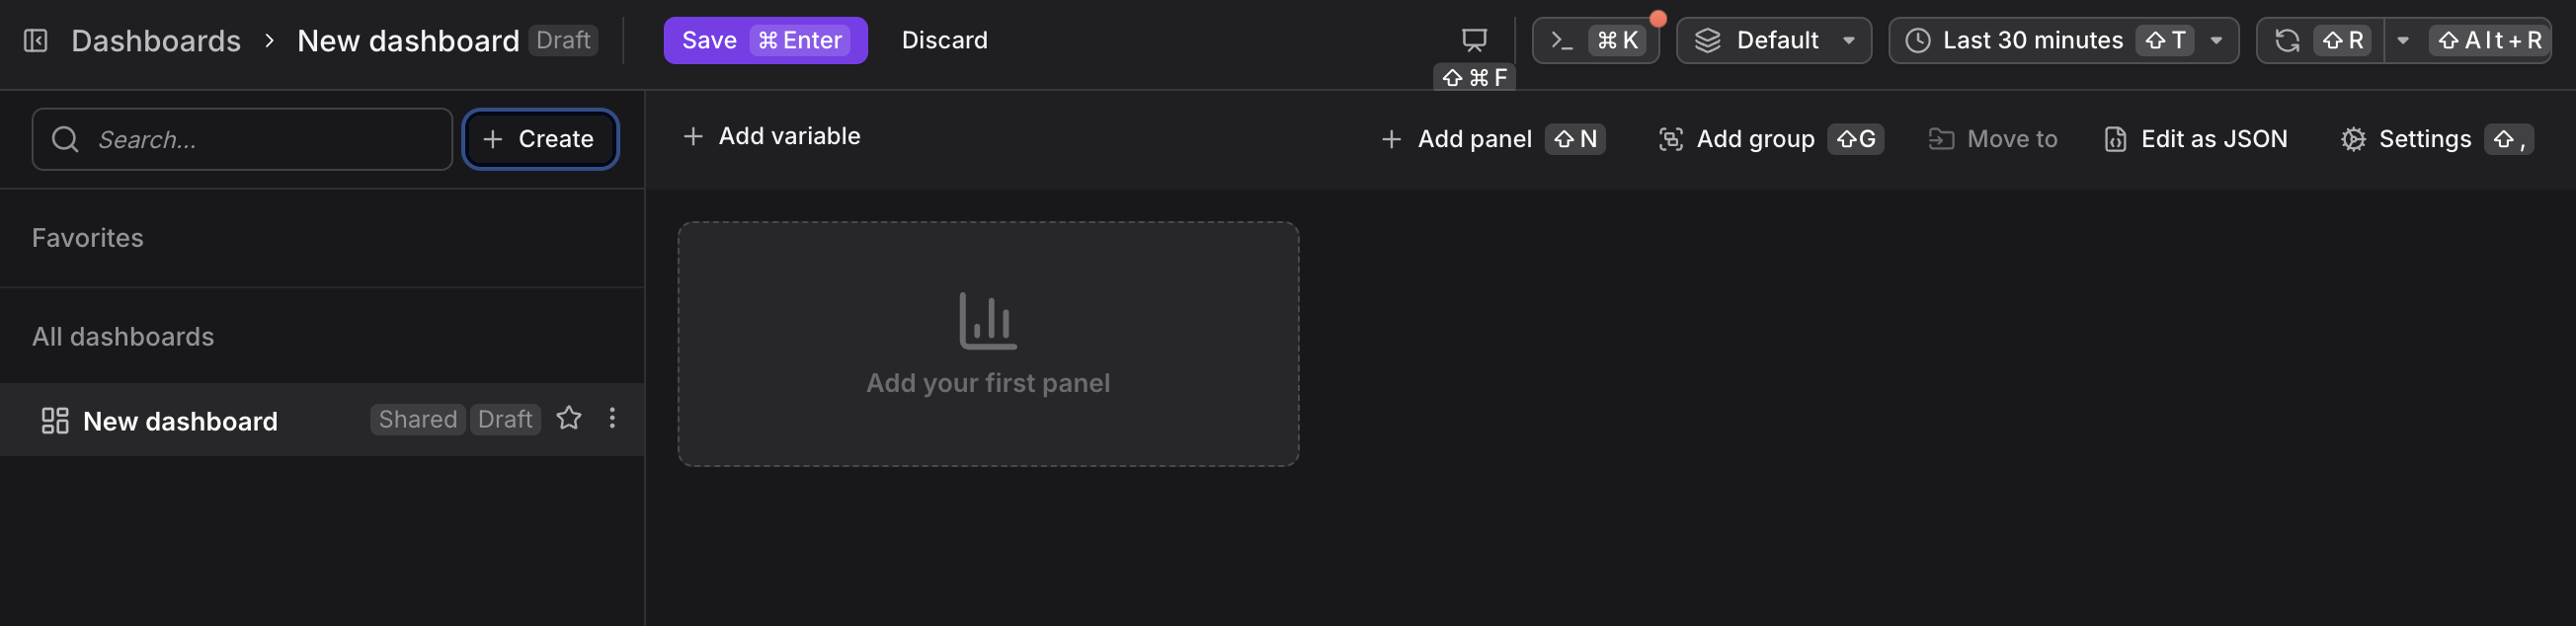
Set the Time Range
A global time range control sets the time window applied to all panels on the dashboard.
You can also drag-and-zoom directly on any chart to narrow the time range interactively.
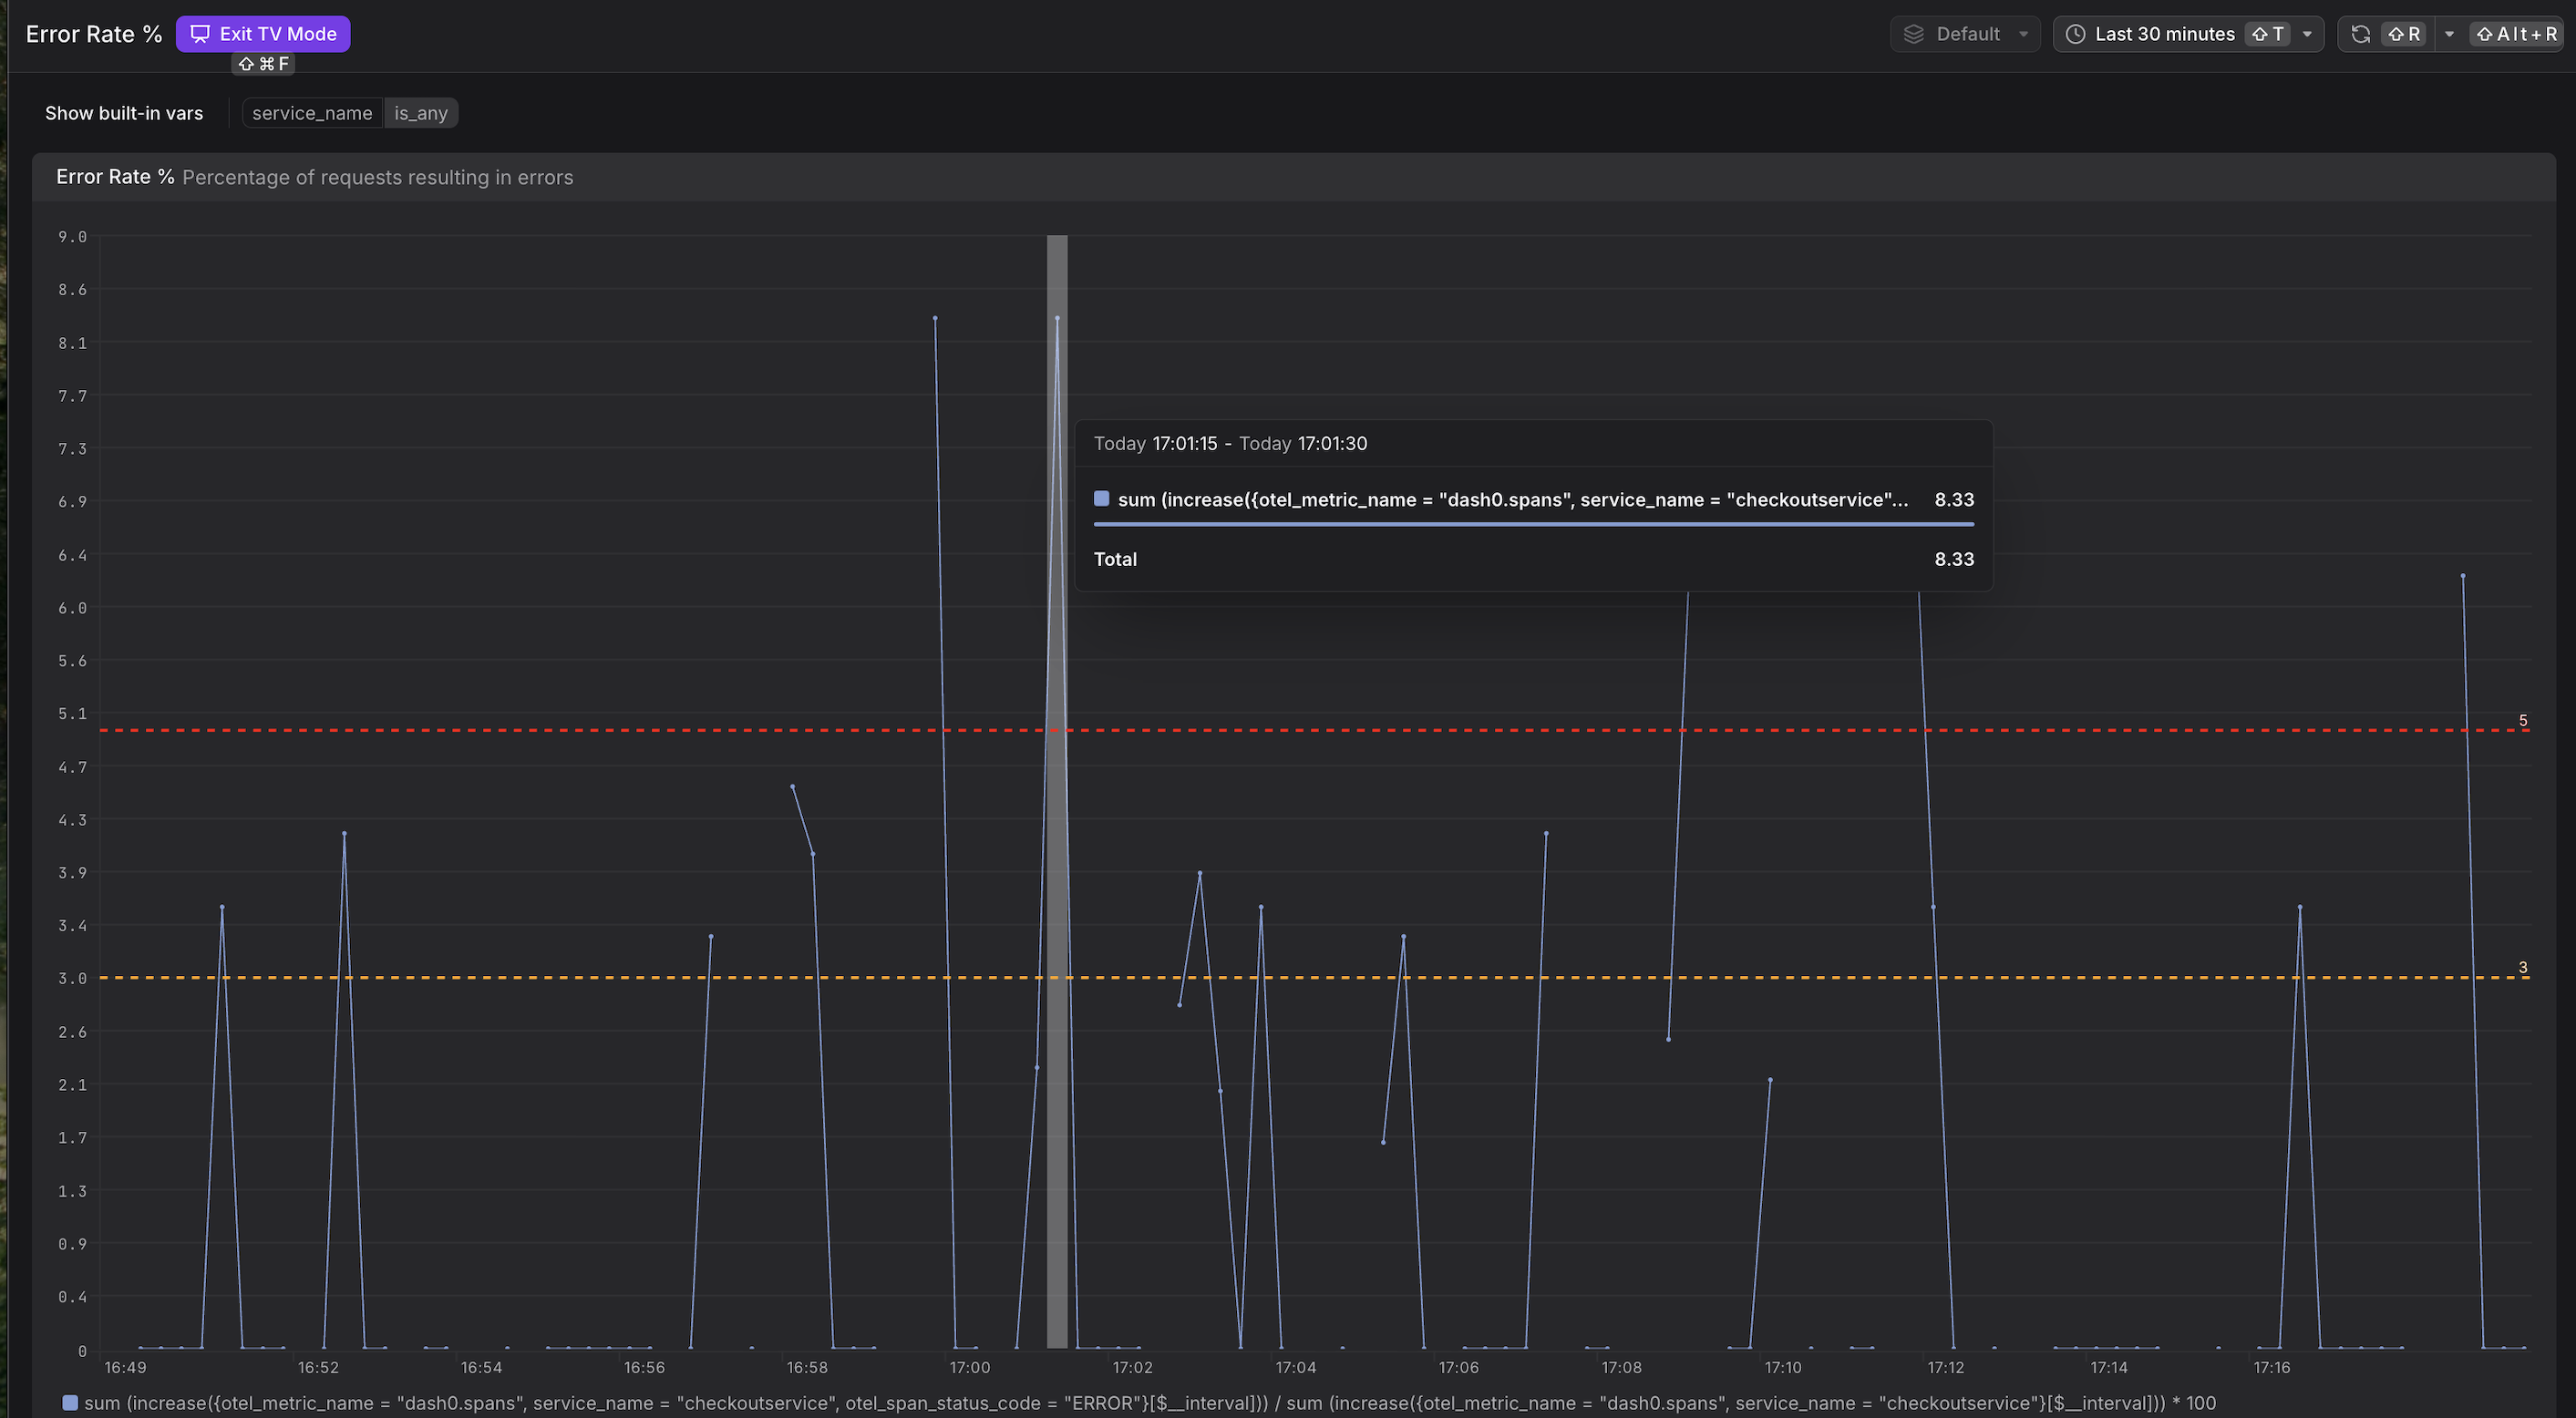
Enable TV Mode
TV Mode removes all navigation chrome and editing controls, providing a distraction-free, full-screen display.
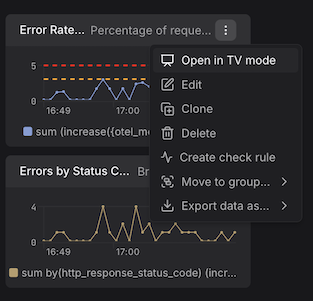
This mode is designed for dashboards displayed on large monitors or shared screens in operations centers.
Bookmark Favorites and Search Dashboards
Mark dashboards as favorites for quick access.
Use the search bar in the dashboard list to filter by name.